
Google Analytics reporting tool
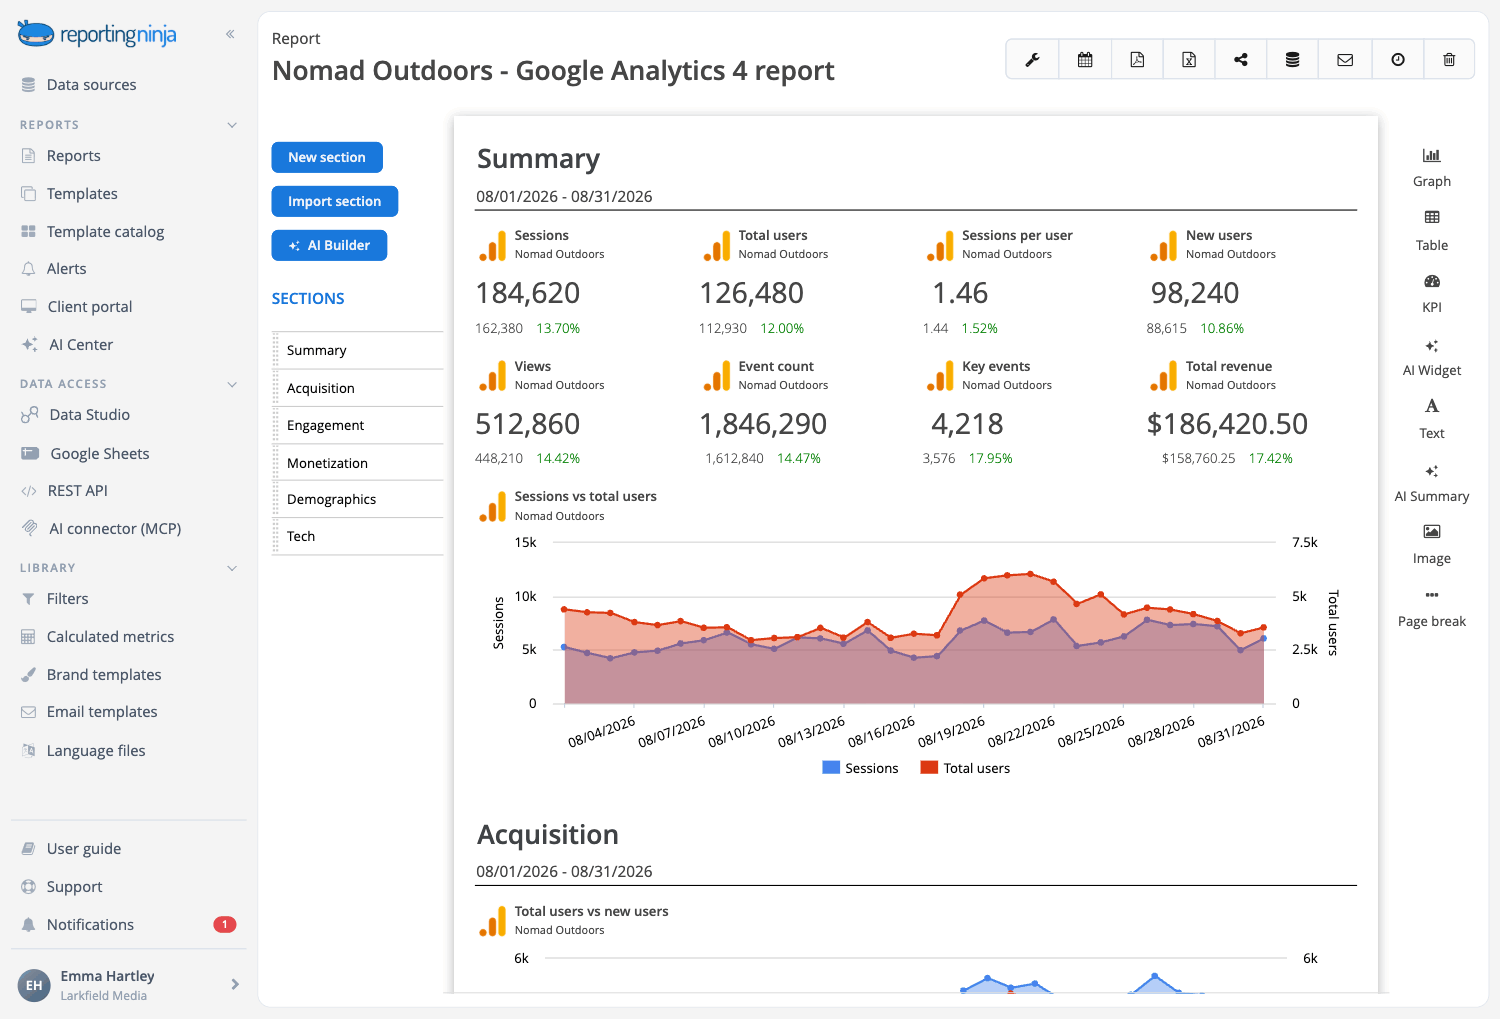
Start from our maintained Google Analytics 4 report or describe your own to AI Builder. Figures straight from Google Analytics 4, next to your other channels, sent in your brand by email, share link or client portal.


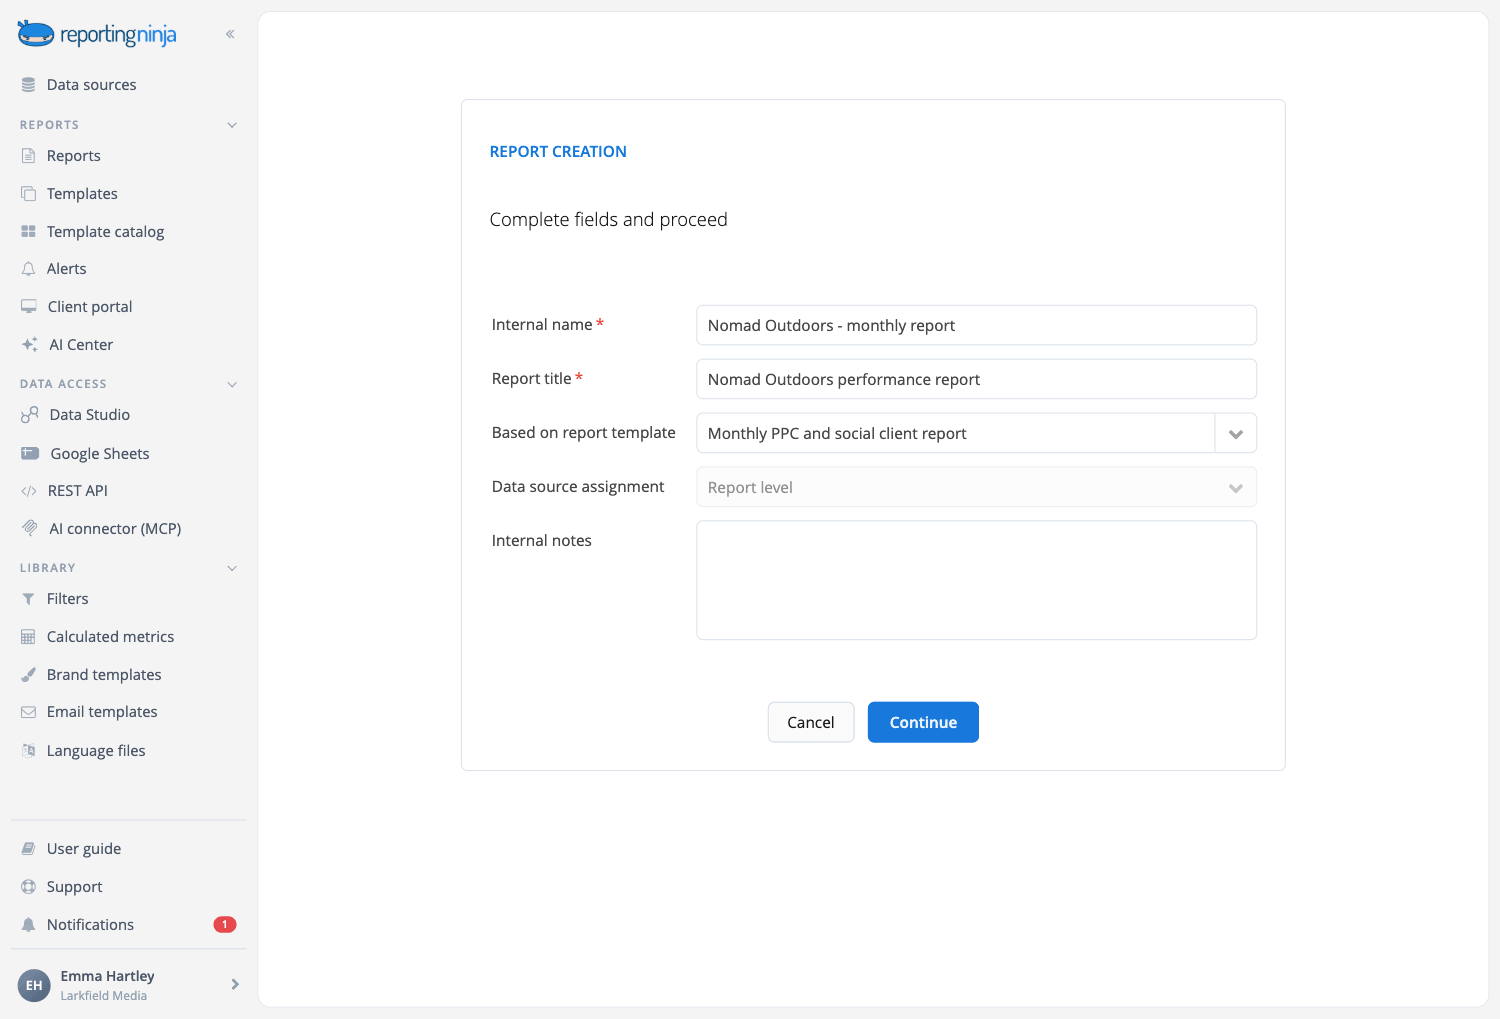
Describe the Google Analytics report and let the AI build it
Sections, widgets and the written analysis, proposed from the data you already have connected and created only when you approve them. Included in every plan.
Start from the Google Analytics 4 report
It opens with how many people came, how many were new, how many visits stayed and how many ended in a result, then shows where they came from, what they looked at and who they are. Maintained by our team.

More ways to start
A monthly SEO report that reads it next to Search Console, and an overview with every data point.

Your own template
Save your version as a template. Change it once and every client report built on it follows.
Traffic channels' analytics
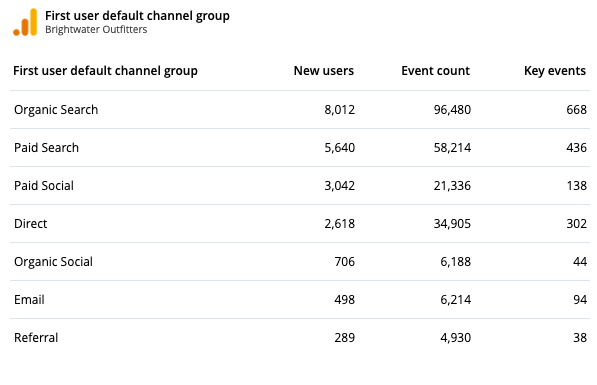
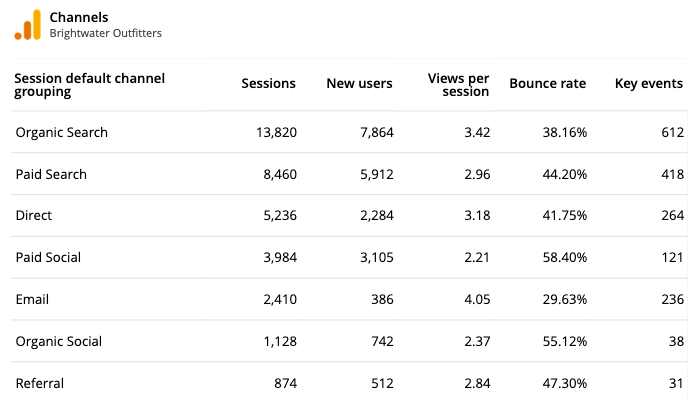
Analyzing your traffic channels is one of the key tasks in order to make well-informed decisions on where to focus your marketing efforts.
Combined with conversions, this is a required analysis to show the return of your activities / investments in each channel.
Track key events & KPIs
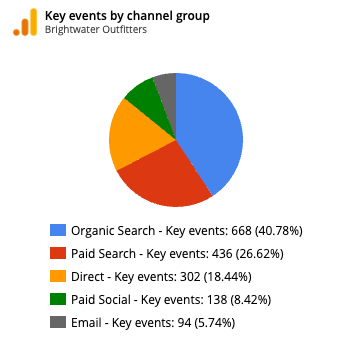
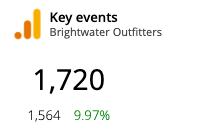
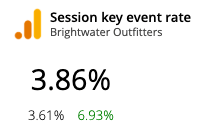
Looking to optimize a website for conversions? First you’ll need to track conversions by marking your key events in Google Analytics.
Our Google Analytics reporting tool highlights revenue, key events, and key event rates so you can present your clients the true value of your strategy and actions.


Take advantage of demographic data
Monitoring your visitors' demographics (age, gender, devices, etc.) can help you identify areas to improve.
A given mobile OS is dropping traffic? Certain age group has a peak of visits? Adjust your website content appropriately to boost conversions.
Your Google Analytics 4 data, in every place you work
Connect Google Analytics 4 once. Every report, dashboard and assistant reuses the same connection.


Data Studio
Our connector, plus a ready-made Google Analytics 4 template.


All six are included on every plan.
Why use Reporting Ninja for your Google Analytics reports
Start your report automation journey with Reporting Ninja.

Really easy to use
Drag and drop the blocks of content you need. The editor shows the report exactly as your client will see it while you work.

Fully customizable
Beyond the widget library, build the exact widget you need: dimensions, metrics, chart type and filters, with a wizard to guide you.

Scheduled reports
Set the schedule once and Reporting Ninja emails each client their report every week or month.

Custom branding
Your logo or your client's, brand colors, fonts and chart styles, with a cover page and a table of contents.

Client portal access
Send a PDF or a share link, or open a branded portal on your own domain where clients log in to their reports.

Multi-language reports
Send each client their report in their own language, with our ready-made language files or one you create.
Create your Google Analytics 4 reports in minutes
Templates, automation and your brand, on every plan.