
Twitter Ads reporting tool
Start from our maintained X Ads report or describe your own to AI Builder. Figures straight from the X Ads API, next to your other channels, sent in your brand by email, share link or client portal.

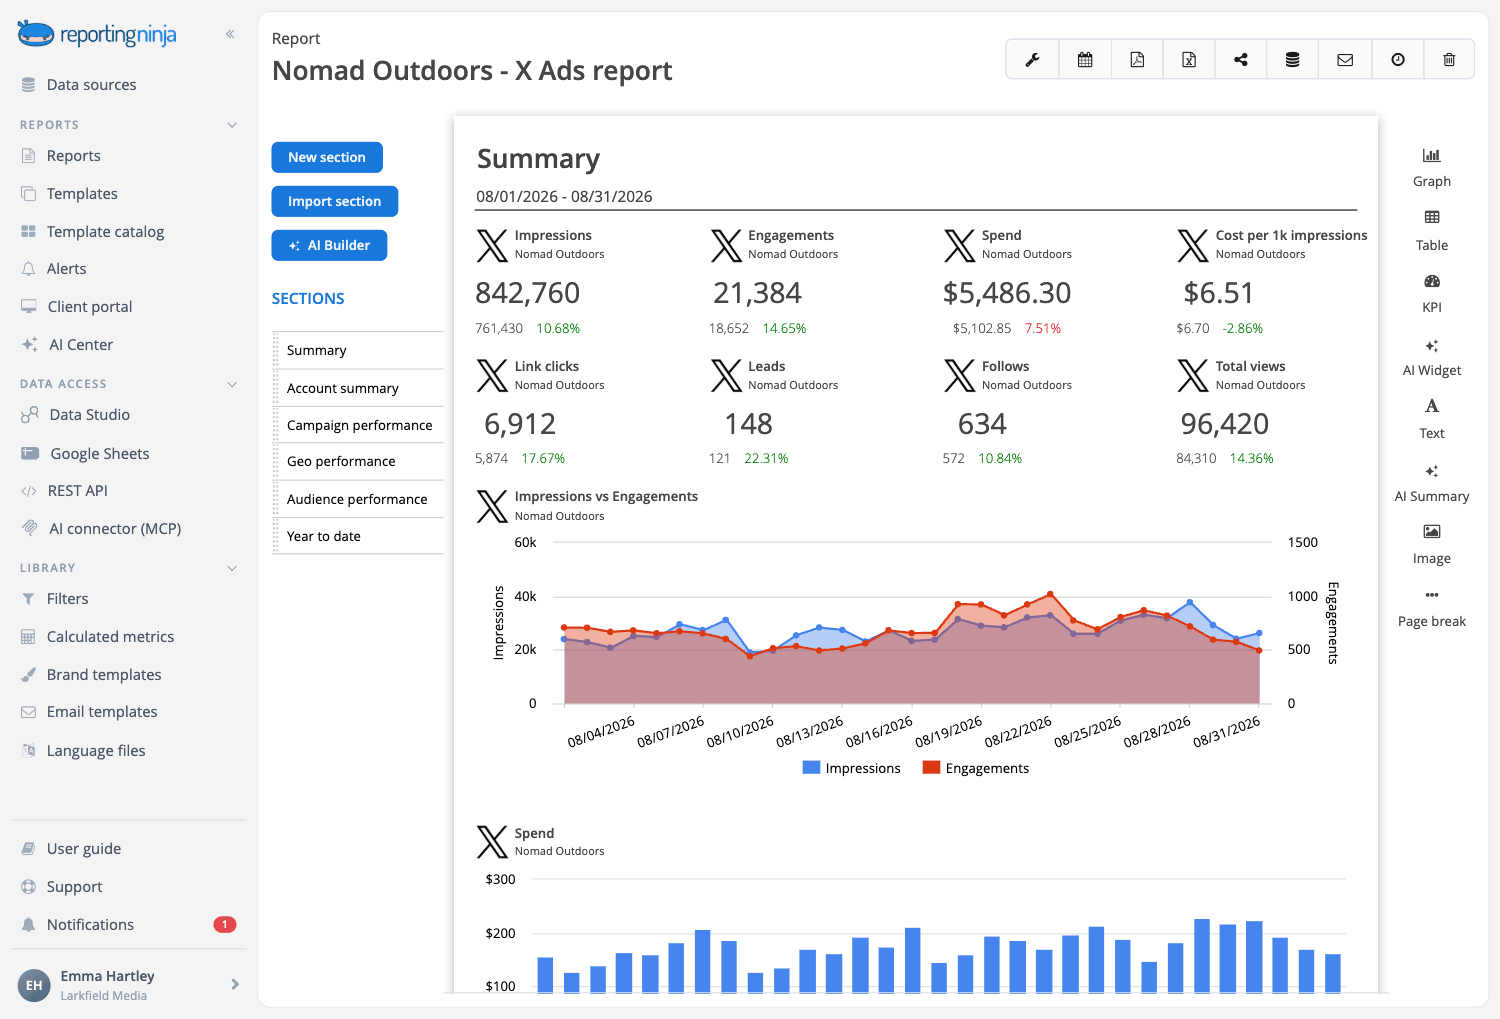

Describe the X Ads report and let the AI build it
Sections, widgets and the written analysis, proposed from the data you already have connected and created only when you approve them. Included in every plan.
Start from the X Ads report in the catalog
It opens with the money and the cost of an interaction, the figure this channel is judged on, then follows the budget through campaigns, ad groups and posts to what they produced on your site. Maintained by our team.

Every data point, for reference
The X Ads overview lays out everything we measure, to pick what goes in your report.

Your own template
Save your version as a template. Change it once and every client report built on it follows.
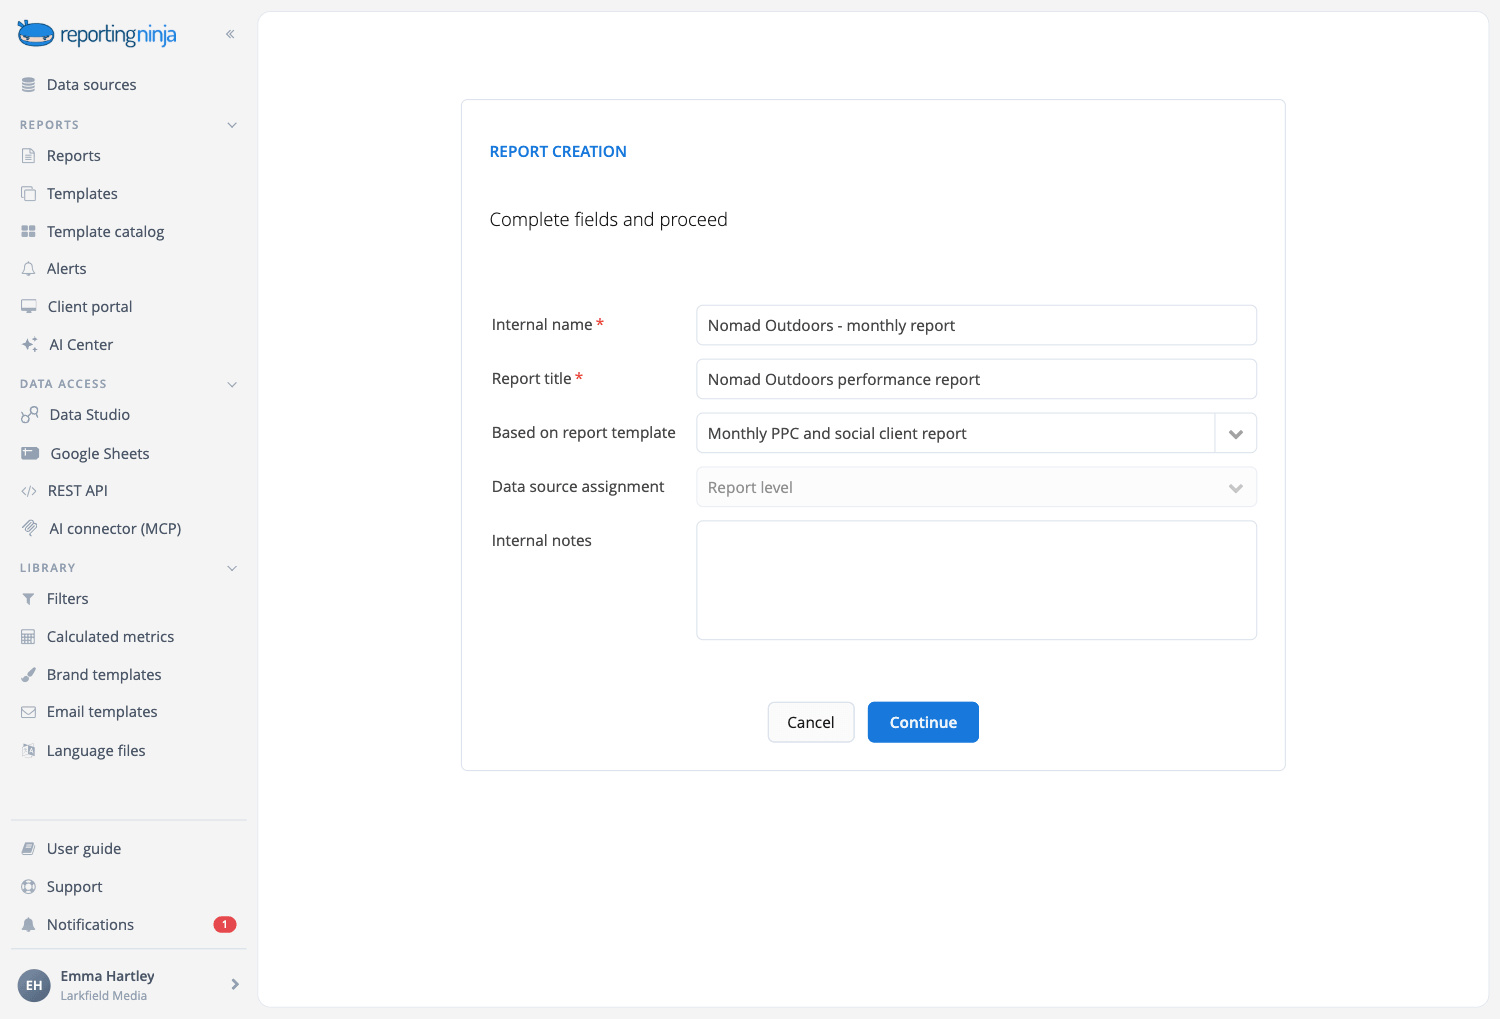


X Ads campaigns monitoring
Say goodbye to your recurring fights with the ads manager to pull the required information to analyze your campaigns. With just a couple of clicks you will have in your X Ads report all the metrics that you need.
You can customize your reports with any widget from our library or you can even create your ad-hoc widgets with the exact metrics and visualization you are looking for.
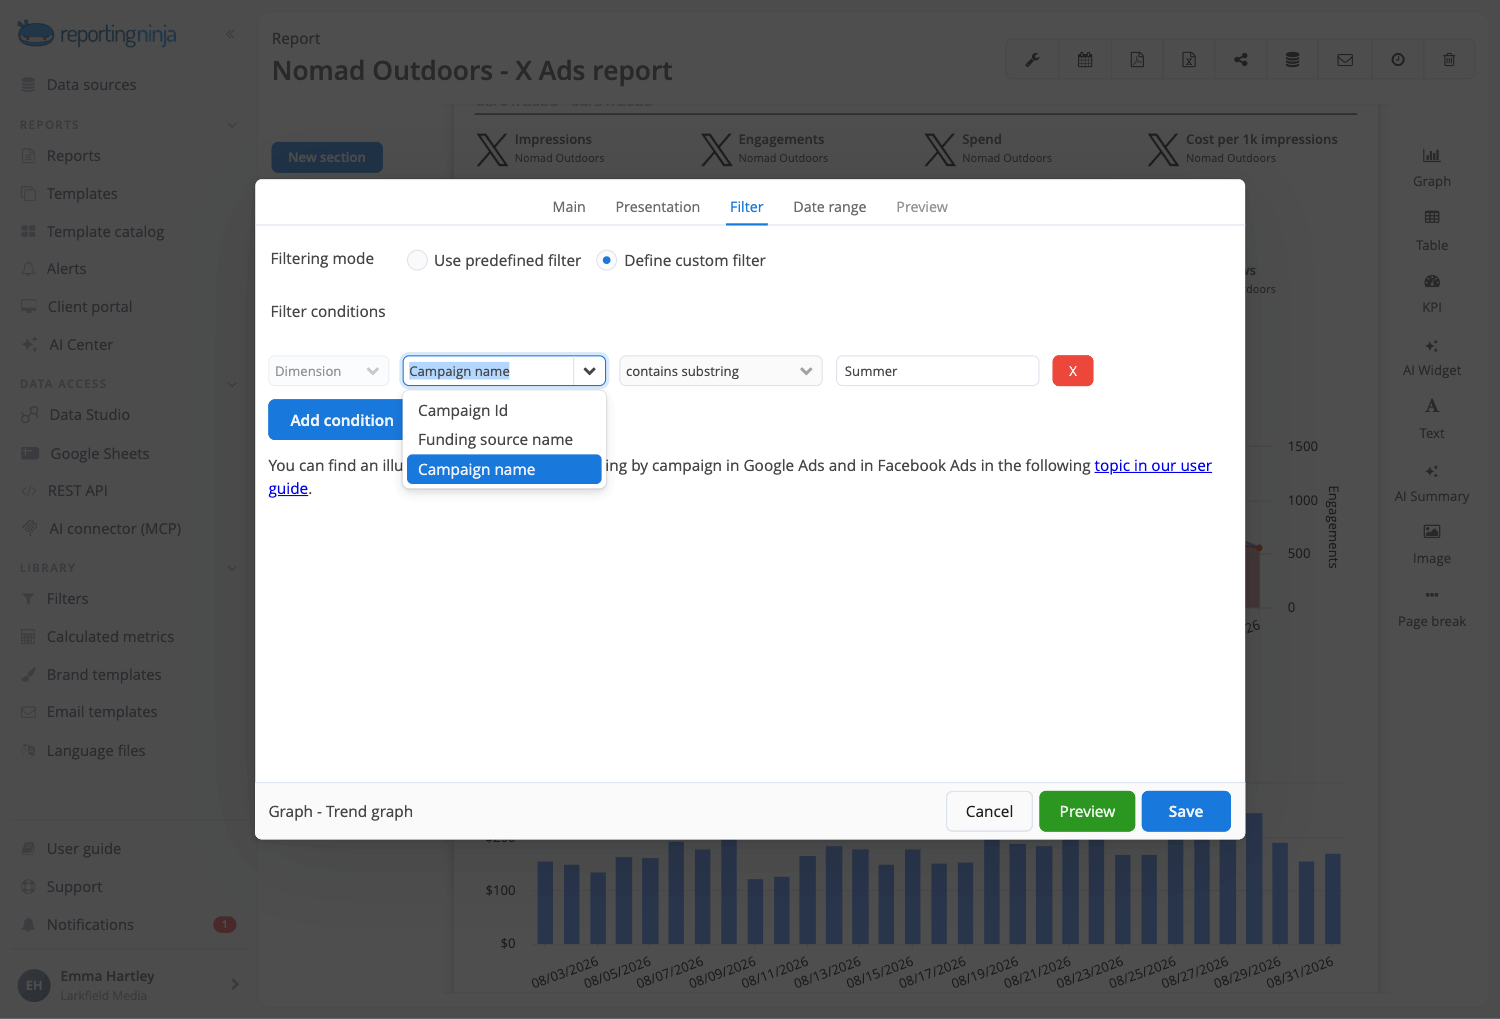
Filter the results for specific campaigns
It is quite common the need to highlight the results of a certain campaign or group of campaigns.
With our X Ads reporting tool, there are multiple ways of filtering your results. You can add filtering conditions directly to widgets, or define and apply reusable filters to multiple widgets or even assign a global filter to an entire section.
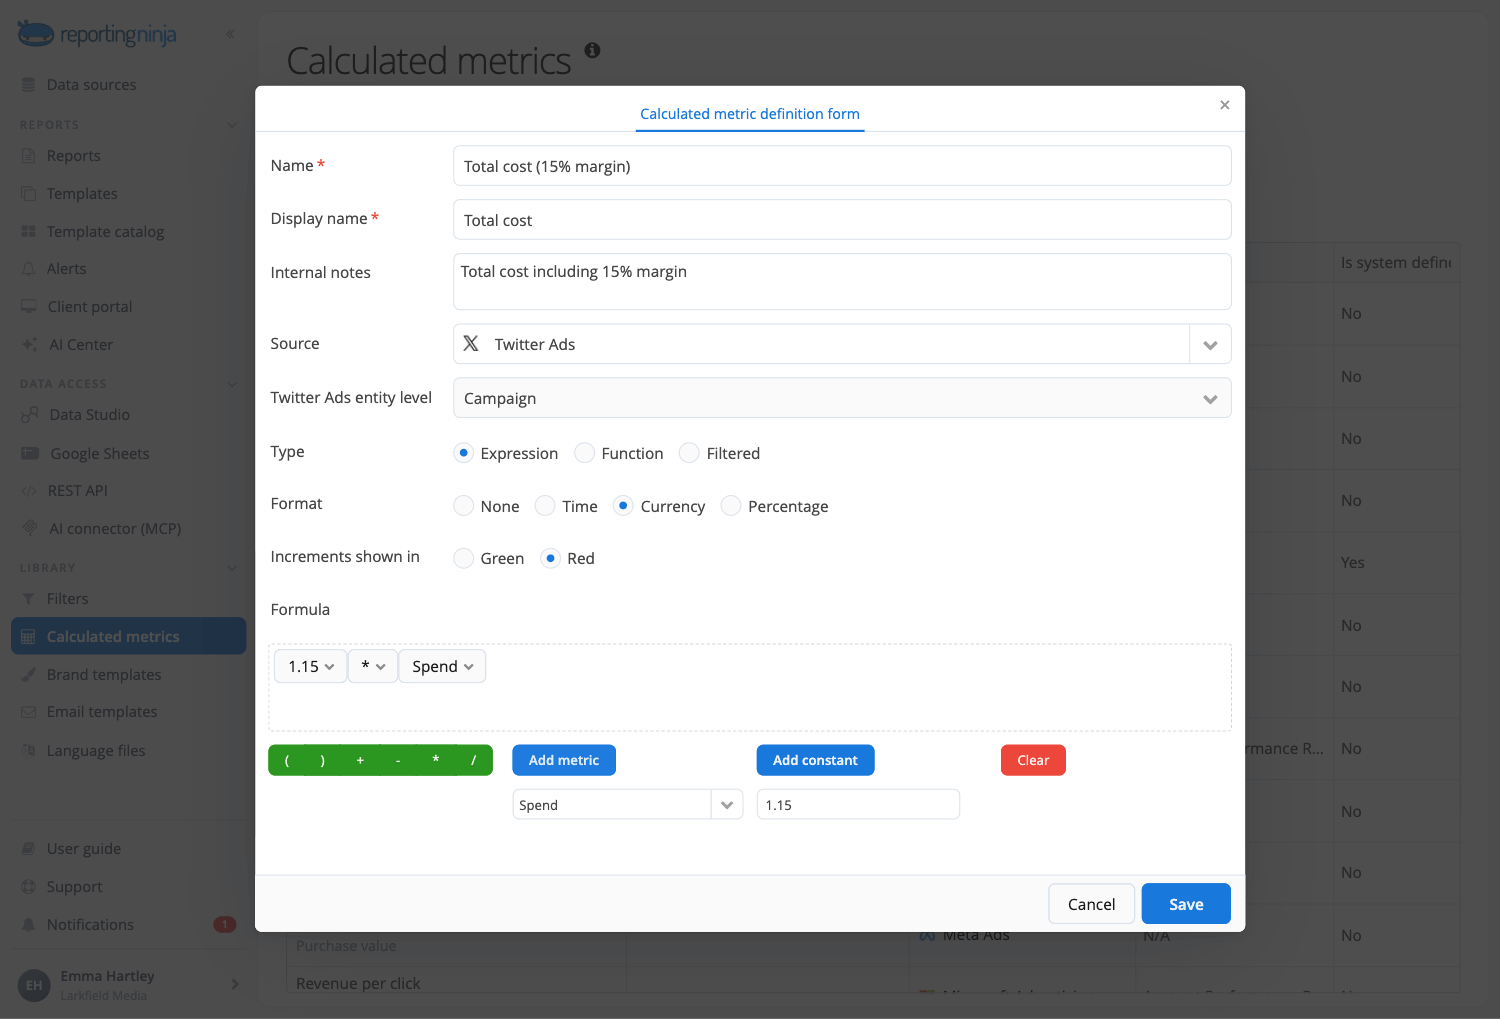
Add a margin or markup to the cost
When building X Ads reports, one of the most frequent needs of our clients is to add a markup on cost metrics.
With the usage of our calculated metrics you have full flexibility to add different markups to different metrics for each client.
Your X Ads data, in every place you work
Connect X Ads once. Every report, dashboard and assistant reuses the same connection.


All six are included on every plan.
Why use Reporting Ninja for your X Ads reports
Start your report automation journey with Reporting Ninja.

Really easy to use
Drag and drop the blocks of content you need. The editor shows the report exactly as your client will see it while you work.

Fully customizable
Beyond the widget library, build the exact widget you need: dimensions, metrics, chart type and filters, with a wizard to guide you.

Scheduled reports
Set the schedule once and Reporting Ninja emails each client their report every week or month.

Custom branding
Your logo or your client's, brand colors, fonts and chart styles, with a cover page and a table of contents.

Client portal access
Send a PDF or a share link, or open a branded portal on your own domain where clients log in to their reports.

Multi-language reports
Send each client their report in their own language, with our ready-made language files or one you create.
Create your X Ads reports in minutes
Templates, automation and your brand, on every plan.