Analytics
May 9, 2026
Guía de medición de marketing: cómo monitorizar KPIs (con ejemplos)



Marketing measurement fixes the moment every agency dreads: when a client asks, “What did we actually get for our spend?”, and the answer is buried across dashboards and spreadsheets.
Done right, it connects campaign activity to the outcomes clients actually care about: leads, revenue, pipeline, and cost efficiency.
This guide covers the KPIs that matter, how to build a measurement framework that works across channels, and how to simplify reporting so you can answer that question with confidence.
Measuring marketing impact usually breaks down not because of missing data, but because of too much of it—scattered across platforms, without context or a clear story.
Here's where most teams run into trouble:
Too many platforms, no unified view: Paid search, paid social, SEO, email, and CRM tools each report performance differently. One optimizes for clicks, another for leads, another for revenue. Without a consistent structure, stakeholders end up comparing disconnected numbers.
Stakeholders want outcomes, not raw metrics: Clients and leadership don’t want a spreadsheet of impressions and CPC changes. They want to know whether marketing is producing pipeline, revenue, and efficient growth. Yet Nielsen’s 2025 Annual Marketing Report found that only 32% of marketers globally measure media spend holistically across both digital and traditional channels, which shows how often teams still lack a complete view of performance.
Unclear KPIs make ROI hard to defend: When every stakeholder defines success differently, reporting becomes reactive. Nielsen also found that stakeholder alignment on key metrics was the top ROI measurement challenge for 22% of marketers, with 19% citing unclear KPIs and data volume as barriers.
Good campaign measurement isn't just reporting; it's a decision-making system. It works across three layers:
Good measurement starts with the right inputs: ad platforms, analytics, CRM, ecommerce, email, and call tracking. The goal is to collect what answers your key questions:
If your data is scattered or incomplete, reporting slows down (and teams end up copying numbers into spreadsheets instead of analyzing performance).
Once the data is in place, the next step is interpretation. Raw numbers become useful when they include context: month-over-month comparisons, budget pacing, channel benchmarks, and funnel conversion rates.
For example, a 12% rise in cost per lead may look bad in isolation—but if lead quality improved and revenue grew, the higher CPL could be entirely justified. Marketing intelligence practices help teams read these signals accurately.
The final layer is action. Measurement should tell you:
If measurement doesn't lead to action, it's just reporting.
The best marketing KPIs are the ones that help stakeholders make decisions. Here are the metrics that matter most for agencies and marketing teams:
The right KPI mix depends on the goal. A lead generation campaign shouldn't be judged on clicks alone. An ecommerce campaign needs more than traffic data. A client report shouldn’t bury the most important outcome beneath platform-level metrics that don’t actually answer the stakeholder’s main question.
A marketing measurement framework gives your reporting structure. Instead of checking random metrics each month, you define what success means, which data supports it, and how results should guide decisions.
Start with the business objective, then work backwards to the KPIs that prove progress.
This keeps reporting tied to outcomes and reduces metric overload. Your metrics dashboard should reflect the goal, not every available number.
A funnel-based framework shows how performance changes across the customer journey. It usually breaks measurement into stages such as awareness, engagement, lead capture, sales conversion, and retention.
This is especially useful when stakeholders need to understand where performance is breaking down.
For example, a campaign may generate strong traffic but weak form submissions. Or it may generate many leads, but few sales-qualified opportunities. A funnel view makes those gaps easier to see.
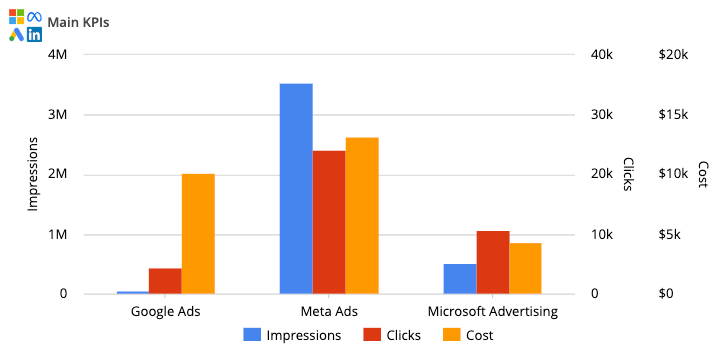
A channel-based framework compares performance across platforms, such as Google Ads, Meta Ads, LinkedIn Ads, SEO, email, and organic social.
This framework helps teams understand where budget, attention, and optimization work should go. It can show which channels drive volume, which drive quality, and which are becoming less efficient over time.
The key is to avoid treating each channel in isolation. A paid search campaign may capture high-intent demand created by social or content. Email may convert leads that originally came from paid media. Good channel reporting should show performance clearly without pretending every channel operates alone.
Reporting Ninja can support this by bringing cross-channel data into cleaner reporting views, so stakeholders do not have to jump between platforms to understand performance.
A cadence-based framework defines what gets reviewed daily, weekly, monthly, and quarterly.
This matters because not every metric needs the same level of attention.
This framework is useful for agencies and lean marketing teams because it prevents over-reporting. It also creates a repeatable rhythm, so reporting does not become a last-minute scramble before client calls or leadership reviews.
For most agencies and reporting teams, the strongest approach combines all four. Set goals first, map the funnel, compare channel performance, and use a clear cadence to keep everyone aligned. With Reporting Ninja, you can turn that framework into automated, client-ready reports by connecting your data sources, organizing your KPIs, and delivering clearer performance updates without rebuilding reports from scratch each month.
Marketing measurement gets easier when you reduce noise, standardize your process, and focus every report on decisions rather than data volume.
Before choosing KPIs, define what the report needs to help someone decide.
A client may need to decide whether to increase ad spend. A marketing lead may need to decide whether to pause a campaign. A founder may need to understand whether acquisition costs are sustainable. Each decision requires a different set of metrics.
If every report uses different metrics, naming conventions, or layouts, performance becomes harder to compare.
Standardization is especially important for agencies managing multiple clients. It helps teams review accounts faster, spot unusual changes, and explain results consistently. You can still customize each report, but the core structure should remain familiar.
A good starting point is to create a shared KPI library by campaign type, such as:
This makes reporting more repeatable without making it rigid.
Manual reporting is one of the easiest places for measurement to break down. Teams copy data from different platforms, reformat spreadsheets, rebuild charts, and check numbers under deadline pressure. That creates room for errors and leaves less time for analysis.
Automation solves the repetitive part of measurement. With Reporting Ninja, you can connect marketing data sources, create reusable report templates, and schedule custom reports for clients or internal stakeholders. This helps teams spend less time assembling reports and more time explaining performance.
It also improves consistency. The same report structure, metrics, and delivery rhythm can be reused across campaigns, clients, or reporting periods.
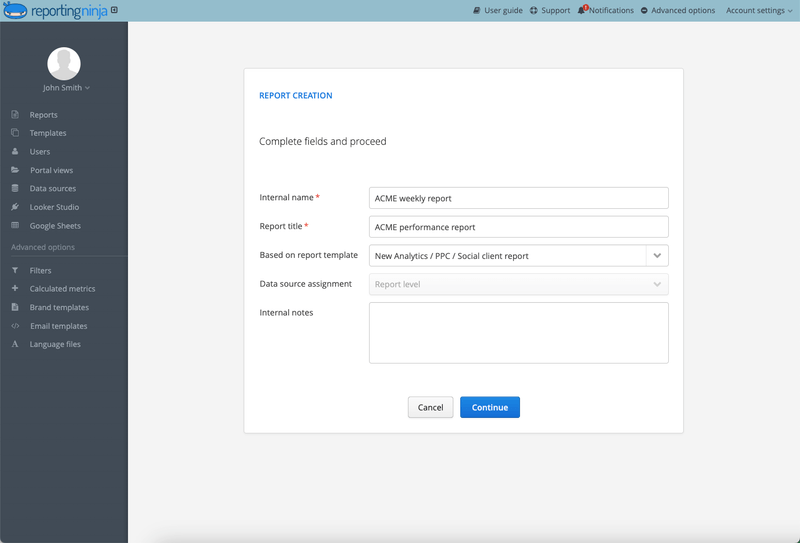
Simplify your marketing measurement workflow with Reporting Ninja. Build automated reports that connect your data, highlight the right KPIs, and give clients a clearer view of performance. Start your free trial hoy.
Los mismos datos pueden contar historias muy diferentes según cómo se presenten. Estos tres ejemplos muestran cómo estructurar la medición en torno a un propósito claro facilita la explicación y la toma de decisiones sobre el rendimiento.
Un panel de rendimiento ofrece a las partes interesadas una visión rápida y fiable de los cambios en los canales clave. Para un cliente de medios de pago, esto podría incluir la inversión, las conversiones, el coste por lead, el ROAS y los ingresos por plataforma, junto con comparaciones interperíodo.
Un buen panel responde primero a las preguntas más importantes:
Este tipo de vista es especialmente útil cuando los clientes necesitan actualizaciones rápidas sin tener que revisar cada plataforma publicitaria.
La medición del embudo ayuda a los equipos a comprender dónde el rendimiento está ganando o perdiendo impulso.
Para una campaña de generación de leads, el embudo podría mostrar impresiones, clics, visitas a la página de destino, envíos de formularios, leads cualificados, llamadas programadas, oportunidades e ingresos cerrados. Esto facilita ver si el problema es el volumen de tráfico, la conversión de la página de destino, la calidad del lead o el seguimiento de ventas.
Por ejemplo, una campaña puede parecer exitosa porque el volumen de leads aumentó. Pero si la tasa de leads cualificados disminuyó, la campaña podría estar atrayendo a la audiencia equivocada. La medición del embudo proporciona al equipo el contexto necesario para ajustar la segmentación, los mensajes o la asignación de presupuesto.
Aquí es donde la medición se vuelve más útil que la elaboración de informes. Identifica la etapa que requiere acción.
Los informes multicanal muestran cómo cada canal contribuye al panorama general, en lugar de juzgar el rendimiento de forma aislada.
Por ejemplo, las redes sociales de pago pueden presentar nuevos prospectos, el SEO puede captar la demanda en fase de investigación, la búsqueda de pago puede convertir a compradores con alta intención, y el email puede ayudar a cerrar o reactivar leads. Si cada canal se informa por separado, las partes interesadas podrían pasar por alto cómo esos puntos de contacto trabajan juntos.
Un buen informe multicanal debe mostrar:
Reporting Ninja ayuda a los equipos a crear estas vistas conectando fuentes de datos de marketing en informes claros y repetibles. En lugar de unir capturas de pantalla, hojas de cálculo y exportaciones, puedes mostrar a los clientes lo que cada canal está aportando en un solo lugar.
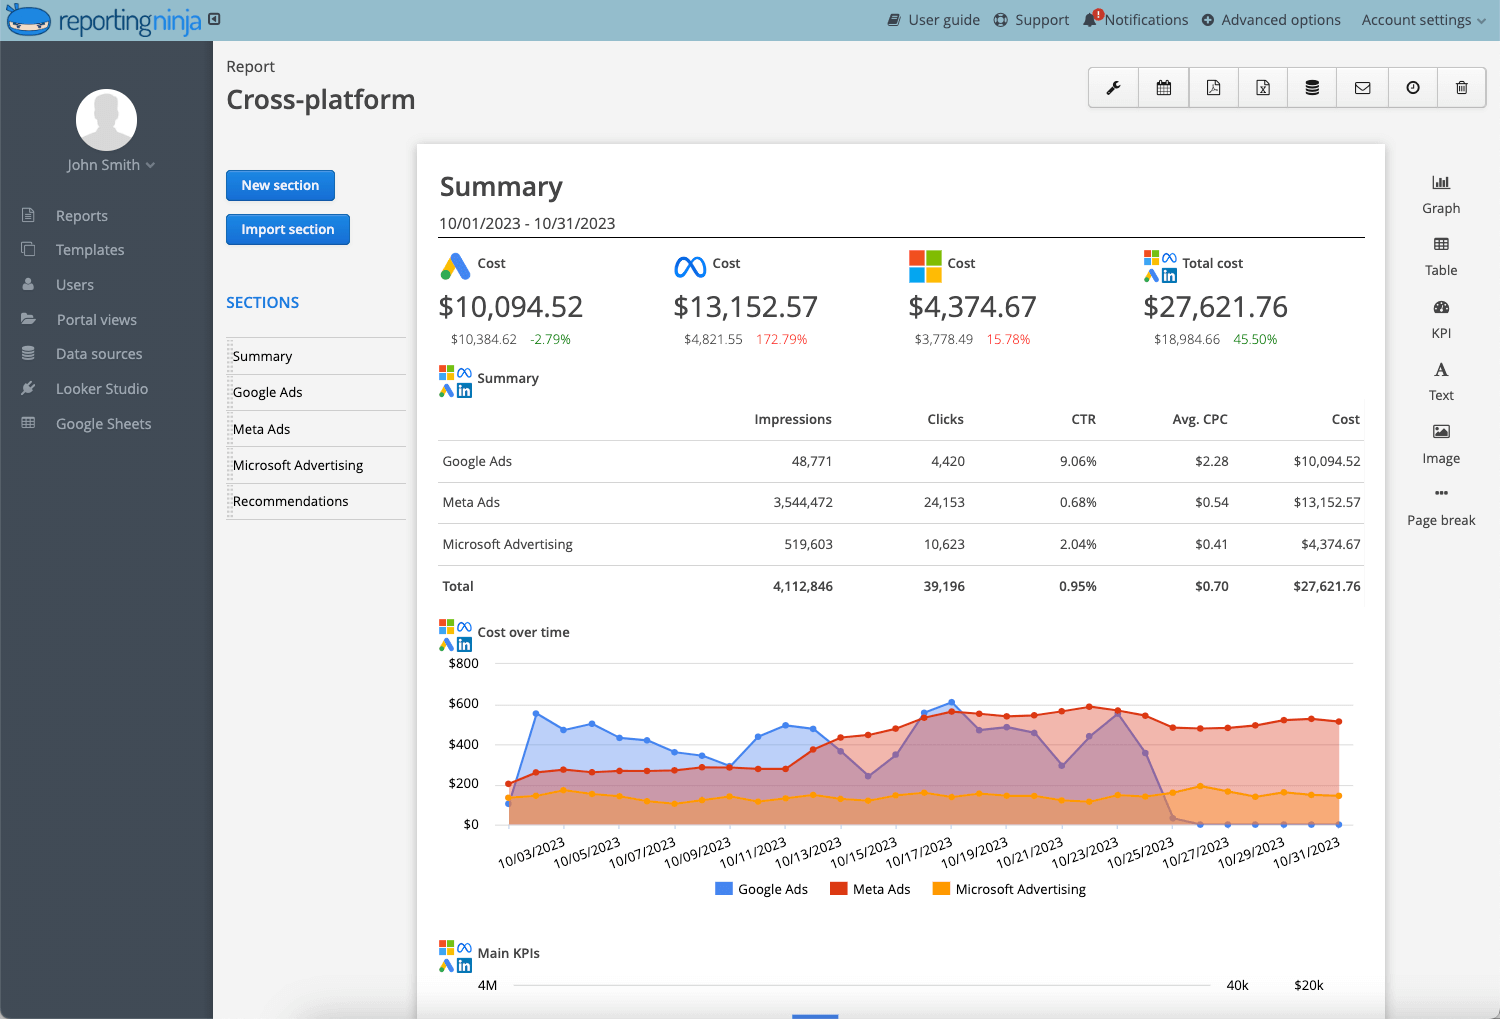
La mejor herramienta de informes de marketing conecta datos, visualiza el rendimiento claramente y automatiza el trabajo repetitivo. Para agencias y equipos de marketing, esas tres cosas importan más que una larga lista de funciones.
Una herramienta de informes debería conectarse a tus plataformas principales: anuncios pagados, análisis, SEO, comercio electrónico, CRM y redes sociales. Si no lo hace, tu equipo seguirá exportando datos manualmente y reconstruyendo informes cada mes.
La pregunta correcta no es "¿Cuántas integraciones ofrece esta herramienta?", sino "¿Conecta las fuentes que más usamos?"
Las integraciones de Reporting Ninja están diseñadas en torno a las plataformas en las que los equipos de marketing confían más en su día a día.
Una buena herramienta de informes facilita la comprensión del rendimiento, no solo lo hace más bonito a la vista. Los interesados deberían poder ver qué cambió, por qué importa, y dónde se necesita atención sin tener que interpretar exportaciones de plataforma en bruto.
Reporting Ninja ayuda a los equipos a presentar los datos en un formato más digerible, para que los informes parezcan menos exportaciones en bruto y más actualizaciones de rendimiento útiles.
Automatización
La automatización es lo que hace que los informes sean escalables. Sin ella, cada ciclo de informes implica el mismo trabajo manual: exportar datos, actualizar gráficos y verificar fórmulas. Esto funciona para un puñado de campañas, pero no para agencias que gestionan múltiples clientes a través de múltiples canales.
Reporting Ninja te permite reutilizar plantillas, actualizar datos automáticamente y programar informes sin tener que reconstruirlos desde cero. Así es como los equipos dedican menos tiempo al montaje de informes y más al análisis real. También admite informes por correo electrónico y informes de PPC en un único flujo de trabajo
La medición de marketing funciona mejor cuando ofrece a tu equipo y a las partes interesadas una respuesta clara: qué pasó, por qué pasó y qué debería pasar a continuación.
Eso empieza con los KPI correctos, pero también depende del proceso de elaboración de informes que los respalda. Si tu equipo sigue recopilando datos manualmente, reconstruyendo informes o cambiando entre plataformas para explicar el rendimiento, la medición se vuelve más lenta de lo necesario.
Reporting Ninja ayuda a simplificar ese flujo de trabajo. Puedes conectar tus datos de marketing, crear informes más claros y listos para el cliente, y automatizar la elaboración de informes recurrentes, para que tu equipo pueda dedicar más tiempo a mejorar el rendimiento y menos tiempo a preparar actualizaciones.
Empieza tu prueba gratuita de 15 días hoy. Comprueba la diferencia que supone.
La medición de marketing es el proceso de seguimiento del rendimiento de las campañas en relación con objetivos específicos (como clientes potenciales, ingresos o coste de adquisición de clientes) para determinar qué funciona.
El análisis de marketing identifica patrones y tendencias en tus datos. La medición de marketing rastrea si las campañas están alcanzando los objetivos y KPI definidos.
Utiliza un marco de informes multicanal que rastree la contribución por canal (tráfico, clientes potenciales e ingresos) en lugar de juzgar cada plataforma de forma aislada. Reporting Ninja puede ayudarte a consolidar esos datos en una vista única.
Regístrate para disfrutar una prueba gratuita de 15 días. No se requiere tarjeta de crédito.

Con calidad, robustez y fiabilidad garantizadas.