Analytics
May 9, 2026
Marketing measurement guide: how to track KPIs (+examples)



Marketing measurement fixes the moment every agency dreads: when a client asks, “What did we actually get for our spend?”, and the answer is buried across dashboards and spreadsheets.
Done right, it connects campaign activity to the outcomes clients actually care about: leads, revenue, pipeline, and cost efficiency.
This guide covers the KPIs that matter, how to build a measurement framework that works across channels, and how to simplify reporting so you can answer that question with confidence.
Measuring marketing impact usually breaks down not because of missing data, but because of too much of it—scattered across platforms, without context or a clear story.
Here's where most teams run into trouble:
Too many platforms, no unified view: Paid search, paid social, SEO, email, and CRM tools each report performance differently. One optimizes for clicks, another for leads, another for revenue. Without a consistent structure, stakeholders end up comparing disconnected numbers.
Stakeholders want outcomes, not raw metrics: Clients and leadership don’t want a spreadsheet of impressions and CPC changes. They want to know whether marketing is producing pipeline, revenue, and efficient growth. Yet Nielsen’s 2025 Annual Marketing Report found that only 32% of marketers globally measure media spend holistically across both digital and traditional channels, which shows how often teams still lack a complete view of performance.
Unclear KPIs make ROI hard to defend: When every stakeholder defines success differently, reporting becomes reactive. Nielsen also found that stakeholder alignment on key metrics was the top ROI measurement challenge for 22% of marketers, with 19% citing unclear KPIs and data volume as barriers.
{{cta-block-v1}}
Good campaign measurement isn't just reporting; it's a decision-making system. It works across three layers:
Good measurement starts with the right inputs: ad platforms, analytics, CRM, ecommerce, email, and call tracking. The goal is to collect what answers your key questions:
If your data is scattered or incomplete, reporting slows down (and teams end up copying numbers into spreadsheets instead of analyzing performance).
Once the data is in place, the next step is interpretation. Raw numbers become useful when they include context: month-over-month comparisons, budget pacing, channel benchmarks, and funnel conversion rates.
For example, a 12% rise in cost per lead may look bad in isolation—but if lead quality improved and revenue grew, the higher CPL could be entirely justified. Marketing intelligence practices help teams read these signals accurately.
The final layer is action. Measurement should tell you:
If measurement doesn't lead to action, it's just reporting.
The best marketing KPIs are the ones that help stakeholders make decisions. Here are the metrics that matter most for agencies and marketing teams:
The right KPI mix depends on the goal. A lead generation campaign shouldn't be judged on clicks alone. An ecommerce campaign needs more than traffic data. A client report shouldn’t bury the most important outcome beneath platform-level metrics that don’t actually answer the stakeholder’s main question.
A marketing measurement framework gives your reporting structure. Instead of checking random metrics each month, you define what success means, which data supports it, and how results should guide decisions.
Start with the business objective, then work backwards to the KPIs that prove progress.
This keeps reporting tied to outcomes and reduces metric overload. Your metrics dashboard should reflect the goal, not every available number.
A funnel-based framework shows how performance changes across the customer journey. It usually breaks measurement into stages such as awareness, engagement, lead capture, sales conversion, and retention.
This is especially useful when stakeholders need to understand where performance is breaking down.
For example, a campaign may generate strong traffic but weak form submissions. Or it may generate many leads, but few sales-qualified opportunities. A funnel view makes those gaps easier to see.
A channel-based framework compares performance across platforms, such as Google Ads, Meta Ads, LinkedIn Ads, SEO, email, and organic social.
This framework helps teams understand where budget, attention, and optimization work should go. It can show which channels drive volume, which drive quality, and which are becoming less efficient over time.
The key is to avoid treating each channel in isolation. A paid search campaign may capture high-intent demand created by social or content. Email may convert leads that originally came from paid media. Good channel reporting should show performance clearly without pretending every channel operates alone.
Reporting Ninja can support this by bringing cross-channel data into cleaner reporting views, so stakeholders do not have to jump between platforms to understand performance.
A cadence-based framework defines what gets reviewed daily, weekly, monthly, and quarterly.
This matters because not every metric needs the same level of attention.
This framework is useful for agencies and lean marketing teams because it prevents over-reporting. It also creates a repeatable rhythm, so reporting does not become a last-minute scramble before client calls or leadership reviews.
For most agencies and reporting teams, the strongest approach combines all four. Set goals first, map the funnel, compare channel performance, and use a clear cadence to keep everyone aligned. With Reporting Ninja, you can turn that framework into automated, client-ready reports by connecting your data sources, organizing your KPIs, and delivering clearer performance updates without rebuilding reports from scratch each month.
{{cta-block-v1}}
Marketing measurement gets easier when you reduce noise, standardize your process, and focus every report on decisions rather than data volume.
Before choosing KPIs, define what the report needs to help someone decide.
A client may need to decide whether to increase ad spend. A marketing lead may need to decide whether to pause a campaign. A founder may need to understand whether acquisition costs are sustainable. Each decision requires a different set of metrics.
If every report uses different metrics, naming conventions, or layouts, performance becomes harder to compare.
Standardization is especially important for agencies managing multiple clients. It helps teams review accounts faster, spot unusual changes, and explain results consistently. You can still customize each report, but the core structure should remain familiar.
A good starting point is to create a shared KPI library by campaign type, such as:
This makes reporting more repeatable without making it rigid.
Manual reporting is one of the easiest places for measurement to break down. Teams copy data from different platforms, reformat spreadsheets, rebuild charts, and check numbers under deadline pressure. That creates room for errors and leaves less time for analysis.
Automation solves the repetitive part of measurement. With Reporting Ninja, you can connect marketing data sources, create reusable report templates, and schedule custom reports for clients or internal stakeholders. This helps teams spend less time assembling reports and more time explaining performance.
It also improves consistency. The same report structure, metrics, and delivery rhythm can be reused across campaigns, clients, or reporting periods.
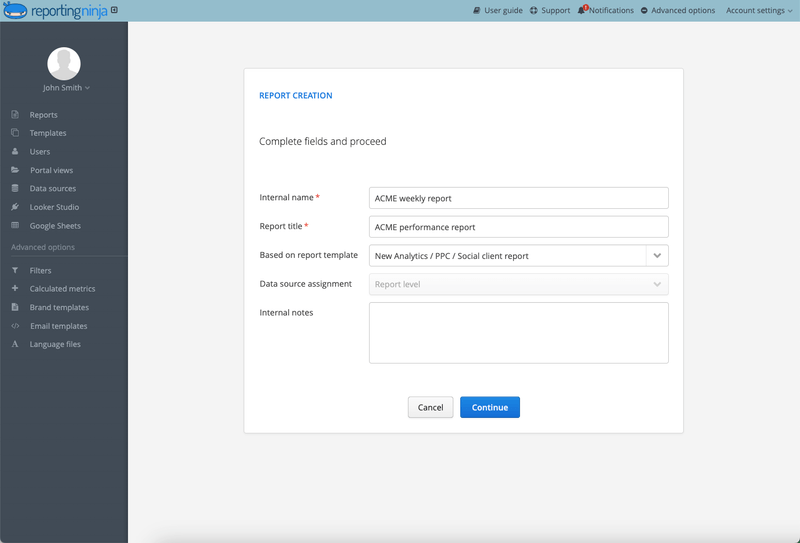
Simplify your marketing measurement workflow with Reporting Ninja. Build automated reports that connect your data, highlight the right KPIs, and give clients a clearer view of performance. Start your free trial today.
The same data can tell very different stories depending on how it's presented. These three examples show how structuring measurement around a clear purpose makes performance easier to explain and act on.
A performance dashboard gives stakeholders a fast, reliable view of what changed across key channels. For a paid media client, this might include spend, conversions, cost per lead, ROAS, and revenue by platform—alongside period-over-period comparisons.
A strong dashboard answers the most important questions first:
This kind of view is especially useful when clients need quick updates without digging through each ad platform.
Funnel measurement helps teams understand where performance is gaining or losing momentum.
For a lead generation campaign, the funnel might show impressions, clicks, landing page visits, form submissions, qualified leads, booked calls, opportunities, and closed revenue. This makes it easier to see whether the problem is traffic volume, landing page conversion, lead quality, or sales follow-up.
For example, a campaign may look successful because lead volume increased. But if the qualified lead rate dropped, the campaign may be attracting the wrong audience. Funnel measurement gives the team the context needed to adjust targeting, messaging, or budget allocation.
This is where measurement becomes more useful than reporting. It identifies the stage that needs action.
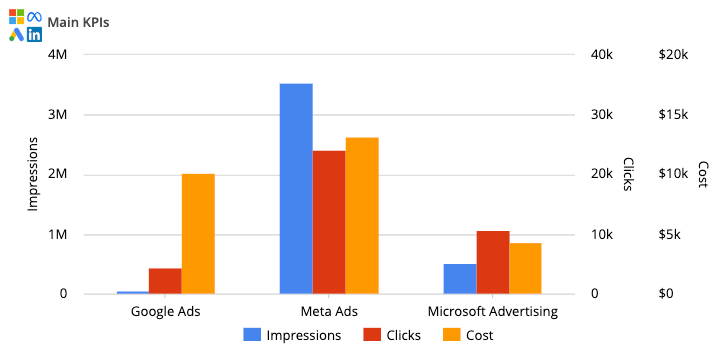
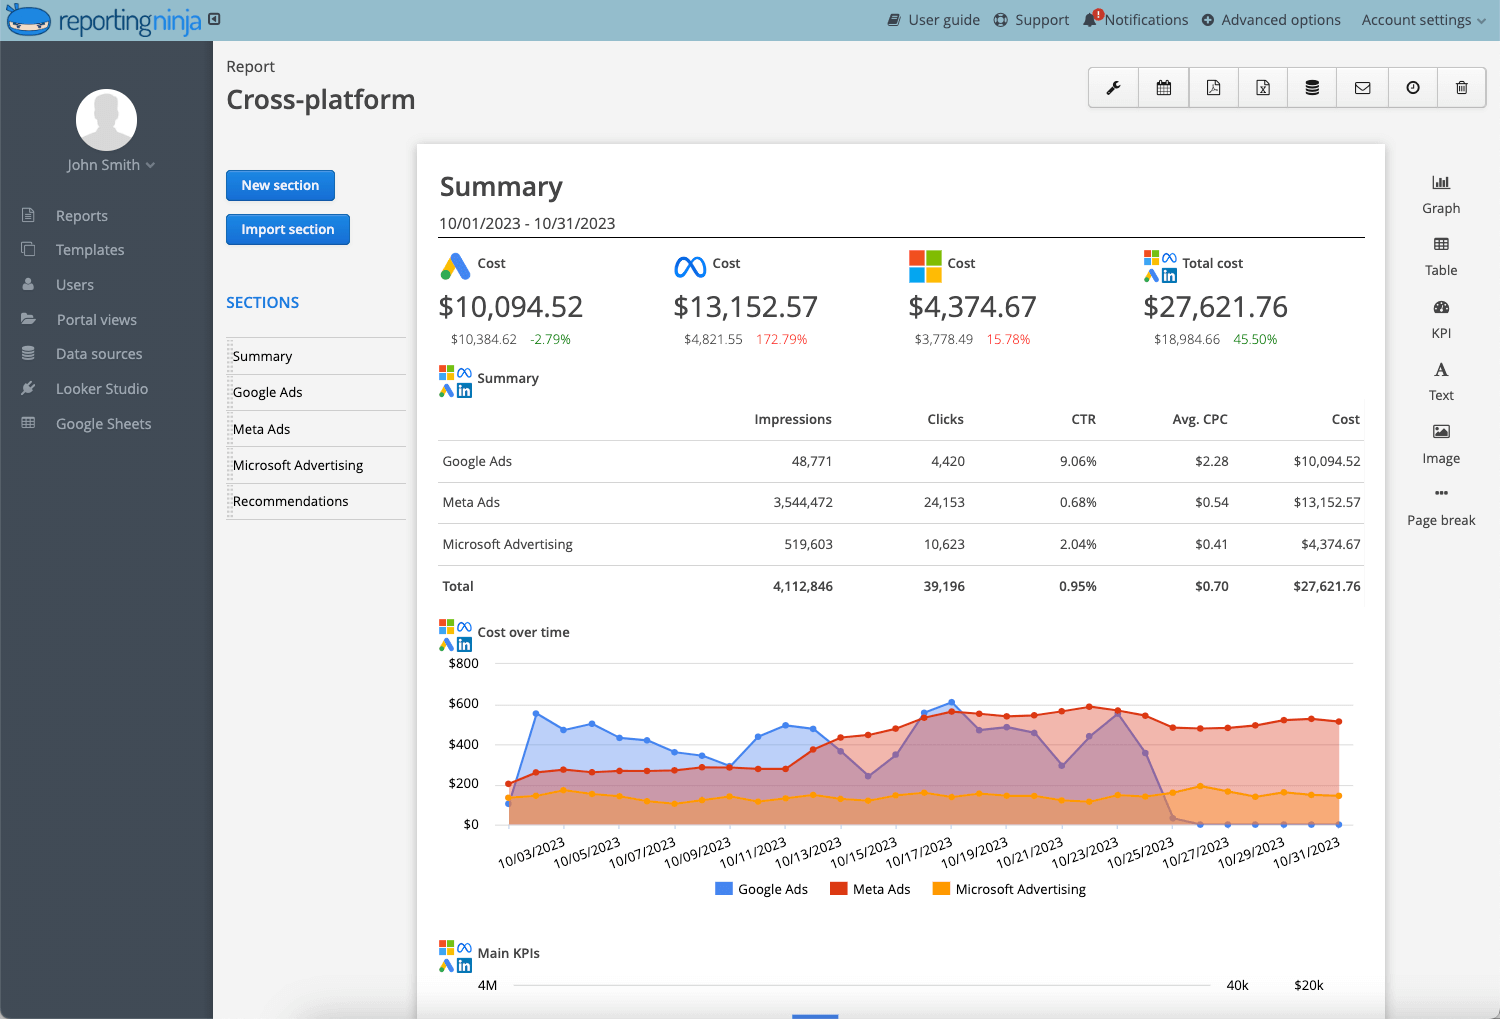
Cross-channel reporting shows how each channel contributes to the bigger picture, instead of judging performance in isolation.
For example, paid social may introduce new prospects, SEO may capture research-stage demand, paid search may convert high-intent buyers, and email may help close or reactivate leads. If each channel is reported separately, stakeholders may miss how those touchpoints work together.
A good cross-channel report should show:
Reporting Ninja helps teams build these views by connecting marketing data sources into clear, repeatable reports. Instead of stitching together screenshots, spreadsheets, and exports, you can show clients what each channel is contributing in one place.
The best marketing reporting tool connects data, visualizes performance clearly, and automates repetitive work. For agencies and marketing teams, those three things matter more than a long feature list.
A reporting tool should connect to your core platforms: paid ads, analytics, SEO, ecommerce, CRM, and social. If it doesn't, your team is still exporting data manually and rebuilding reports every month.
The right question isn't "How many integrations does this tool offer?", it's "Does it connect the sources we use most?"
Reporting Ninja's integrations are built around the platforms that marketing teams rely on most day-to-day.
A good reporting tool makes performance easier to understand, not just prettier to look at. Stakeholders should be able to see what changed, why it matters, and where attention is needed without having to interpret raw platform exports.
Reporting Ninja helps teams present data in a more digestible format, so reports feel less like raw exports and more like useful performance updates.
Automation is what makes reporting scalable. Without it, every reporting cycle involves the same manual work: exporting data, updating charts, and checking formulas. This works for a handful of campaigns—but not for agencies managing multiple clients across multiple channels.
Reporting Ninja lets you reuse templates, refresh data automatically, and schedule reports without rebuilding from scratch. That's how teams shift time from report assembly to actual analysis. It also supports email reporting and PPC reporting in a single workflow
{{cta-block-v1}}
Marketing measurement works best when it gives your team and stakeholders a clear answer: what happened, why it happened, and what should happen next.
That starts with the right KPIs, but it also depends on the reporting process behind them. If your team is still collecting data manually, rebuilding reports, or switching between platforms to explain performance, measurement becomes slower than it needs to be.
Reporting Ninja helps simplify that workflow. You can connect your marketing data insights, build clearer client-ready reports, and automate recurring reporting, so your team can spend more time improving performance and less time preparing updates.
Start your free 15-day trial today. See the difference it makes.
Marketing measurement is the process of tracking campaign performance against specific goals (such as leads, revenue, or customer acquisition cost) to determine what's working.
Marketing analytics identifies patterns and trends in your data. Marketing measurements track whether campaigns are hitting defined goals and KPIs.
Use a cross-channel reporting framework that tracks contribution by channel (traffic, leads, and revenue) rather than judging each platform in isolation. Reporting Ninja can help consolidate that data into a single view.
Sign up for a 15 days free trial. No credit card required.

Build and automate amazing custom reports in a few clicks. Save time, be more productive, impress your clients.