Analytics
March 27, 2026
How to create a metrics dashboard and KPIs to track for your clients


Building a metrics dashboard can feel overwhelming. What to track, where to start, and then, how to make sense of it all.
The truth? You only need a clear structure and the right tool.
This guide walks you through creating a practical dashboard that highlights KPIs driving real growth across marketing, sales, and business performance.
A metrics dashboard is a visual display of your most important business data in one place. It consolidates performance indicators (like sales growth, marketing ROI, and customer engagement) into easy-to-read charts and tables. The goal is simple: to help you monitor progress, spot trends quickly, and make smarter decisions based on real-time insights.
Not all dashboards serve the same purpose. The right type depends on who’s using it and what decisions they need to make. Here are the main categories:
Each dashboard type offers a different lens on performance, but together they form the foundation of a complete reporting strategy.

The right KPIs and metrics depend on your goals, but every effective dashboard focuses on a balanced mix of marketing, sales, and business performance indicators. Here are the essentials:
Tracking these metrics gives teams a unified view of performance, helping them understand which activities drive results and where to make improvements.
A metrics dashboard is more than a visual tool; it’s how teams stay informed, aligned, and proactive. By turning raw numbers into meaningful insights, dashboards help businesses move faster and make smarter decisions, much like a well-structured data analysis report. Here’s what they bring to the table:
Dashboards pull data as it happens, so you can see trends before they become problems. Whether it’s a sudden traffic drop or a spike in conversions, you can react immediately instead of waiting for static reports.
A centralized dashboard turns numbers into clarity. You can track KPIs across marketing, sales, and operations to see what’s driving growth—and what’s slowing it down—without digging through separate analytics tools. This approach is especially helpful when analyzing campaigns using content marketing metrics and broader content marketing analytics.
Dashboards simplify how teams share progress. Visual charts and summaries make it easier to explain results to clients or executives, reducing back-and-forth reporting and aligning everyone around clear metrics.
Instead of switching between platforms, a dashboard connects your data sources into one view. This single source of truth keeps every team working from the same information, making it easier to track operational metrics.
Automating updates and reports means less time pulling numbers and more time improving results. Dashboards handle the data collection and formatting, freeing teams to focus on strategy instead of maintenance.
Together, these benefits transform reporting from a chore into a strategic advantage, especially when powered by a tool designed for both connection and insight.
Track performance live, automate reporting, and keep every team aligned around the metrics that move your business forward.
Start your free 15-day trial today.
Dashboards vary by audience and objective. The right setup depends on the data you track and the decisions you need to make. Below are four examples showing how different teams use metrics dashboards to stay focused and improve performance:
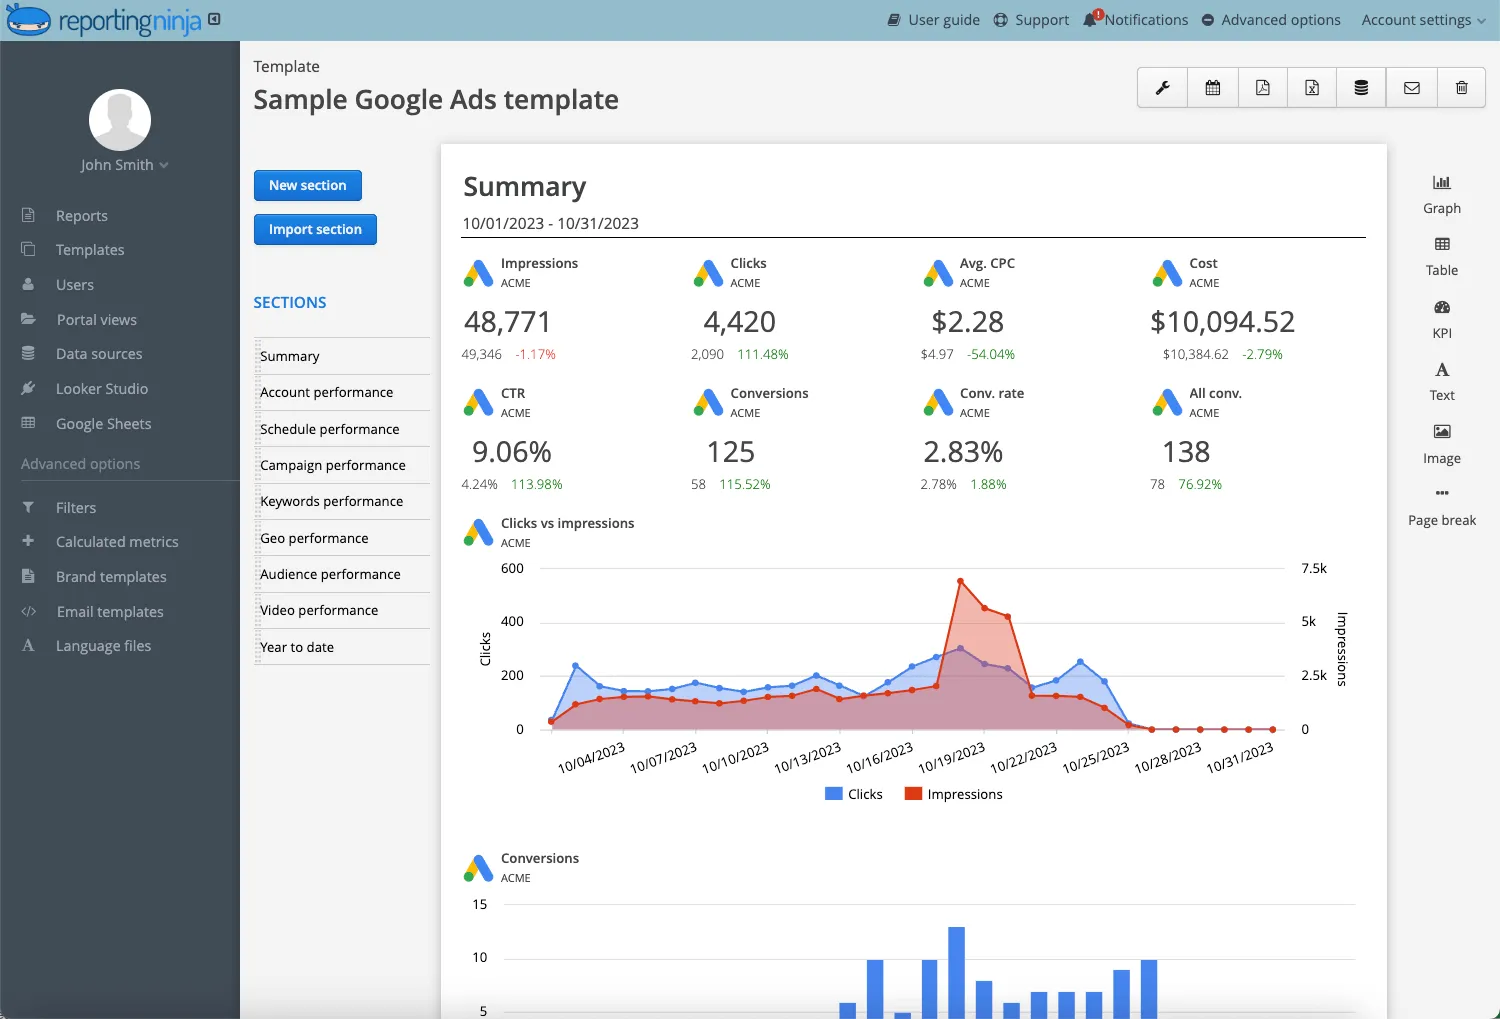
This dashboard brings together data from Google Ads, Meta, LinkedIn, and Google Analytics to measure campaign ROI, lead quality, and cost per acquisition. Marketers use it to see which channels drive the best results, spot underperforming campaigns early, and adjust budgets based on live conversion data.
Pulling from CRM data, this view tracks pipeline value, deal velocity, and win rates by rep or territory. It helps sales leaders forecast revenue more accurately, manage performance, and identify where leads slow down in the funnel—giving them a clear picture of what’s driving growth.
A company-wide summary combining KPIs from finance, sales, and marketing systems. Executives use it to monitor revenue growth, churn, profitability, and goal progress in one place. It helps leadership teams align strategy and resources, replacing fragmented weekly reports with one real-time snapshot. It relies on marketing data integration to bring all insights together.
Integrates support, CRM, and usage data to track churn risk, NPS, and product adoption trends. Customer success managers rely on it to flag at-risk accounts, identify expansion opportunities, and measure the impact of retention initiatives.
Together, these dashboards show that effective performance tracking isn’t about volume; it’s about clarity. Each dashboard focuses on the few metrics that matter most, giving teams the visibility they need to act with confidence.
Setting up a dashboard in Reporting Ninja takes just a few minutes. The platform connects directly to your data sources, letting you track and visualize KPIs instantly. Follow these simple steps:
Start by linking your marketing, sales, and analytics accounts (such as Google Ads, Meta, LinkedIn, HubSpot, or Google Analytics). Reporting Ninja supports over 150 native connectors, so you can centralize all performance data in one workspace.
Decide where you want to view and share your dashboards. You can use Reporting Ninja’s built-in dashboard platform, send data to Looker Studio for advanced visualization, or connect to Google Sheets for spreadsheet-based reporting.
Pick a pre-built template for marketing, sales, or executive reporting, or create a custom layout. Templates come with ready-made widgets and KPIs you can adjust for your goals.
Drag and drop widgets like charts, scorecards, and tables to display your key metrics. You can adjust colors, dimensions, and labels to match your brand or reporting needs.
Use filters to drill down into campaigns, date ranges, or regions. This lets you isolate specific data trends and compare performance across time periods.
Set up automated refresh schedules and report deliveries. Reporting Ninja can send dashboards via email, PDF, or live client access, keeping everyone aligned without manual exports.
Once your dashboard is live, track how it performs. Adjust metrics, rearrange widgets, or integrate additional data sources as your reporting needs evolve.
Reporting Ninja lets you connect data, choose your layout, and publish live dashboards—all in one platform. Whether you’re tracking campaign ROI or executive KPIs, you can automate every update and deliver reports that clients and teams actually understand.
{{cta-block-v1}}
An effective dashboard helps people act on data rather than just view it. The right structure and habits turn raw numbers into consistent, usable insight.
Start with the KPIs that directly reflect success for your department or campaign. A marketing team might center on ROI and conversion rate, while a sales team focuses on deal velocity and win rate. Limiting scope keeps the dashboard clear and goal-driven.
Layout matters. Use consistent colors, fonts, and spacing to make data easy to scan. Group related metrics together and prioritize visual hierarchy so important numbers stand out without distraction.
Dashboards work best when data stays current. Set automatic refreshes and delivery schedules to eliminate manual updates. This ensures decisions are always based on accurate, real-time information. For example, a social media reporting tool can help marketing teams automatically track campaign performance across channels without manual input.
Numbers alone can be misleading. Use annotations, benchmarks, or trend lines to give your metrics meaning. The goal is to show progress and performance, not overwhelm viewers with noise.
Dashboards should evolve alongside your strategy. Revisit KPIs each quarter, retire those that no longer reflect priorities, and add new ones as goals shift. This keeps your reporting relevant and aligned with business direction.
A dashboard is never “finished.” The best ones are refined regularly to stay focused, accurate, and useful to everyone who relies on them.
Dashboards and reports often get confused, but they serve different purposes. Dashboards provide a live, interactive view of ongoing performance, while reports deliver static summaries over a set period. Both are essential for tracking progress and communicating results.
Dashboards keep you informed in the moment, while reports capture what’s been achieved. Together, they create a complete view of performance and progress.
Turn disconnected data into fast, confident decisions. Reporting Ninja brings your marketing, sales, and analytics metrics together so you can track performance instantly, automate reports, and move faster on what drives growth. Build your first dashboard today and see how much easier reporting can be when everything works in one place.
Sign up for a 15 days free trial. No credit card required.

Build and automate amazing custom reports in a few clicks. Save time, be more productive, impress your clients.