Email
July 18, 2022
10 email marketing KPIs you need to measure


With businesses now embedding trackers in over 70% of emails sent to their mailing subscribers, getting email marketing data is no longer the biggest concern for marketers. Instead, it’s knowing what to do with that data that’s the issue.
Instead of randomly piling up data from the 333 billion emails sent daily, you just need to prioritize and act on the most impactful email marketing metrics.
Put simply, you ought to know:
To help you with that, this article walks you through the entire journey of measuring your email marketing campaigns.
Discover the 10 email marketing KPIs that you should prioritize, what they mean to your business, plus the reporting tools that you could leverage for easy monitoring of the key email marketing metrics.
To make the best out of your email marketing, measuring shouldn't be a post-campaign consideration. Rather, you need to get the email marketing metrics right long before the campaign kicks off.
The process itself should begin with an outline of your campaign goals. This is where you clarify what exactly you’re seeking to achieve through the email marketing campaign.
Do you intend to generate leads for your online store? Or maybe you’re planning to engage the existing leads in the hope of converting them? Perhaps thinking of re-engaging old customers with offers that’ll get them buying again?
Whatever you have in mind, you should break it all down into clear measurable objectives. At least with such a roadmap, you’ll be able to figure out what to measure while evaluating campaign progress.
The final step is where you integrate appropriate analytics tools, capable of tracking all the email marketing metrics that are relevant to your campaign goals.
While each of the email marketing metrics is meant to track campaign progress, the resultant insights do not always double up as performance indicators. If you want to accurately track the performance of your campaigns, then you have to separate email marketing KPIs from all the other types of metrics.
“KPIs” here stands for Key Performance Indicators. That, in simple terms, means that email marketing KPIs are the few most essential metrics you can count on to track campaign performance against your goals.
Whereas other email marketing metrics tell you about the “state” of the campaign, KPIs provide visibility into the parameters that define the outcome of the entire campaign. These are the email campaign metrics used to establish if the campaign was successful or not.
Gone are the days when digital marketers would proceed with just three to five email marketing KPIs. They now have exceedingly sophisticated analytics and email reporting software at their disposal, which give them the privilege of tracking performance at a much deeper level.
As such, you should be able to set up multiple email marketing KPIs on the same campaign – all custom-tailored to your specific goals.
Here are ten universal email marketing KPIs to get you started. These can be strategically applied to any email marketing campaign, regardless of your objectives and performance targets.
Open rate is a measurement for tracking the number of emails opened on the receiving end.
It’s usually expressed as a percentage, derived from the ratio of the number of opened messages to the total volume delivered to all the recipients’ mailboxes.

For instance – imagine sending out 5,000 messages in your email marketing campaign, If just 4,000 are delivered, from which only 800 recipients proceed to open, you’d end up with an open rate of 20%.
That, in fact, would be a decent open rate for any industry — as all business categories are currently averaging 21.33%.
All in all, though, you should be fine with anything between 17 and 28%. Beauty and personal care emails attract the lowest open rates, while the opposite end of the spectrum is taken up by government emails.
Your performance here is, nevertheless, a good indicator of how engaging recipients find your email subjects. Hence, you might want to run A/B tests on different types of headlines, all the while comparing their open rates to discover what resonates best with your audience.
While you’re at it, however, keep in mind that open rate email marketing metrics can be misleading at times.
You’ll notice, for instance, that trackers only work when emails proceed to load their images. This makes it difficult to collect data from recipients who’ve otherwise disabled images.
Another problem is, some email re-opens might be erroneously logged as open instances. That means a message that was read multiple times by the same person could end up being reported as separate occurrences from different recipients. This is where being able to track unique opens rather than opens, might be a more important metric to track.
CTR, or Click-Through Rate in full, provides insights into the number of recipients who not only opened their emails, but also proceeded to click on links embedded within the message.
And just like the open rate metrics, CTR is expressed as a percentage of the delivered emails. The CTR formula for email marketing is basically the ratio of the total count of email clicks to the total volume of emails delivered.

Consider, for instance, a campaign that manages to deliver 20,000 emails. If its recipients registered 1,000 clicks on the embedded CTA, the final click-through rate would be 5%.
But, make no mistake about it. CTR isn’t just about clicks. Rather, the principal objective here is to leverage CTR as an email marketing KPI for measuring content engagement.
The logic behind that is, people only click on campaign links (or CTAs) when they stumble upon information that interests them. Once the subject line grabs their attention and then compels them to open the email, it’s the content that subsequently gives them a reason to take the action of clicking on the accompanying links.
As such, you could consider using CTR as the core email marketing metric on all content-related A/B tests. You could track different Call-to-Actions (CTAs) or change the color of the button. This would ultimately reveal the type of information your recipients deeply care about.
More specifically, you might want to look out for messages with a CTR of between 2 and 5% – as all industries currently average at 2.29%.
CTR is a great email marketing KPI for tracking link clicks. What it won’t tell you, however, are the actions that follow.
For that, you need to turn to a different set of email marketing metrics. Conversion rate happens to be just the perfect KPI, as it discloses the share of email recipients who proceeded to complete the campaign’s target action.
“Target action”, in this case, refers to what you ultimately hope to achieve from your audience. You can think of it as the core purpose of the whole email marketing campaign. So, by tracking the conversion rate, you get to measure the extent to which the goals are being accomplished.
The action itself can be anything – making a purchase, downloading an ebook, filling out a form, redeeming a coupon, etc. It all depends on your specific business objectives and campaign objectives.
Whatever you settle for, ensure that the tool measuring your email marketing metrics manages to capture the desired actions as they happen. The resultant conversion rate should then be expressed as a percentage of the total count of emails delivered.

For conclusive analysis of your email conversion rates, the tracking should follow your audience from the moment they click on the CTAs, through the subsequent customer journey, up to the moment they fully commit and convert.
This whole process might take much longer than other email marketing KPIs — but, by the time you’re done, the conversion rate will have helped you establish the campaign’s ROI.
Unlike open rate, CTR, and conversion rate metrics, Click To Open Rate (CTOR) happens to be a compound email marketing KPI, derived from two distinctive email marketing metrics.
Put simply, the click to open rate shows the ratio of email openers who proceeded to click on the links embedded within the message body. You just need to express your click-through rate as a percentage of the open rate, and you’ll get a good idea of how your email content correlates with the subject.

Imagine, for example, an email marketing campaign that delivers 100 emails, 20 of which are opened, while only 10 end up clicking on the embedded CTA link.
In that case…
Such a CTOR could thus be interpreted to mean that the email content is 50% in sync with the email subject.
For better results, you can go ahead and A/B test different layout, color, content, and design combinations until you find a mix of options that are perfectly aligned with each other
That way, many of the people who get pulled in by the email subject are bound to find the message body equally as engaging — which should then lead to more clicks and conversions.
As an email marketing metric, bounce rate provides insights into the number of emails that failed to reach the mailboxes of the targeted recipients. So, in a way, you could say that bounce rate is the direct opposite of email delivery rate.
That said, the figures here are worked out by dividing the volume of bounced emails by the total number of emails sent.
This is different from bounce rate on a website.

For actionable insights, you might want to separate the undelivered emails by bounce type and then track them as parallel email marketing KPIs.
The two types are...
Unsubscribe rate is an indicator of the number of individuals who chose to opt out of your mailing list after receiving an email.
The email marketing metrics here are worked out by comparing the count of people who’ve unsubscribed to the number of emails delivered.

Consider, for instance, an email marketer who manages to deliver 10,000 emails but then ends up losing 50 recipients to unsubscriptions. The unsubscribe rate, in that case, would be 0.5%.
That’s a fairly reasonable unsubscribe rate, and the allowance extends all the way to 1%. Anything above that should be considered a high churn rate, while an unsubscribe rate of below 0.5% would place you in the league of good performers.
This is irrespective of how your corresponding subscription rate looks. Although the two email marketing metrics are direct opposites of each other, it would be unwise to approach them as interdependent KPIs.
For instance, raising the subscription rate doesn’t really make up for a poor unsubscribe rate. Rather, you should use the unsubscribe rate to figure out all the pain points that might possibly be compromising your audience retention rate.
Another email marketing KPI that comes in handy when you need to clean up your emails is spam complaints.
And just as the name suggests, spam complaints offer insights into the number of recipients who’ve flagged your email as spam. The email marketing metrics here come in the form of a percentage rate that represents the ratio of all the complaints to the total count of emails delivered.

Spam complaints are fairly reliable indicators of what you might be doing wrong in your email marketing campaigns. But, not exactly in the same manner as the corresponding email unsubscribe rates.
While unsubscriptions are often attributable to recipients feeling that they are no longer getting any value from your campaign emails, spam complaints can be taken as strong disapproval of your emails. They suggest that your campaign is completely way off the mark, and potentially distressing to recipients.
Perhaps you’re sending out way too many messages, contacting the wrong email addresses, putting out stale content, or maybe your emails lack an unsubscribe link.
Whatever the case, you might want to resolve it urgently, as spam complaints are usually picked up by ISPs. They could, with time, damage your reputation to the point of even compromising email deliverability.
Now that social sharing buttons are boosting the CTR from email campaigns by 158%, businesses are increasingly finding ways to creatively integrate the two engagement channels.
If you’re thinking of joining the bandwagon, you might want to consider tracking even social shares – in addition to CTR and other email marketing KPIs.
The role of the social share metrics is to provide analytics on the volume of recipients sharing your email content on social media. This is achieved by measuring the number of clicks on the embedded social sharing buttons, and then juxtaposing the findings against the number of delivered emails to show the trends in the context of the email campaign.

Consider, for example, the case of an email marketing campaign with, say, 1,000 emails delivered. If 80 of its recipients end up sharing the content with their peers on social media, the final social shares rate would be 8%.
The point of these email marketing metrics is not really just to monitor social media fame. Rather, they are much more impactful when leveraged as content quality indicators.
This comes from the fact that recipients would only be willing to show off content they consider to be unique, trendy, authoritative, and highly relevant. By keeping tabs on the figures, therefore, you get to confirm how the quality ratings from your audience shift with different messaging approaches.
Social shares are great for spreading out the word – but, unfortunately, they are not that dependable when it comes to rallying referrals. Email content shared via social media tends to be more effective in spreading brand awareness and generating organic buzz.
If you’re seeking to attract referrals from your email marketing campaigns, you’re much better off with email forwards. Email messages have shown to be 40% better in converting than social media sites like Twitter and Facebook.
You’d even generate more if you calculatedly applied the right email marketing metrics across the entire email forwarding campaign.
This is where, for instance, you actively track the volume of all the forwards initiated by your email recipients.
The KPI itself happens to operate in a similar manner as social share metrics – it shows the forward numbers as a percentage of the total emails delivered.
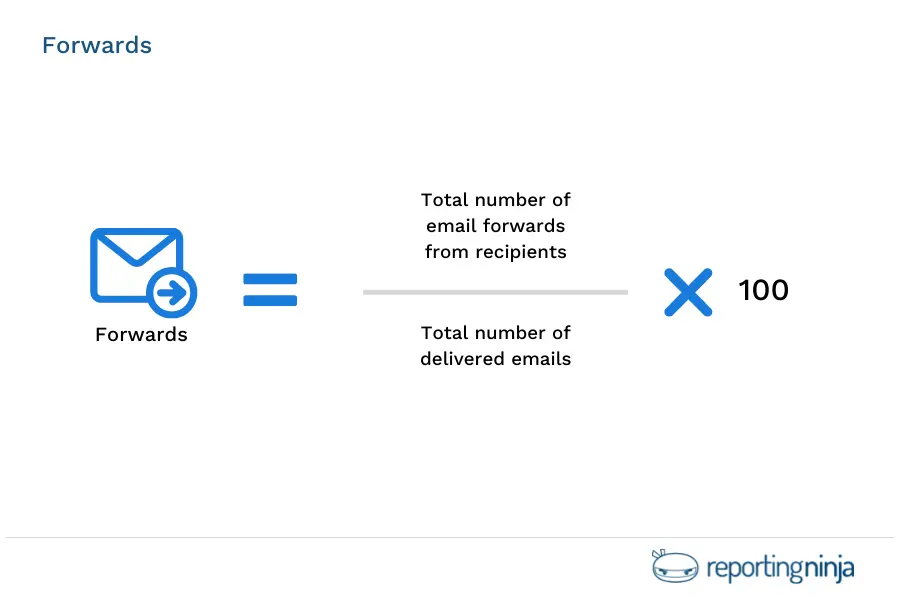
With these metrics, you’ll get a good idea of what your audience prefers to forward – and the insights will additionally help you in optimizing the design and content to make it all even more shareable.
Then as new contacts start to come in from the recommendations, you can run their numbers against the forward metrics to predict your lead generation potential while the email campaign progresses.
Speaking of contact generation, the ultimate email marketing KPI for measuring your overall progress on that front is the email list growth rate.
Instead of relying on just the bare volume of contacts, you get to use the email list growth rate to accurately track the relative progress of your mailing lists.
The figures here represent the gains in subscribers, refined and illustrated as a percentage of the volume of the current mailing list.

Imagine, for example, a business with 1,000 contacts gaining 20 more while, in the meantime, losing 10 to unsubscriptions.
In that case…
And there goes ten of the biggest email marketing KPIs.
Just to recap what each of these email marketing metrics entails, here’s a full breakdown of their respective formulae:
Keep in mind, though, that all these are useless if you fail to implement them using the right tools and strategies.
Many marketers would, understandably, choose to have several analytics platforms running interdependently across their multiple email marketing channels. And then, of course, there’s the group of beginners who want to try out different email marketing tools, hoping that they’ll eventually find a platform that can exhaustively cater to all their data tracking needs.
Whatever your circumstances, it’s obvious that everyone is struggling with the same problem – we all need a well-centralized system for tracking all these email marketing KPIs. A platform that is versatile enough to cover all the critical campaign metrics, but simple and intuitive enough to keep everything neat and easily accessible.
Well, we’re not the ones to blow our own trumpet, but that’s precisely what you get from Reporting Ninja. While this is not an email marketing platform, it’s capable of drawing all the relevant metrics and organizing them into simple visual reports.
You can easily integrate Reporting Ninja with MailChimp, HubSpot, Google Analytics, you name it.
And while you’re at it, you’ll have access to a host of fully customizable templates, on which you get to hand pick email marketing KPIs from each of your favorite data analytics platforms.
This is advanced campaign reporting, but in a neat and seamless package. No more frustrations with tons of irrelevant metrics and disjointed reporting.
Don’t take our word for it, though. It’s time you experienced it all for yourself. Just sign up for a 15-day free trial and become a reporting ninja for email marketing KPIs.
Sign up for a 15 days free trial. No credit card required.

Build and automate amazing custom reports in a few clicks. Save time, be more productive, impress your clients.