Social
April 15, 2026
2026 Key Instagram metrics & KPIs to track for marketing success


You’re putting in the effort—posting regularly, testing new formats, staying active. But without the right data, it’s hard to know what’s working.
If you're searching for the most useful Instagram metrics, you’ve come to the right place!
This guide focuses on the ones that actually reflect performance—no fluff, no filler.
You’ll learn how each metric ties back to growth, what to prioritize depending on your goals, and how to track everything without wasting hours digging through native analytics.
We’ll also show you the simplest way to pull these numbers into one clear, customizable report.
Let’s get started.

Before diving into numbers, it’s important to clarify what you’re actually tracking—and why.
Instagram metrics and KPIs (key performance indicators) are not the same thing. They work together, but serve different roles.
Here’s the difference:
Metrics give you granular insights—what your audience is doing, when they’re active, what they engage with. But metrics alone don’t define success.
KPIs take those numbers and ask, “Is this helping us hit our business goals?”
You need metrics to track performance. You need KPIs to make decisions. Used together, they turn raw data into strategy.
The main driver of why businesses need to track their analytics for Instagram is to ensure that their releases are aligned with their target audience, something a well-organized Instagram analytics report can clearly reveal. When this happens, you can expect an increase in brand awareness, website traffic and conversions such as email sign ups, contact forms or products purchased.
In simpler words, the better your Instagram metrics, the more benefits your company will receive. Here's a list of the advantages you'll have when you carry out a comprehensive marketing strategy on this platform and why they are important to measure:
If you keep track of your Instagram metrics, the investments for your online promotion and marketing strategies won't go to waste. That means you're effectively using your resources and funds.
For example, you may be paying a lot for digital tools and software that may not be as effective as you think. But if you know which techniques work best for your company, you can focus on those strategies instead.

Every company has Instagram KPI metrics that let them measure their performance and overall progress towards their corporate goals. If you want to become one of the leading shoe distributors online, you can check these metrics and see how they match that particular objective.
If these Instagram metrics and your objective don't match up, you can adjust your online promotion and marketing strategies. But if they do, you can continue releasing similar types of content.
Another advantage of measuring metrics is that it allows you to identify the type of audiences interacting with your content. You'll also get a feel of the kinds of releases they want to see on your Instagram profile.
For example, a company that has decided to release a video about its services can track its audience engagement rate by reach.
If it has a high reach, they can consider producing similar content. But if it doesn't, the company may want to explore different online promotion and marketing strategies.

Better online promotion and marketing techniques result in improved brand awareness. That simply means more people are aware of your products and services. And, of course, the more they know about your company, the more inclined they'll be to support your offers.
Potential customers who lurk in their Instagram accounts will find your company's products and services much easier and faster because of your effective releases. There'll also be a higher chance for them to visit your account and browse through what you can offer.

If you mix better brand awareness and increased website traffic, you'll get more revenue and profit. The primary reason behind this is that more people will avail of your products and services.
Different metrics serve different goals. To avoid getting buried in data, group your Instagram metrics by what they actually help you measure—audience growth, engagement quality, brand awareness, content output, or business impact.
These show how your follower base is evolving. Follower growth rate, audience demographics, and active hours reveal whether you’re reaching the right people—and when they’re most likely to engage. Use this data to refine your content targeting and posting schedule.
Engagement metrics reflect how people interact with your posts. High levels of likes, comments, shares, and saves signal content relevance. Look beyond vanity metrics—consistently strong engagement shows trust and brand connection, especially when paired with growth in saves and shares.
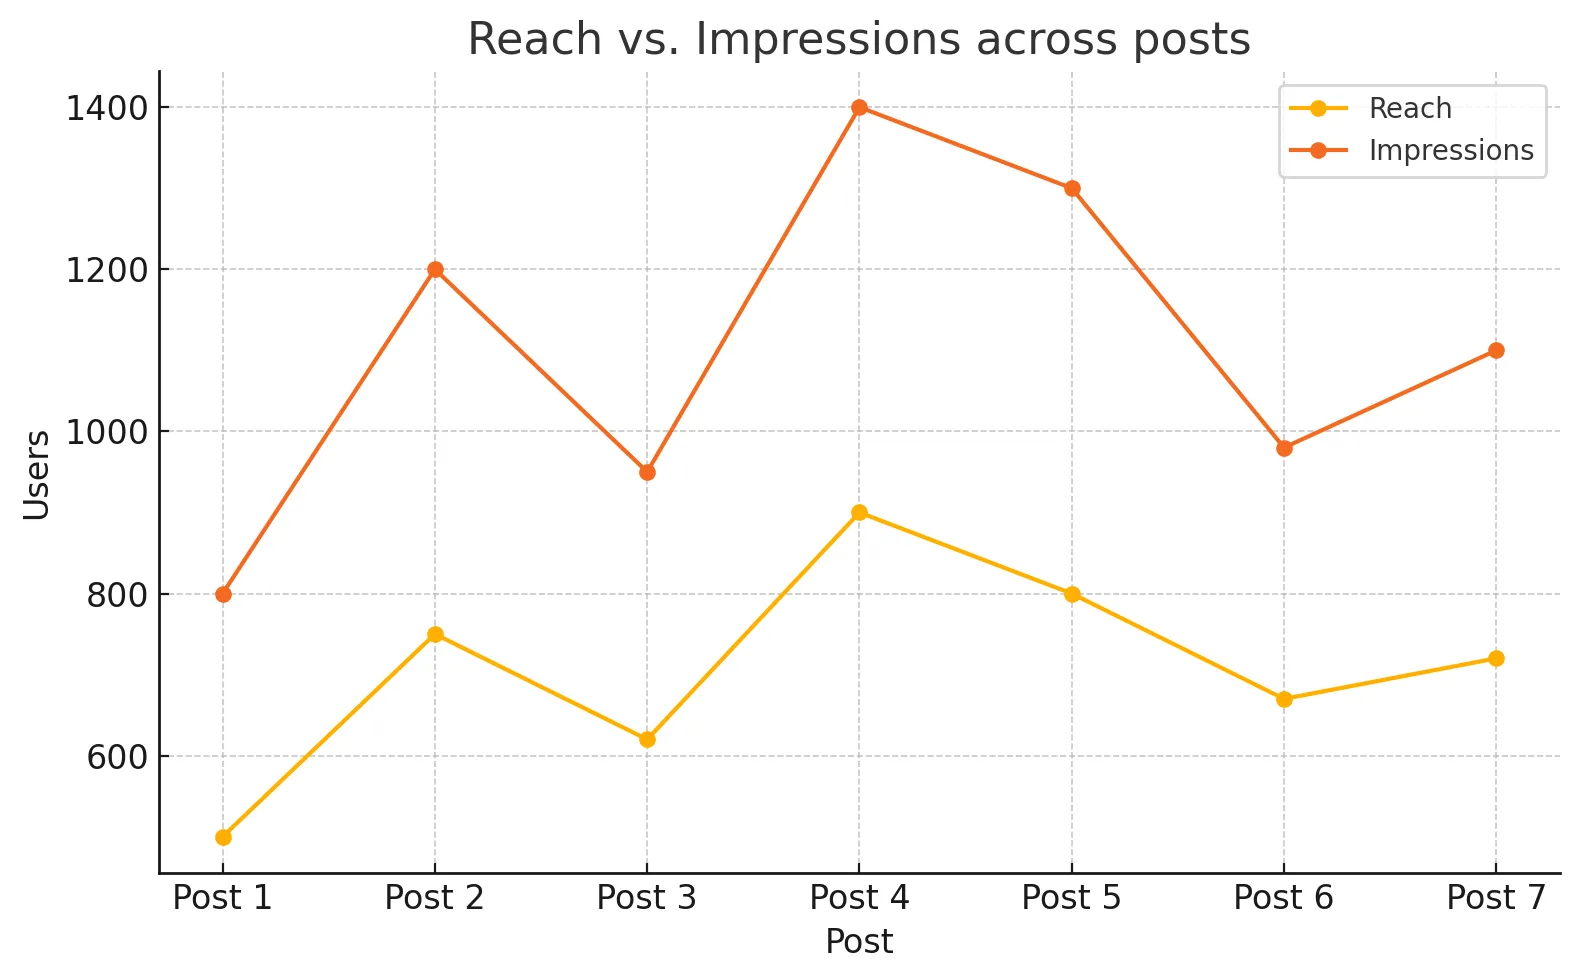
Reach and impressions measure your brand’s visibility. Reach = unique viewers. Impressions = total views. A post with high impressions but low reach may be shown repeatedly to the same users. Track both to understand how wide and how often your content is seen.
Not all content performs equally. Track top posts, story completion rates, and engagement by format (reels vs. static vs. carousel). Spot patterns to guide future content—whether it’s a format that outperforms or a topic that consistently resonates.
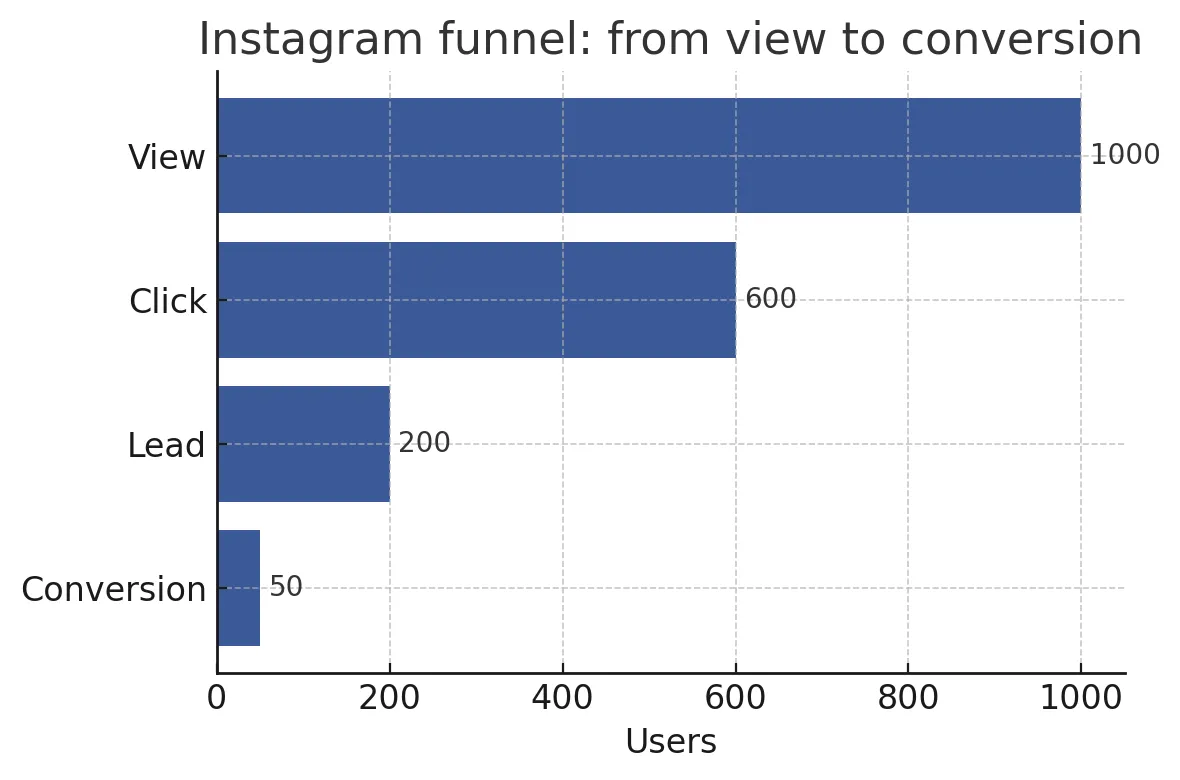
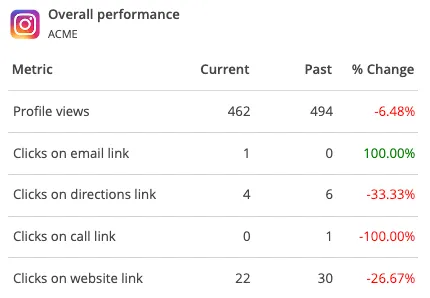
These show whether Instagram activity turns into business results. Track link clicks, profile visits, landing page traffic, and conversion events. Watching this funnel helps you spot where potential customers drop off—and where to double down.
Looking at metrics isn’t the same as measuring performance. If you want clarity on what’s working—and what’s not—you need a structured way to interpret the data. These techniques will help you cut through the noise and stay focused on outcomes.
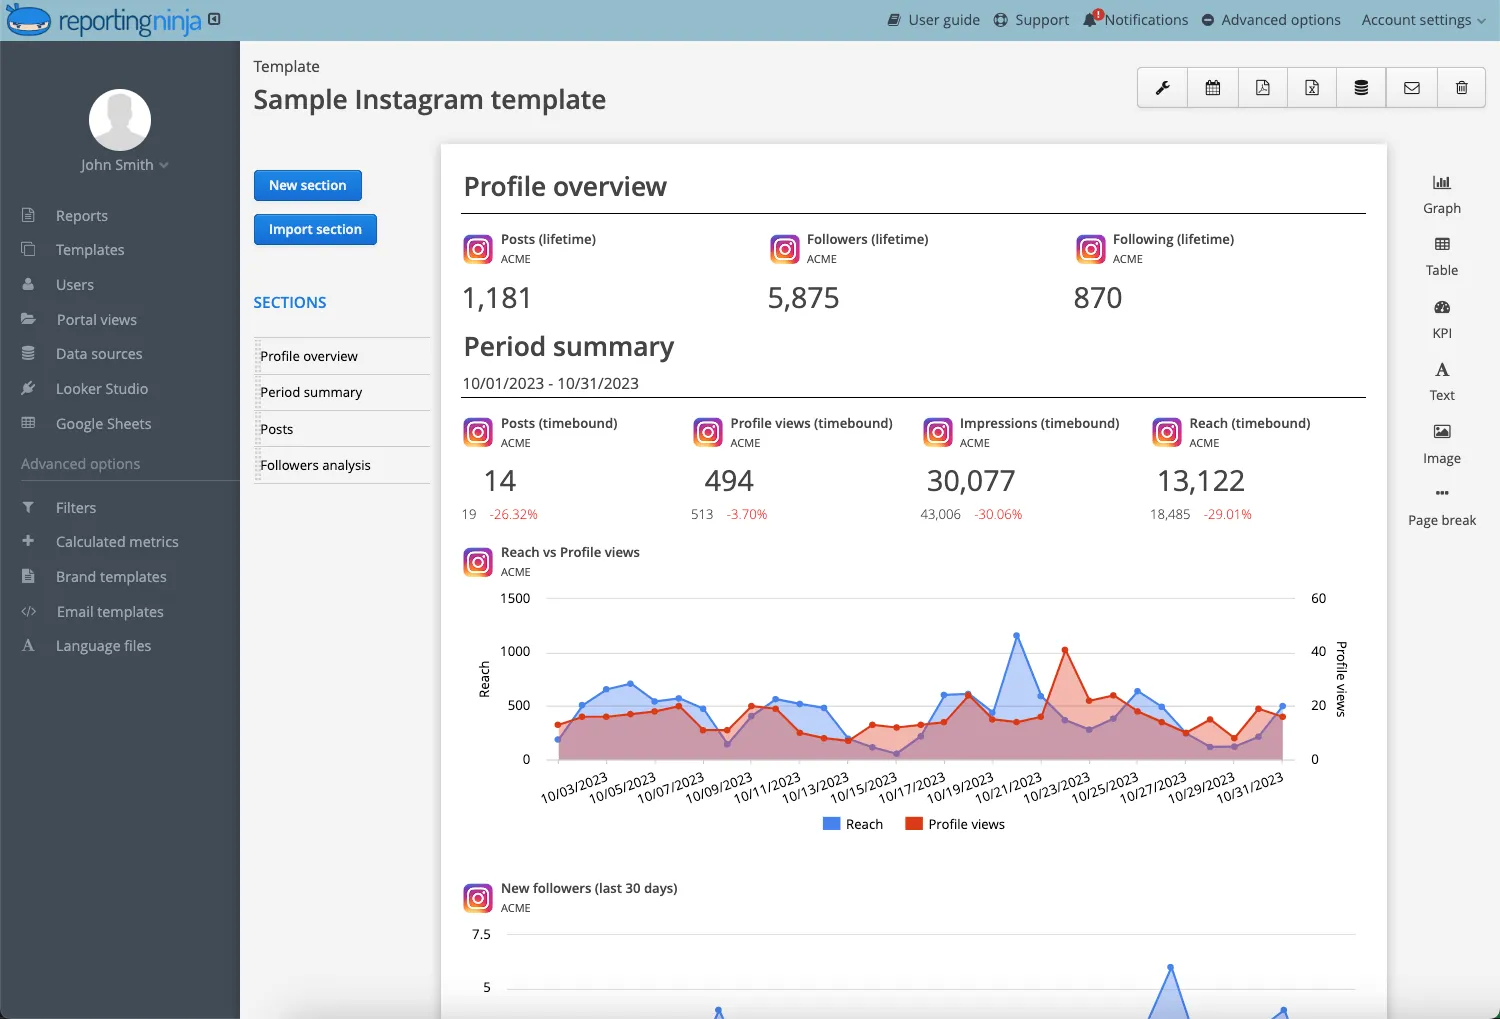
If you're managing multiple clients or campaigns, Reporting Ninja simplifies everything. You can pull in all your Instagram metrics—engagement, reach, follower growth, story views, link clicks—and map them to strategic KPIs.
Build drag-and-drop dashboards, schedule reports, and highlight trends over time. With customizable templates, you can segment performance by post type, time period, or audience segment—without jumping between tools.
Instagram Insights offers basic performance tracking across posts, stories, reels, and ads. You’ll see data on impressions, reach, profile visits, clicks, and demographics—but it’s limited by time windows and lacks historical comparisons.
It’s fine for surface-level checks, but harder to scale if you’re reporting across multiple accounts or need custom views.
Pick a few high-value KPIs aligned with your goals—like “increase engagement rate by 15% in 30 days” or “double link clicks per post.”
Then map the supporting metrics underneath (e.g. comments, saves, CTR). This gives structure to your tracking and ensures you’re measuring progress, not just observing activity.
Use UTM tags to track where your traffic actually comes from. Add them to Instagram bio links, story swipe-ups, or post CTAs. When someone clicks, the tagged data shows up in Google Analytics—so you can connect Instagram activity to leads, signups, or purchases. UTMs also help differentiate organic traffic from paid campaigns or influencer posts.
There are many benefits to tracking your Instagram metrics. But they all lead you closer to success. Here are the best metrics to look out for in the future:

One metric that you should monitor is your follower growth rate. Make sure not to confuse this with your Instagram profile's total number of followers because this metric is the growth of your followers over time.
A high and consistent growth rate indicates that you have an effective online promotion and marketing strategy. On the other hand, a low and inconsistent growth rate may mean that there's something wrong or missing with your current techniques.
Apart from your follower growth rate, you must also monitor your engagement metrics, including the number of likes, comments, and reposts you have on a post or story. In fact, this metric is probably one of the most used and insightful things to look out for.
Remember that high numbers of likes, comments, and reposts indicate a good campaign and brand awareness. It may also lead to better website traffic.
If you're measuring your total number of Instagram engagements, you may also consider checking your Instagram engagement per follower. This metric can give you an overview of the type of followers you have and their preferred types of releases.
To compute your Instagram post or Instagram story engagement per follower rate, you can use the following formula:
Your total number of engagements (likes, comments, reposts, etc.)
____________________________________________________________________________________ x 100%
Your total number of followers

As of April 2026, Meta has deprecated the Impressions metric. It's now replaced by Views across all Instagram content types.
Views count how many times a post or story appears on someone’s screen, including repeat views. So if one person sees your content three times, that’s three views. For non-video content (photos, carousels, etc.), this metric now plays the same role Impressions used to—but may appear higher due to the new calculation.
Focus on tracking which posts consistently generate higher Views to identify content your audience returns to. Pair this with Reach to understand how widely and how frequently your content is being seen.
Your overall reach indicates the number of unique users that have seen your post or story in a day. This particular metric can show you how well your brand awareness is and how you can further improve it.
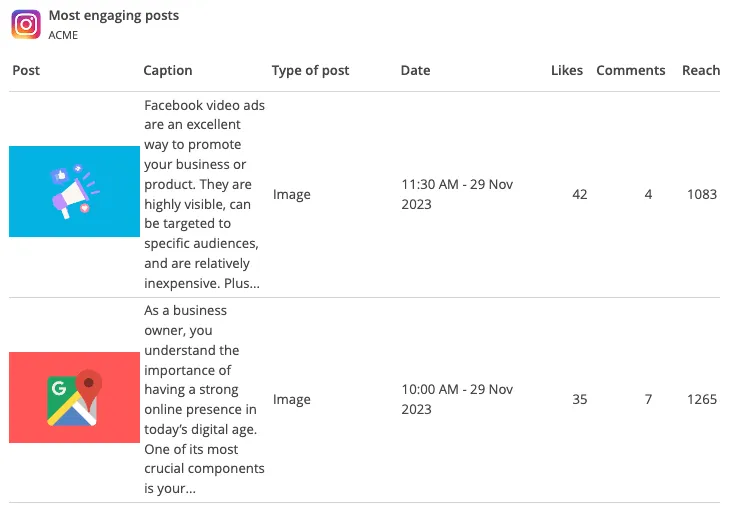
An effective way of maximizing your online promotion and marketing is to evaluate your top posts. Through Instagram metrics, you'll see which posts are performing well.
You can identify a possible pattern in the kinds of content your audience likes. And from there, you can further refine your techniques.
If you have eye-catching posts, there's a huge chance that your Instagram audience will click on your content and read through it. That's why another effective metric to check out is the total and the average number of link clicks you have per post.

To fully maximize your posts and stories, you must know when your target audience is active. Through this Instagram metric, you can determine the best times to release your content.
The more active your audience is, the more potential customers you'll have. That's because they'll have a higher chance of seeing your posts and stories.
Besides measuring the active hours of your audience, you can also evaluate their most active days on Instagram. Similarly, this metric will give you a feel of the best times to post your content.
If you see that your audience is most active on Saturdays, then posting a big promotional reel on that day can drive more engagement and reach to your post. Otherwise, posting it on a day when none of your audience is active will be a waste of time and effort.
The total number of comments on your post is a strong indicator of a good brand campaign and positive audience engagement. In addition, they show organic reach and activity from different Instagram users.
Depending on the nature of these comments per post, your potential customers may also be inclined to avail of your products or services. It's a good way for your audience to see what you have in store for them.
Not every stakeholder needs the full data dump. Aligning Instagram metrics with each role helps your team focus on what drives their decisions—whether it’s tactical tweaks, conversion performance, or big-picture ROI.
Social media managers need visibility into content performance at the post level.
Key metrics include likes, comments, saves, shares, and story completion rates. Segment by post format (reels vs. carousels vs. stories) and track engagement by time of day and day of week to optimize publishing cadence.
Trend analysis over 7-day and 30-day windows helps refine what content style and timing actually work.
Marketing managers care about how Instagram fits into the broader funnel.
Prioritize metrics that link content to conversions—link clicks, profile visits, UTM-tagged landing page traffic, and follower growth tied to campaigns.
Overlay this with cost-per-click (if running ads), and segment by campaign to identify which content types or promotions drive qualified traffic and leads.
For CMOs, the focus is strategic impact.
Track how Instagram contributes to lead generation, pipeline growth, and revenue. Useful metrics include attributed leads, conversion-assisted revenue, and changes in brand awareness (e.g. mentions, share of voice).
Monthly or quarterly KPI summaries should connect Instagram performance to broader marketing goals, highlighting contribution to ROI, not just engagement volume.
Tracking is only useful if it’s fast, clear, and actionable. That’s where Reporting Ninja comes in.
You can centralize your Instagram metrics—reach, engagement, clicks, conversions—into a single, customizable dashboard. Use our predefined Instagram templates to build polished, goal-oriented reports in minutes.
Whether you're using our own reporting platform or Looker Studio, we’ve got you covered:
No clutter, no guesswork—just clear performance insights your team can use.
Sign up for a 15 days free trial. No credit card required.

Build and automate amazing custom reports in a few clicks. Save time, be more productive, impress your clients.