Social
March 23, 2026

7 SEM report examples & templates for marketers & agencies

Kyle Rushton McGregor
Contributor
7 SEM report examples & templates for marketers & agencies

Key takeaways

  • Focus on business impact: Strong SEM reports highlight spend, conversions, CPA, ROAS, and trend direction so stakeholders quickly understand performance.
  • Use effective report templates: Combine an executive summary, campaign and keyword breakdowns, conversion insights, and clear recommendations.
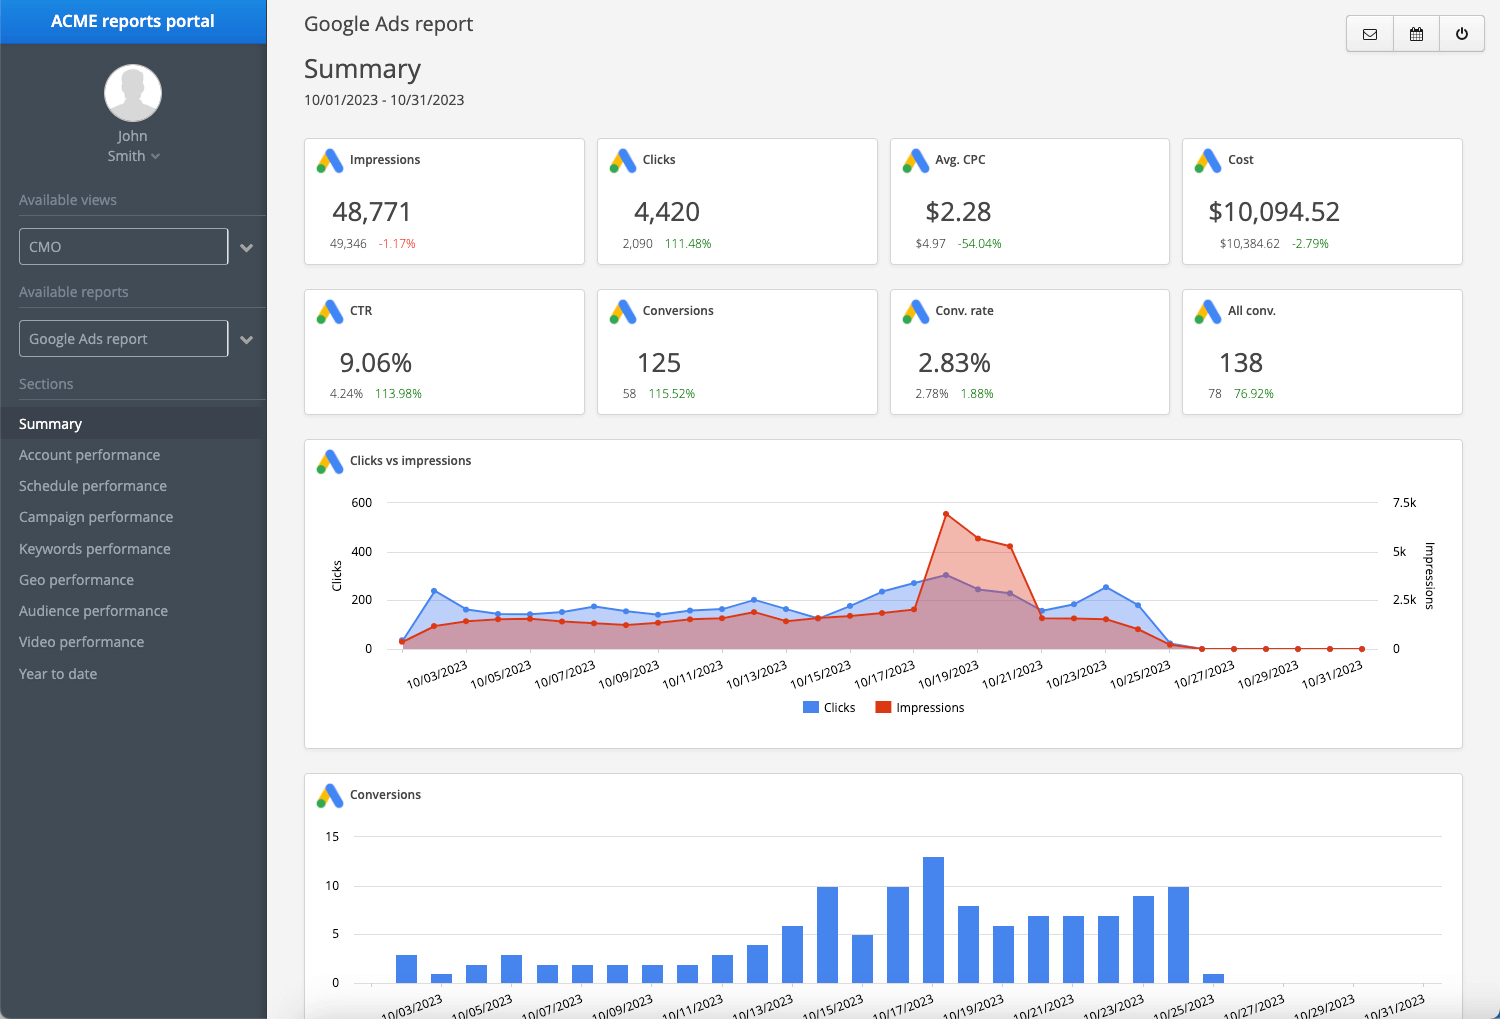
  • Tailor reports to the audience: High-level dashboards for executives and deeper analysis for marketing teams.
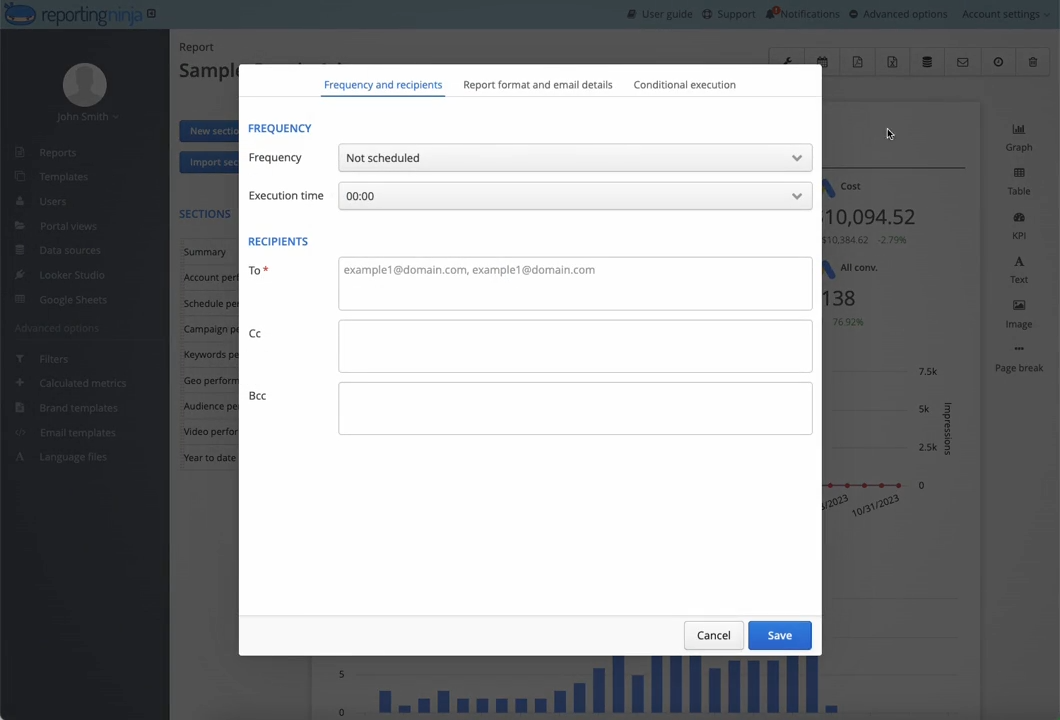
  • Leverage automation: Automated reporting tools help agencies standardize templates, reduce manual work, and deliver consistent client-ready reports.

Creating SEM reports that clients actually understand is harder than it should be!

Most reports show clicks, impressions, and spend — but fail to explain what changed, why it matters, or what to do next. 

The best SEM report examples fix this by focusing on performance, cost, and clear next steps.

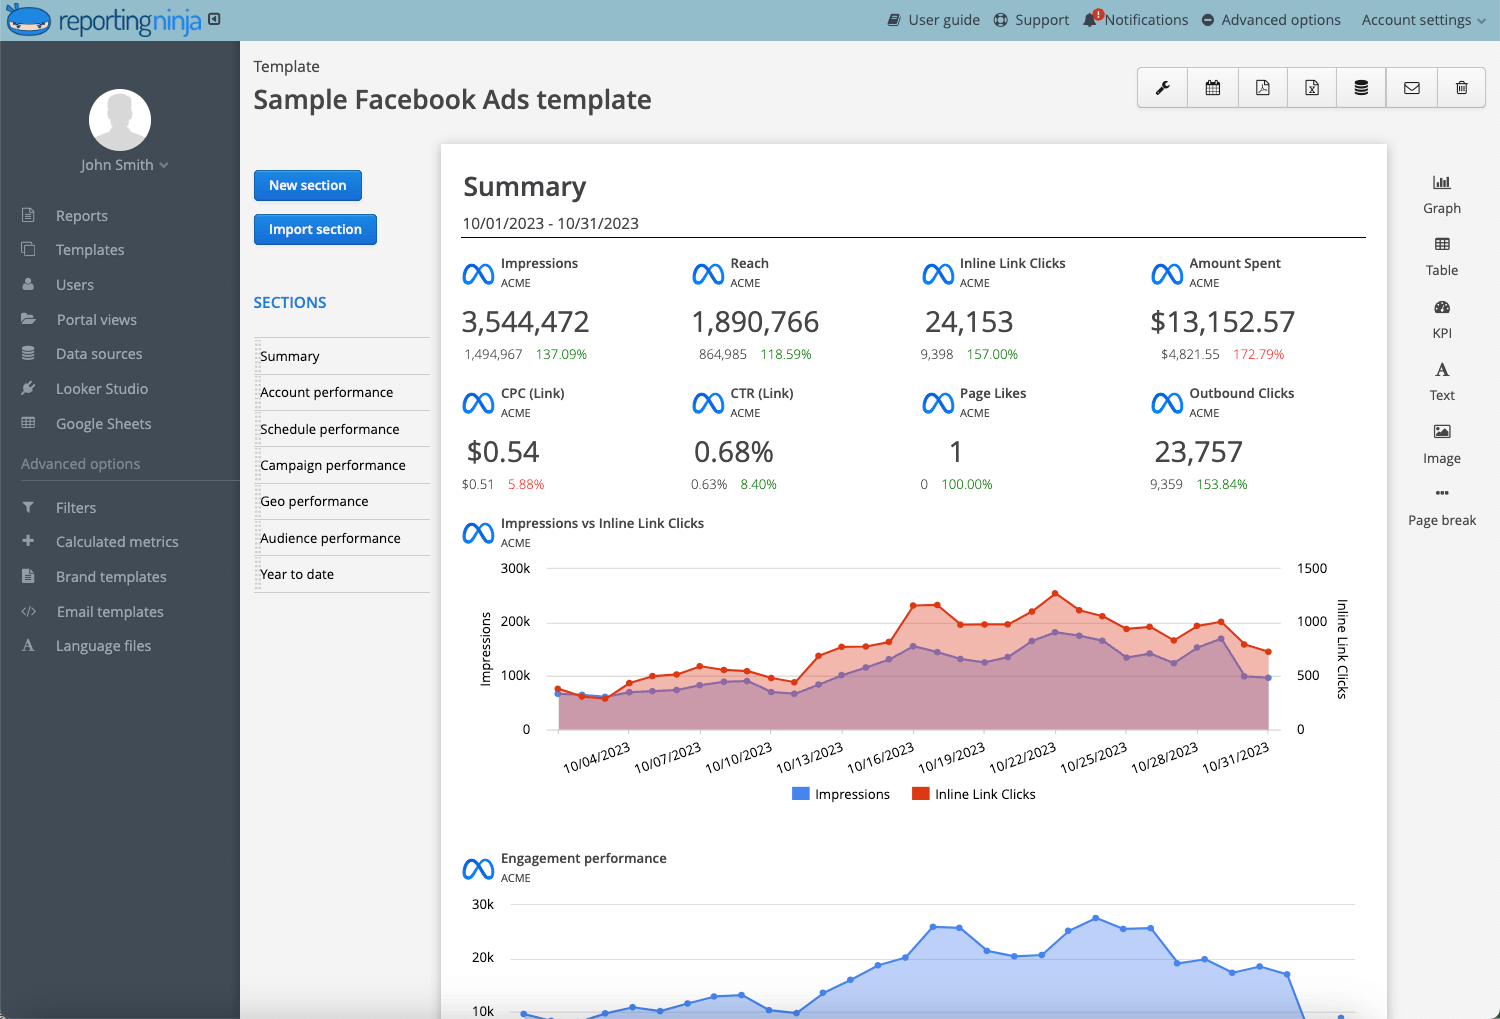
Below are seven practical SEM report examples and templates you can use to present results clearly, justify decisions, and guide what happens next.

What makes a strong SEM report?

A strong SEM report doesn’t just show numbers. It explains performance, context, and direction.

It should be structured, focused, and built for decisions, not just documentation.

An effective SEM report includes:

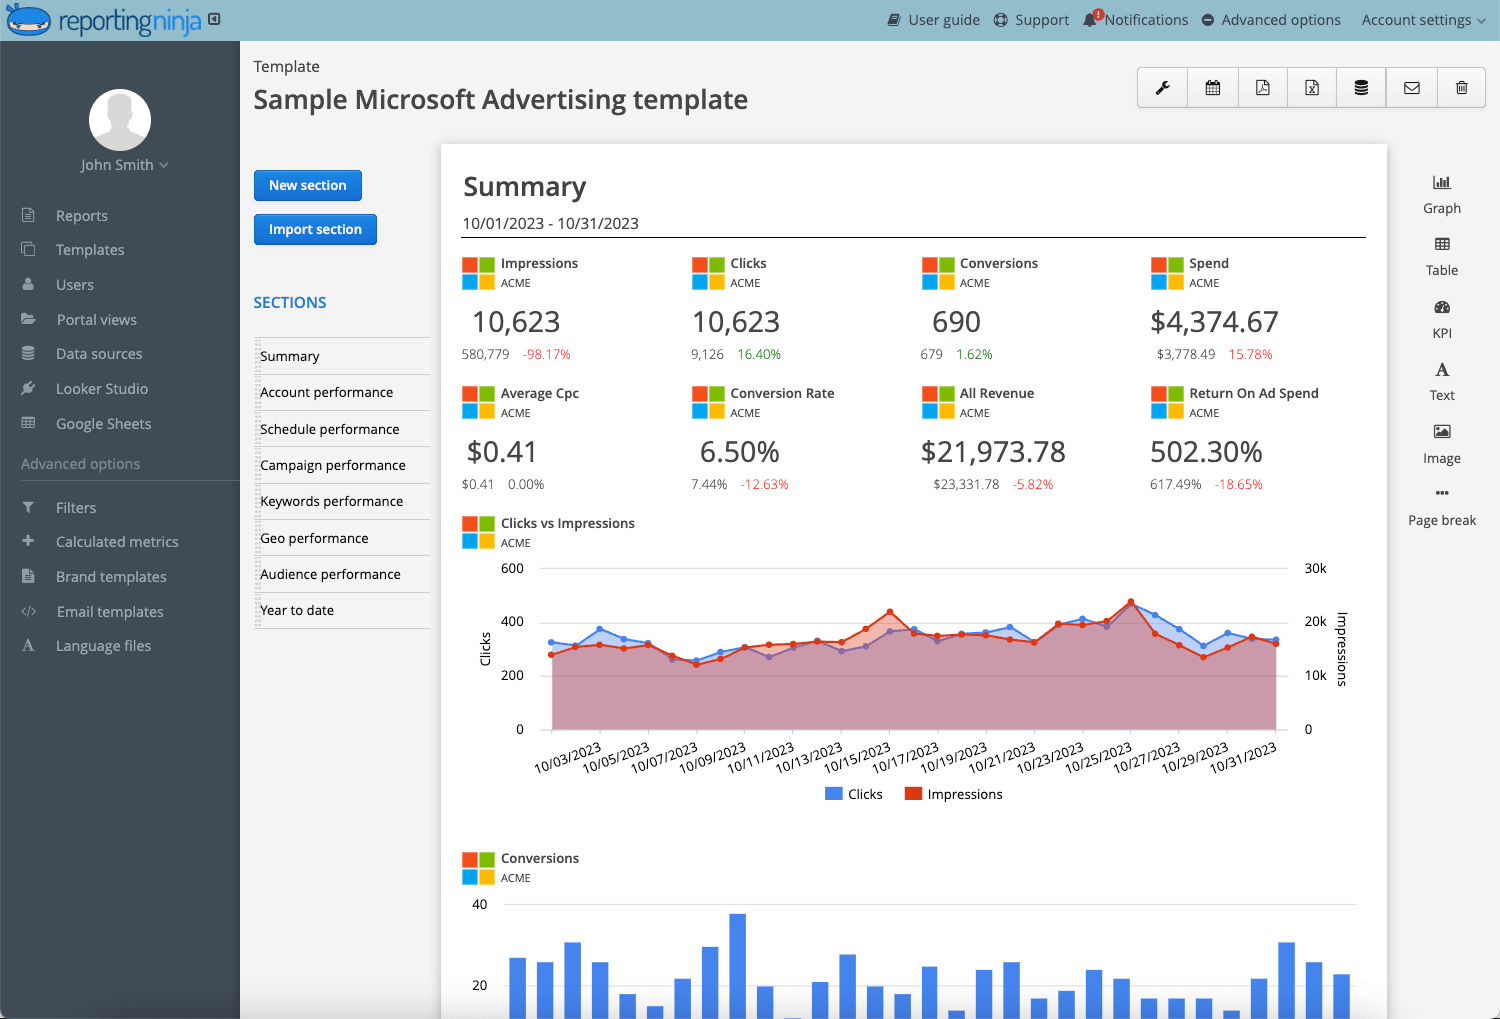
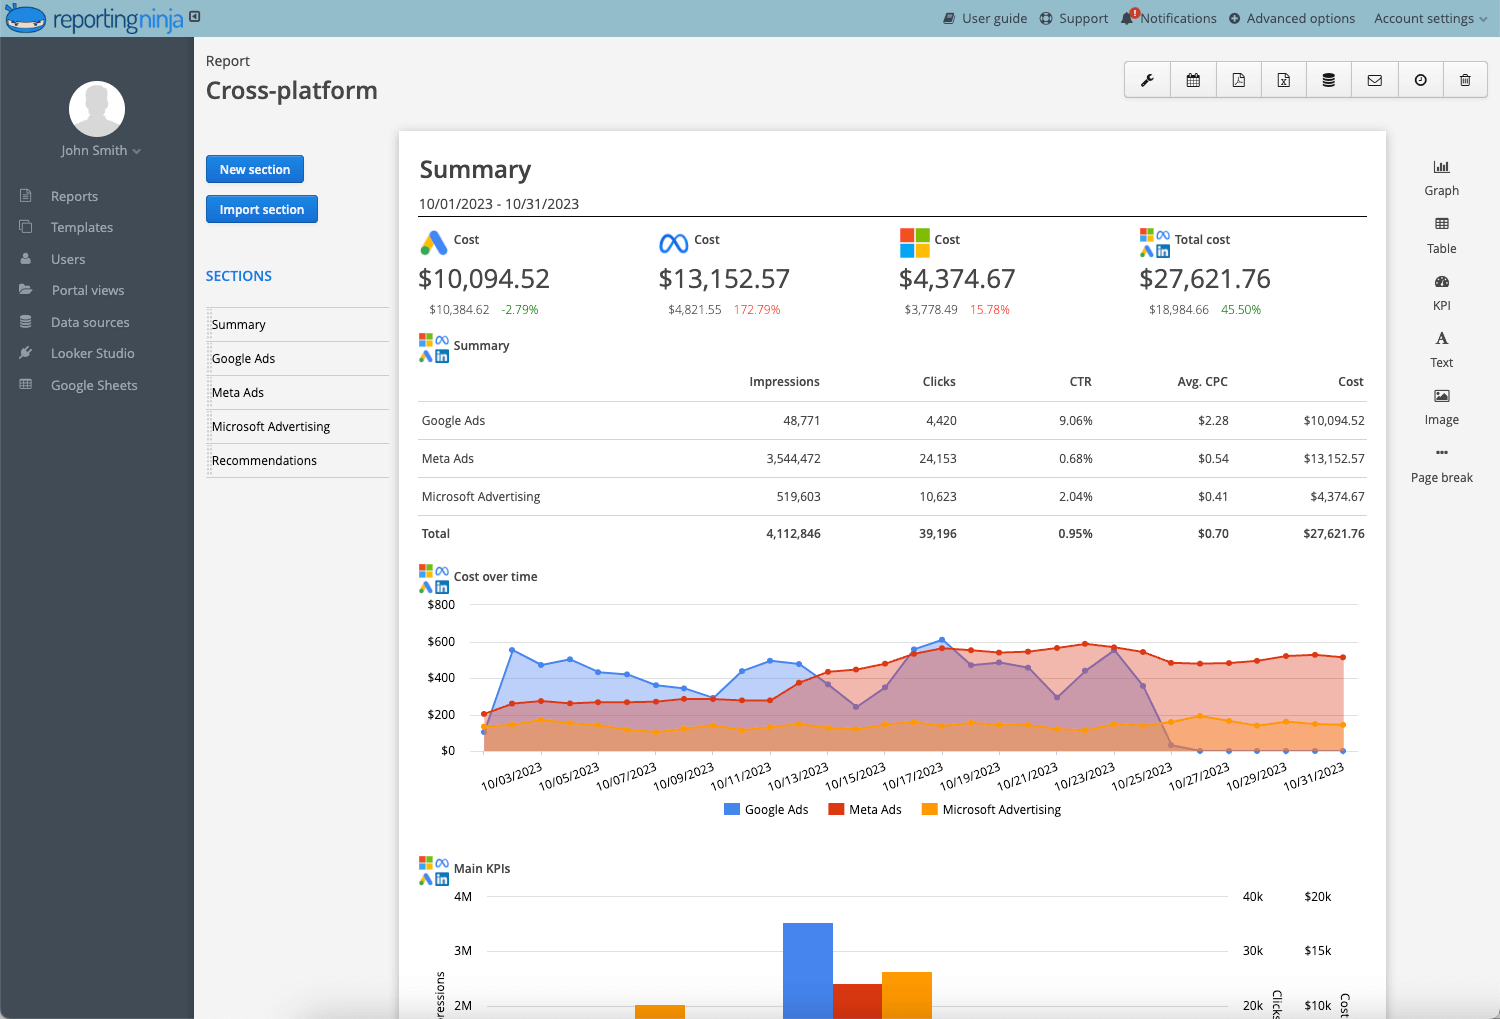
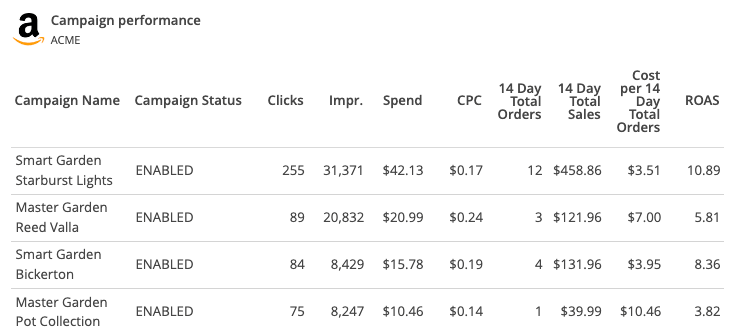
  • Clear performance summary
    Start with top-line metrics: spend, conversions, CPA, ROAS, and trend direction. Decision-makers shouldn’t need to dig.
  • Context behind performance shifts
    Explain why results changed. Budget increases, bid adjustments, seasonality, search volume, or creative updates.
  • Channel and campaign breakdowns
    Separate branded vs non-branded, prospecting vs remarketing, high-intent vs exploratory campaigns.
  • Search term and audience insights
    Highlight what’s driving conversions (and what’s wasting spend).
  • Forward-looking recommendations
    Outline what will be tested, scaled, paused, or reallocated next month.
An SEM report should answer three questions:

1. What happened?
2. Why did it happen?
3. What should we do next?

{{cta-block-v1}}

7 SEM report examples (+ templates)

Below are seven practical SEM report examples, along with downloadable templates and how each report can be visualized inside Reporting Ninja.

Executive summary SEM report

Best for: CMOs, founders, and budget holders who want clarity fast.

What to include

  • Total spend, conversions, revenue
  • CPA and ROAS
  • Month-over-month change
  • Top 2–3 drivers of performance
  • Clear next steps

How to present it

  • One-page dashboard
  • 5–7 KPIs maximum
  • Short written summary (no more than 5–6 lines)

Suggested visualizations

  • KPI scorecards
  • Trend line (spend vs conversions)
  • ROAS bar comparison (current vs previous period)

What clients actually care about

  • Is performance improving?
  • Are we hitting targets?
  • What are you changing next?

Template structure

  1. Performance snapshot
  2. Key changes
  3. Budget allocation overview
  4. Next month plan

Download template: Executive summary SEM report (editable dashboard format)

Campaign performance breakdown report

Best for: Marketing managers and performance leads.

What to include

  • Campaign-level spend and conversions
  • CPA by campaign
  • Branded vs non-branded split
  • Device or audience performance

How to present it

  • Table with sortable metrics
  • Highlight top and underperformers
  • Include performance thresholds

Suggested visualizations

  • CPA comparison bars
  • Conversion share pie chart
  • Cost vs revenue scatter chart

What clients actually care about

  • Which campaigns deserve more budget?
  • Which ones should be paused?
  • Where is wasted spend?

Template structure

  1. Campaign performance table
  2. Branded vs non-branded summary
  3. Audience/device breakdown
  4. Optimization notes

Download template: Campaign breakdown SEM report (Google Sheets format)

Keyword and search term insights report

Best for: Accounts focused on efficiency and query control.

What to include

  • Top converting keywords
  • High-cost, low-converting terms
  • Search term themes
  • Negative keyword opportunities

How to present it

  • Group queries by intent
  • Flag outliers
  • Separate exact vs broad impact

Suggested visualizations

  • CPA by keyword bar chart
  • Spend distribution by query theme
  • Heatmap of conversion rate

What clients actually care about

  • Are we paying for irrelevant clicks?
  • Which themes convert best?
  • Where can we tighten targeting?

Template structure

  1. Top 20 converting terms
  2. Cost inefficiency analysis
  3. Negative keyword recommendations
  4. Budget reallocation plan

Download template: Keyword insights SEM report (Excel format)

Budget pacing and forecast report

Best for: Accounts with strict monthly budgets.

What to include

  • Spend to date vs target
  • Daily pacing rate
  • Projected month-end spend
  • Revenue forecast

How to present it

  • Clear pacing percentage
  • Forecast vs actual comparison
  • Scenario projections (increase/decrease spend)

Suggested visualizations

  • Cumulative spend line graph
  • Forecast bar chart
  • Target vs actual gauge

What clients actually care about

  • Will we overspend?
  • Can we scale safely?
  • Are we on track for target ROAS?

Template structure

  1. Current pacing overview
  2. Forecast assumptions
  3. Risk scenarios
  4. Budget adjustment plan

Download template: Budget pacing SEM report (forecast calculator)

Conversion funnel performance report

Best for: Lead gen accounts with multiple touchpoints.

What to include

  • Click-to-lead rate
  • Lead-to-opportunity rate
  • Opportunity-to-sale rate
  • CPA at each stage

How to present it

  • Funnel view
  • Stage drop-off analysis
  • Identify weakest step

Suggested visualizations

  • Funnel chart
  • Stage conversion bars
  • Cost per stage comparison

What clients actually care about

  • Where are we losing leads?
  • Is traffic quality improving?
  • Are we scaling profitable stages?

Template structure

  1. Funnel overview
  2. Stage efficiency analysis
  3. Bottleneck summary
  4. Action plan

Download template: SEM funnel report (CRM-integrated template)

Geographic and audience performance report

Best for: Multi-location or regional campaigns.

What to include

  • Performance by region
  • CPA by location
  • Audience segment results
  • Budget distribution by geography

How to present it

  • Rank locations by efficiency
  • Separate top-tier vs underperforming regions
  • Include budget shift recommendations

Suggested visualizations

  • Geo heatmap
  • CPA by region bar chart
  • Audience comparison table

What clients actually care about

  • Which regions deserve more budget?
  • Where is performance weak?
  • Are we targeting the right segments?

Template structure

  1. Geographic breakdown
  2. Audience segmentation
  3. Budget efficiency comparison
  4. Reallocation recommendations

Download template: Geographic SEM report (regional dashboard)

Monthly optimization and testing report

Best for: Agencies that want to show strategic thinking.

What to include

  • Tests launched
  • Tests completed
  • Results and lift percentage
  • Upcoming experiments

How to present it

  • Before vs after comparison
  • Clear success criteria
  • Separate hypothesis from outcome

Suggested visualizations

  • Performance lift comparison bars
  • Test impact summary table
  • Timeline of experiments

What clients actually care about

  • Are we improving efficiency?
  • What worked?
  • What are we testing next?

Template structure

  1. Active tests
  2. Completed test results
  3. Performance impact
  4. Next test roadmap

Download template: SEM testing report (optimization tracker)

How to create an SEM report faster using Reporting Ninja

Manual reporting slows agencies down. Exporting data, cleaning spreadsheets, rebuilding charts. It soon adds up!

Reporting Ninja lets you standardize your SEM report templates and automate the data flow so you can focus on analysis instead of formatting.

Step #1: Connect your ad platforms

Start by integrating Google Ads, Microsoft Ads, Meta, or any other relevant channels.

  • Pull spend, conversions, revenue, and campaign data automatically
  • Blend multiple accounts into one dashboard
  • Schedule automatic refreshes
Pro Tip: Standardize your naming conventions before connecting accounts. Clean data in = clean reports out.

Step #2: Choose or customize your SEM template

Use pre-built SEM report templates or create your own.

  • Executive summary dashboards
  • Campaign breakdown tables
  • Keyword and search term views
  • Budget pacing trackers

You can tailor reports by audience — high-level for executives, granular for performance teams.

Common mistake: Overloading dashboards with 20+ metrics. Most clients need 6–10 core KPIs.

Step #3: Automate delivery and focus on insights

Once your dashboard is built:

  • Schedule automated email delivery
  • Share live dashboard links
  • Export to PDF when needed

This shifts your role from data compiler to strategist.

Did you know?

According to Hubspot, automated reporting can save teams 10–20 hours per week by eliminating manual data collection and report building.

Step #4: Standardize reporting across clients

Create a repeatable framework.

  • Same KPI structure
  • Same summary format
  • Same optimization commentary layout

Consistency improves clarity and reduces client confusion.

Red Flag: If every client report looks different, your process isn’t scalable.

Ready to automate your SEM reporting? Stop rebuilding reports every month. Build once, automate, and optimize from there.

Try Reporting Ninja and create your first automated SEM report in minutes.

{{cta-block-v1}}

Mistakes marketers make when reporting

Even experienced performance marketers fall into reporting habits that weaken their authority. If you’re accountable for revenue, your SEM report must drive decisions — not just display metrics.

Mistake Why does it hurt you What to do instead
Reporting too many metrics Clients lose focus and miss what matters Limit reports to core KPIs tied to revenue and cost efficiency
Showing data without context Numbers raise questions instead of answering them Add short explanations for performance shifts
Ignoring wasted spend Budget leaks go unnoticed Highlight underperforming campaigns and search terms
No clear next steps Reports feel passive and reactive End every report with specific optimization actions
Inconsistent formatting across clients Reporting becomes hard to scale Standardize templates and structure
Red Flag: Client asking what the numbers mean? Your report isn’t strategic enough.

Build your SEM report in minutes with Reporting Ninja

Manual spreadsheets slow down SEM reporting and make it harder to maintain consistency across clients. 

What agencies need instead is a structured process that delivers clear insights quickly. 

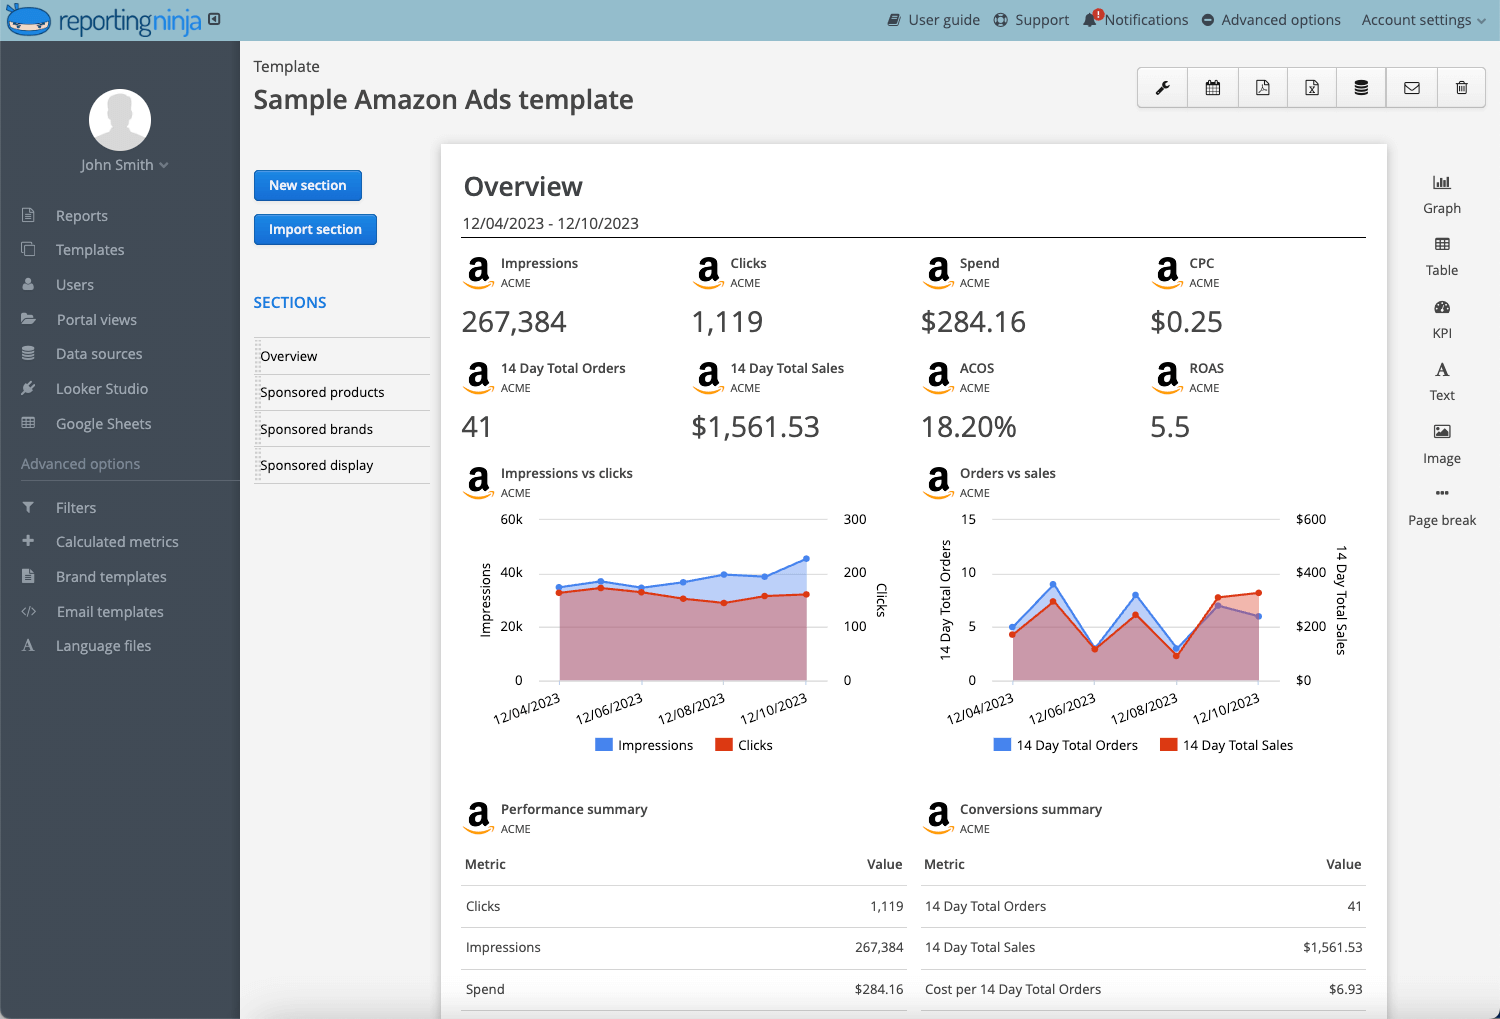
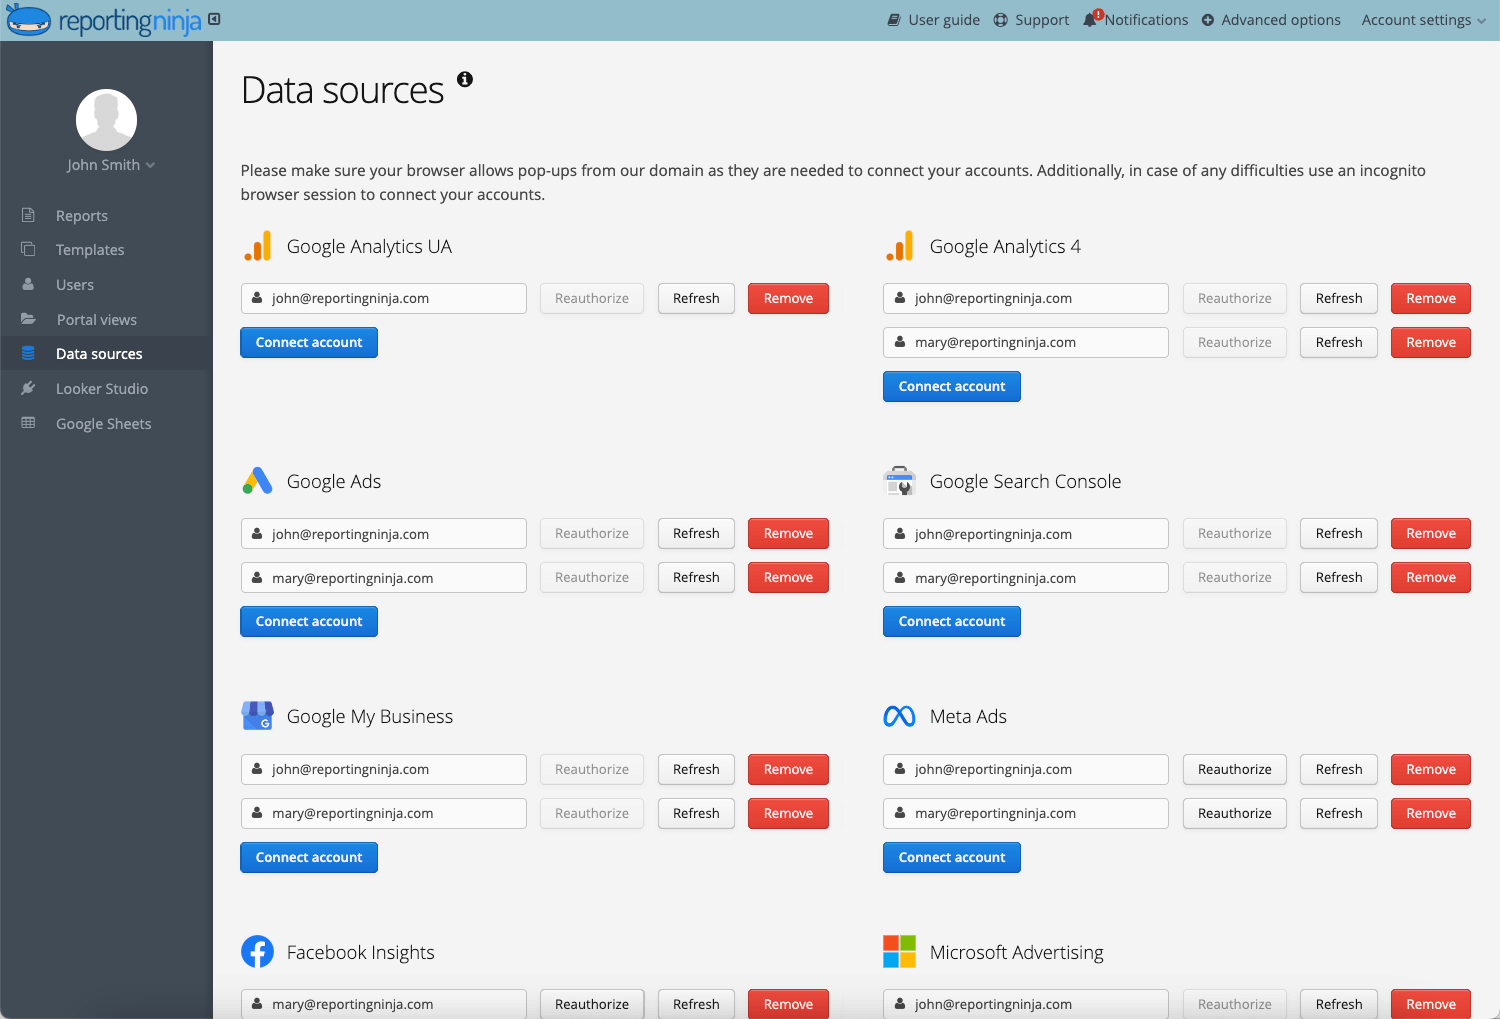
Reporting Ninja connects your ad platforms, applies standardized SEM report templates, and automatically generates dashboards and scheduled reports. 

This means less time exporting data and more time analyzing performance. 

If you want faster, client-ready reports built around the metrics that matter, start automating your SEM reporting with Reporting Ninja today.

FAQs

What should an SEM report include?

An SEM report should include spend, conversions, CPA, ROAS, trend comparisons, campaign breakdowns, and clear next steps. It should explain performance shifts and outline what will change moving forward.

How often should you send an SEM report?

Usually, monthly. Most agencies send detailed SEM reports once per month, with weekly summaries for active or high-budget accounts.

What metrics matter most in an SEM report?

It depends. For lead generation, focus on CPA, conversion rate, and lead quality. For ecommerce, prioritize ROAS, revenue, and cost efficiency. Always tie metrics back to revenue impact.

Should SEM reports be different for executives and marketing managers?

Yes. Executives want high-level performance and budget impact. Marketing managers need campaign-level breakdowns, keyword insights, and optimization detail.

Can you automate SEM reporting?

Yes. Dedicated SEM reporting tools can automatically pull ad platform data, update dashboards, and schedule report delivery, reducing manual work and standardizing reporting structure.

Elevate your marketing reports to the next level

Sign up for a 15 days free trial. No credit card required.

Instagram custom report
Kyle Rushton McGregor