Social
March 26, 2026
How to create effective Facebook reports for clients in minutes


Creating Facebook reports for clients often takes more time than running the campaigns themselves. Exporting metrics, formatting dashboards, and explaining performance can quickly become repetitive manual work.
With the right structure and tools, you can turn Facebook Ads data into clear, decision-ready reports in minutes.
This guide explains what clients actually expect from a Facebook marketing report and how to build one efficiently.
Clear Facebook reporting, including Facebook insights reports, helps clients understand performance, trust the strategy behind campaigns, and decide whether to continue working with your agency.
Transparency is one of the strongest drivers of long-term agency relationships. Research from HubSpot shows that agencies with high levels of transparency achieve 83% higher client retention rates.
Clients want to see how their Facebook advertising budget is used and what results it produces. Consistent, well-structured reports provide that clarity. They show performance trends, highlight what changed, and explain how those changes affect outcomes.
When reporting clearly connects activity to results, clients are far more likely to stay.
Renewal decisions are rarely based on raw campaign data. They depend on whether clients understand the value your work creates.
Reports that highlight outcomes such as conversions, cost per acquisition, and return on ad spend make that value visible. Instead of reviewing disconnected metrics, clients see clear evidence of progress and business impact.
When reporting consistently demonstrates results, renewal conversations become much easier.
Strong reporting also supports account growth. When performance trends are clearly documented, it becomes easier to recommend additional budget, new campaigns, or expanded services.
For example, if a report shows that a specific campaign consistently generates conversions at an efficient cost, clients are often open to increasing investment or testing additional audiences.
In this context, reports become a foundation for strategic discussion rather than just a summary of past performance.
Clients evaluate performance based on what they see in reports. If reporting focuses on impressions or likes, the perceived value of the work can fall behind the actual results.
Poor communication is a major churn driver. According to Project.co’s 2026 Business Communication report, 66% of customers who switched to a competitor cited poor communication as the main reason. In agency relationships, unclear reporting is often part of that gap.
Strategic reporting shifts the focus to outcomes that matter - leads, revenue impact, and customer acquisition costs. This helps align the client’s perception of success with actual performance.
Retention has a direct financial impact. Research from Harvard Business Review shows that increasing client retention by 5% can increase profits by 25% to 95%. Clear reporting supports retention by making results easier to understand and defend.
Facebook reporting is not just a deliverable. It directly influences trust, retention, and revenue growth. When done well, it becomes one of the most important tools for keeping and expanding client relationships.
{{cta-block-v1}}
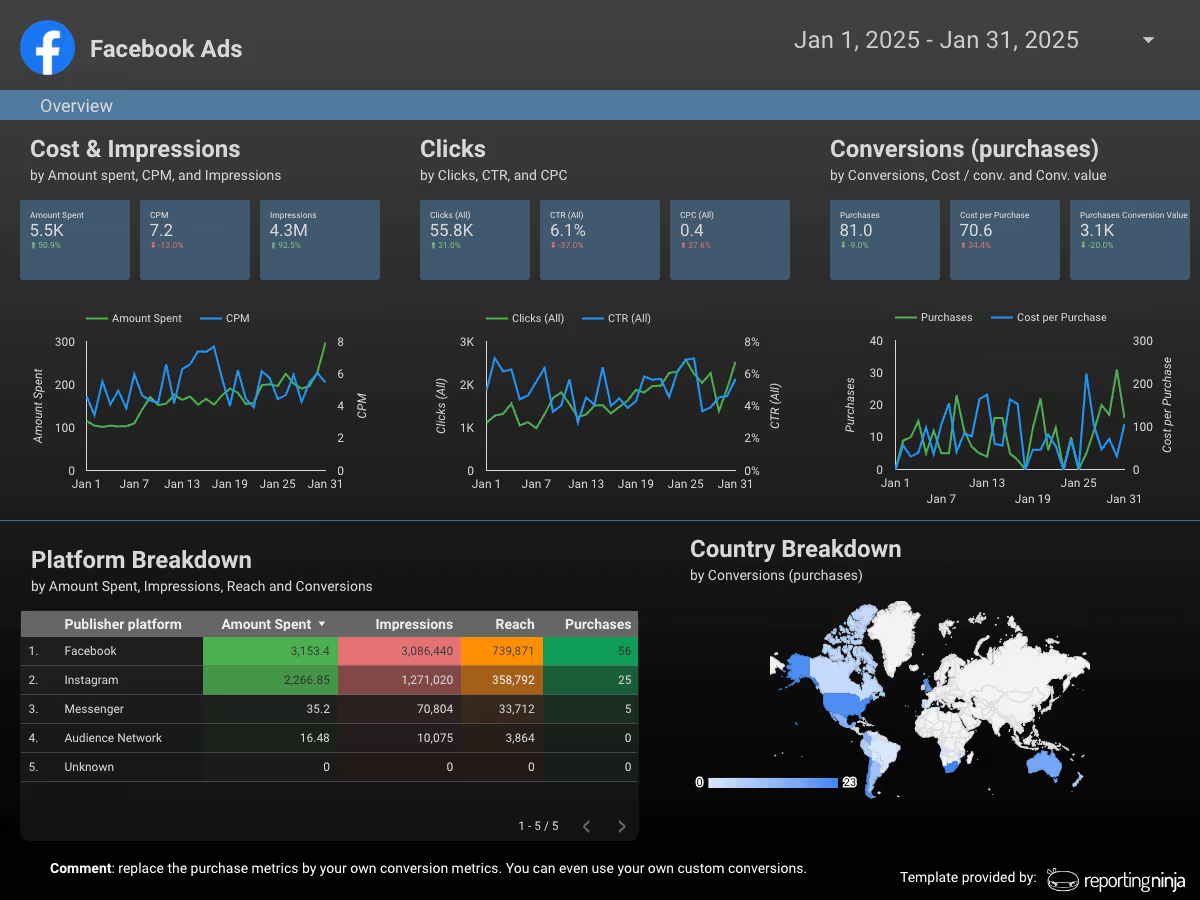
Clients don’t care about impressions. They care about outcomes. Your report should focus on the Facebook Ads metrics that influence revenue, efficiency, and growth (not just platform activity). Clarity beats volume here, too. A tight report with clear benchmarks is more valuable than 20 pages of data.
Benchmarks provide context. A $40 CPA means nothing unless it’s compared to past performance, industry averages, or target thresholds.
You don’t need complex spreadsheets or hours of manual exports. With the right structure and automation, you can build clear, client-ready Facebook reports in minutes.
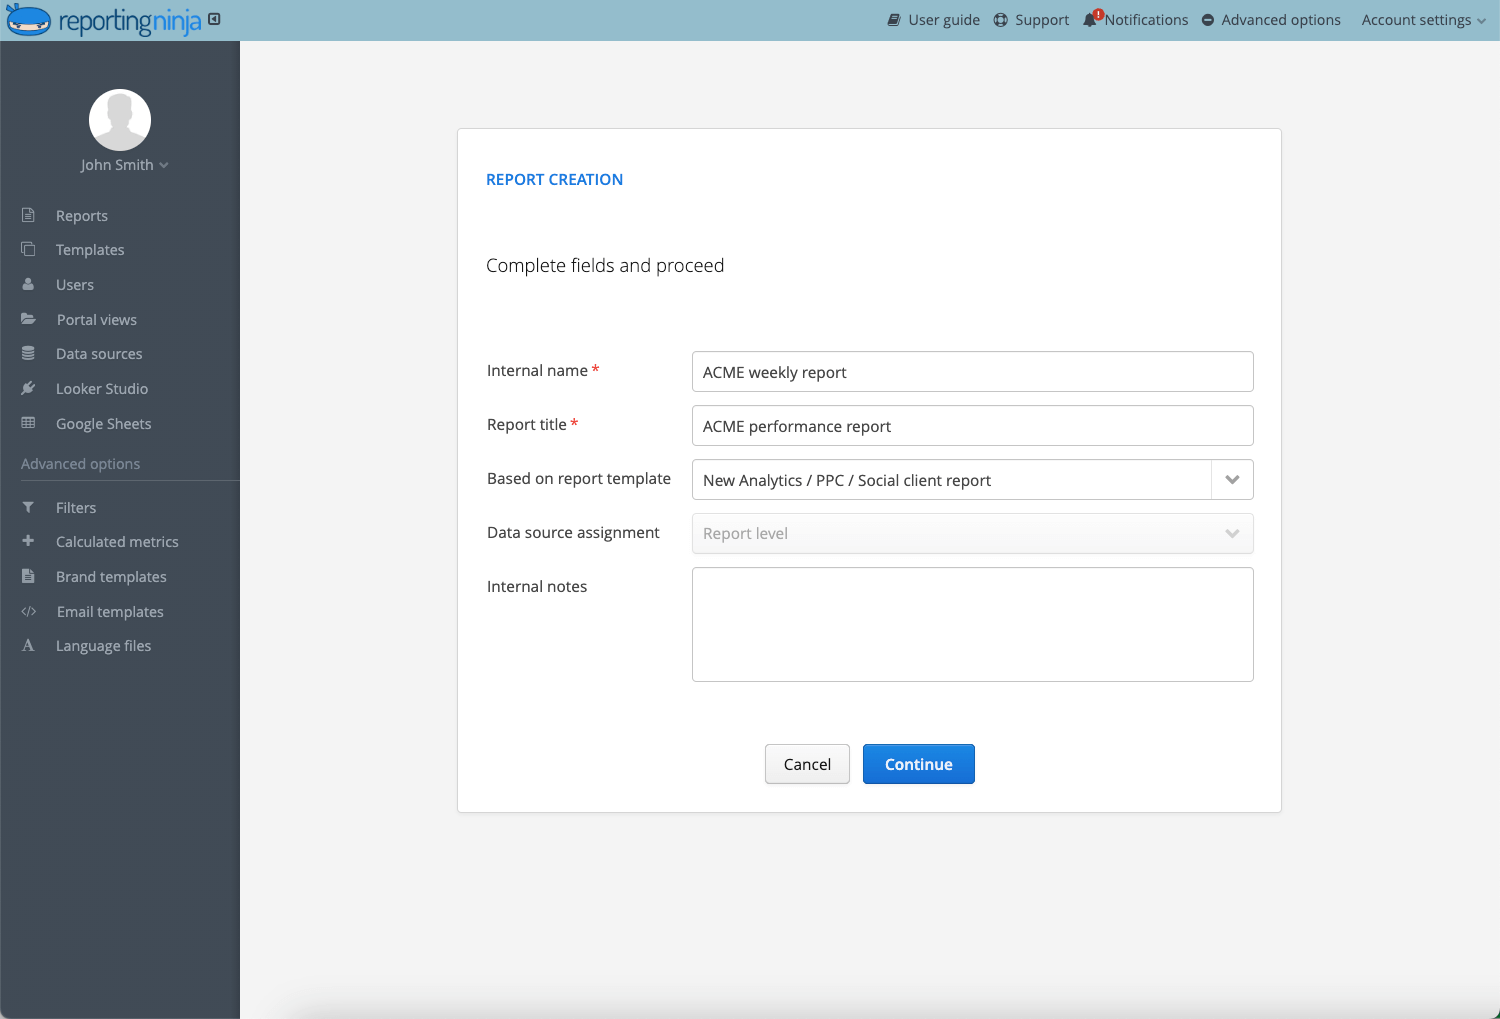
Start by connecting your Facebook Ads account to Reporting Ninja. The platform pulls live campaign data directly from the source, eliminating manual exports and copy-paste errors.
Once connected, select the ad accounts and date ranges relevant to your client. This ensures your report reflects accurate, up-to-date performance.
Choose only the metrics that align with the client’s goals. If the objective is lead generation, focus on CPL, conversion rate, and lead volume. If the goal is revenue or purchases, prioritize ROAS, revenue, and cost per acquisition.
Avoid adding metrics “just in case.” Each KPI should answer a business question.
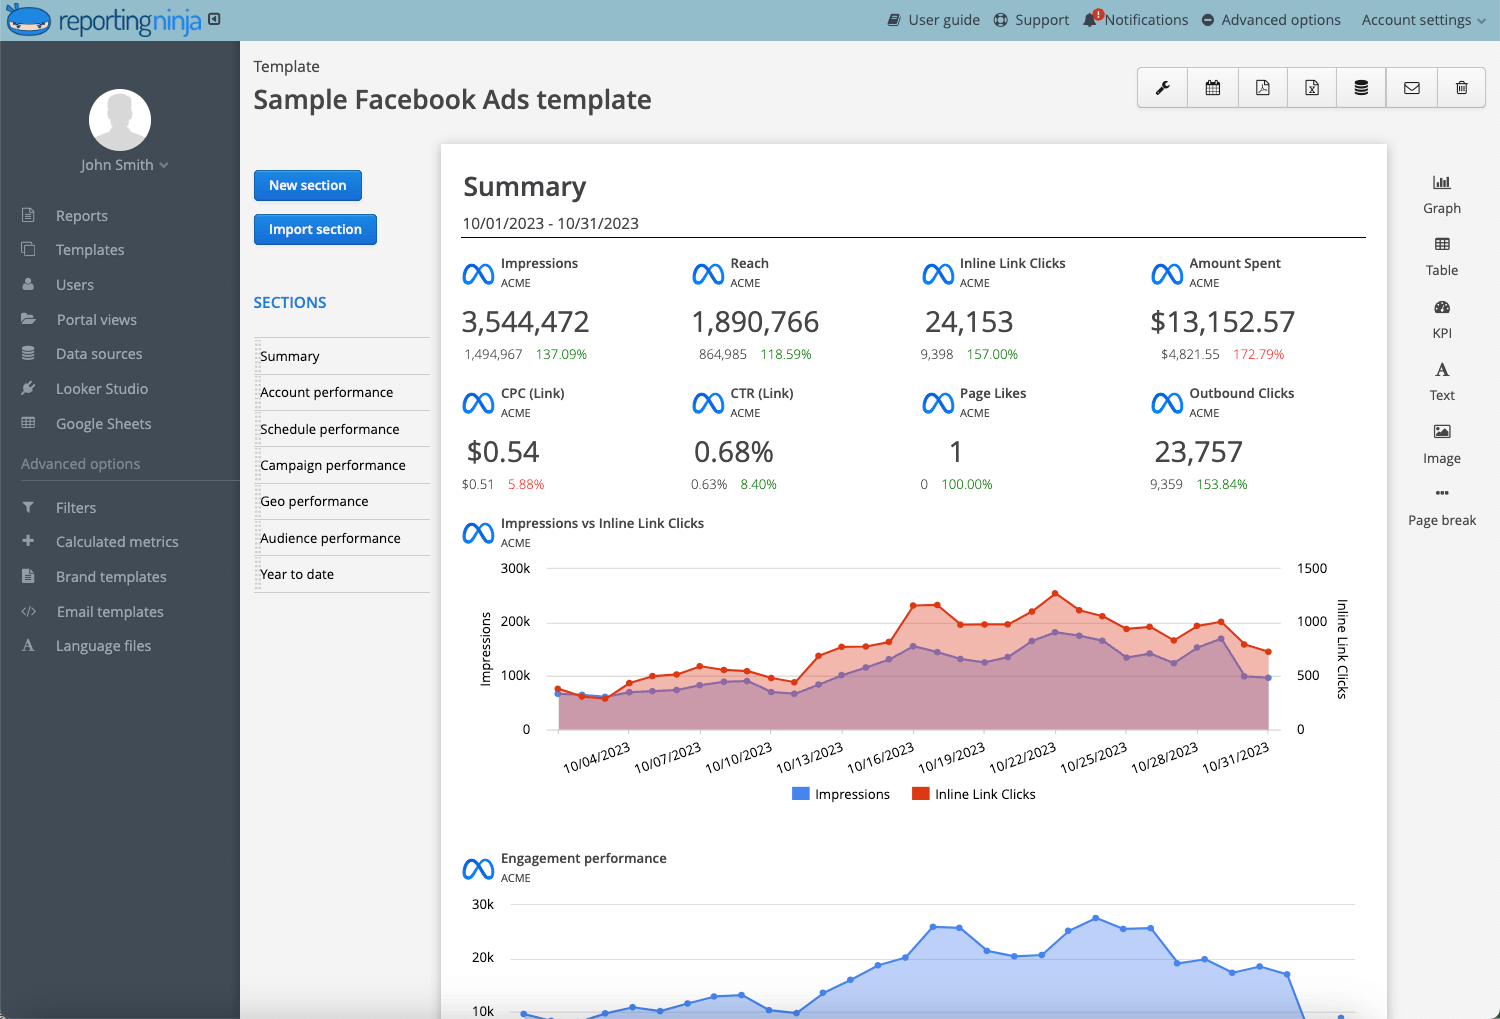
Reporting Ninja provides pre-built Facebook report templates designed for agencies. These templates organize metrics logically: performance overview first, campaign breakdown second, and supporting diagnostics last.
You can customize layouts, add branding, and standardize formatting across clients. This keeps reporting consistent and professional without manual formatting work.
Raw numbers lack context. Use month-over-month comparisons, target benchmarks, or industry averages to frame performance.
Showing that CPA improved 18% month-over-month communicates progress more clearly than listing the number alone.
Once finalized, schedule reports to send automatically via email or share live dashboards. Automation ensures consistency and eliminates last-minute reporting stress before client calls.
Recurring automation saves hours each month, especially when managing multiple accounts.
Want to simplify Facebook reporting? Try Reporting Ninja to automate dashboards and schedule client reports in minutes.
Most reporting issues don’t come from bad performance. They come from poor presentation. When reports lack focus or context, clients struggle to see value — even if the campaign itself is actually working!
Clear reporting reduces friction. Confusing reporting increases doubt. Over time, doubt leads to churn.
The structure of your Facebook report should reflect the client’s objective. Below are three focused report formats you can use depending on campaign goals.
Objective: Generate qualified leads at target CPL.
Report structure:
This format keeps the focus on efficiency and volume. It removes distractions like reach or Facebook engagement unless they directly affect CPL.
Objective: Scale revenue while maintaining target ROAS.
Report structure:
Here, revenue and profitability lead the report. Supporting metrics like CTR only appear if performance shifts require explanation.
Objective: Increase brand visibility at controlled CPM.
Report structure:
For awareness campaigns, efficiency still matters. Frequency control and cost trends help prevent budget waste while maintaining exposure.
Want to build these reports faster? Use Reporting Ninja’s Facebook Ads reporting templates to create client-ready reports and automate delivery in minutes.
{{cta-block-v1}}
Manual exports, spreadsheet edits, and formatting slow reporting down. With Reporting Ninja, you can connect your Facebook Ads accounts, select the right KPIs, apply structured templates, and automate delivery.
Instead of rebuilding reports every month, standardize them. Instead of explaining metrics repeatedly, present them clearly the first time. Instead of scrambling before client calls, schedule reports in advance.
If you manage multiple accounts, the time savings compound quickly.
Start your free trial and build your next Facebook client report in minutes.
A Facebook report is a structured summary of Facebook Ads performance. It includes key metrics like CPA, ROAS, conversions, and revenue to show campaign impact.
Most agencies send reports monthly. Weekly reports may be appropriate for high-spend or fast-scaling campaigns.
Six to eight KPIs are usually enough. More metrics can dilute focus and confuse stakeholders.
Sometimes. Include them only if the campaign objective is awareness or if they explain changes in performance.
Yes. Reporting tools like Reporting Ninja allow you to pull live data, apply templates, and schedule automated delivery.
Sign up for a 15 days free trial. No credit card required.

Build and automate amazing custom reports in a few clicks. Save time, be more productive, impress your clients.