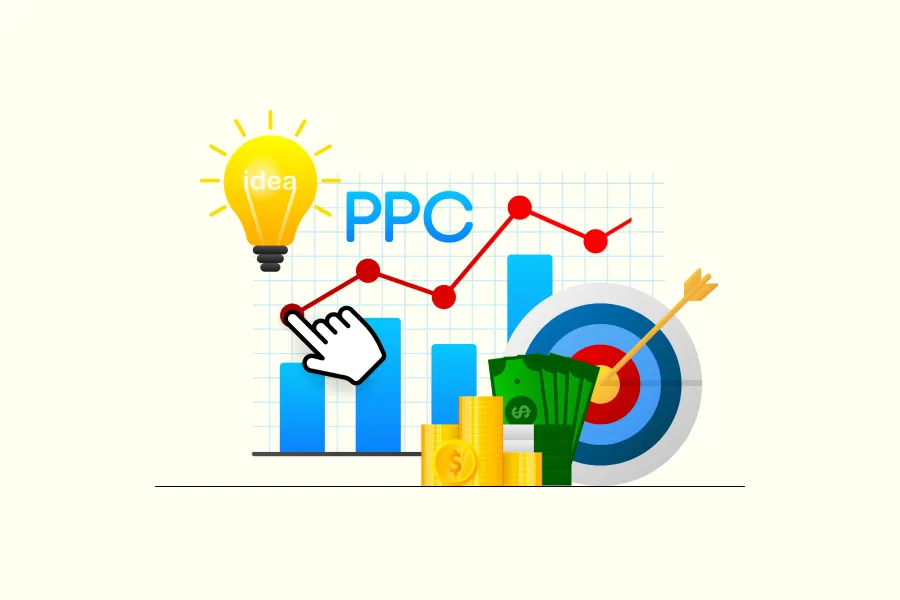
PPC
April 29, 2026
PPC reporting in 2026: how to track, what to measure, & pro tips


Struggling to prove the value of your PPC campaigns? You’re not alone. Many marketers spend thousands on ads without a clear view of what’s working and what’s wasting budget.
That’s where PPC reporting comes in.
Done right, PPC reporting gives you instant clarity on campaign performance, helps you allocate budget with precision, and shows your team (and stakeholders) what’s driving real results.
In this guide, you’ll learn exactly how to build a PPC report that delivers value. We’ll walk through key metrics to track, reporting best practices, and simple ways to improve performance using real data—not gut feelings.
Let’s break down what PPC reporting should look like in 2026—and how to do it better.
PPC reporting is the process of gathering, analyzing, and presenting data from your pay-per-click campaigns. These reports serve as a roadmap for your marketing efforts, offering a clear picture of how your ads are performing across different platforms. Whether you're running Google Ads, Facebook Ads, or campaigns on other networks, PPC reports help you understand the effectiveness of your strategies and pinpoint areas that need improvement.
Effective PPC reporting doesn't just involve compiling data; it’s about transforming raw numbers into actionable insights. By interpreting these insights, marketers can refine their strategies, reallocate budgets, and enhance overall campaign performance.
The primary purpose of PPC reporting is to measure the success of your advertising campaigns in a quantifiable way. This is crucial for several reasons:
PPC reports typically include a variety of key metrics that offer insights into different aspects of your campaign’s performance. Some of the most important metrics to monitor include:
These metrics, among others, provide a comprehensive view of your campaign’s health and are essential for making data-driven decisions. If you want to know more about these metrics in detail, check out our PPC tracking guide alongside our post on the most important PPC metrics.
PPC reporting plays a pivotal role in enhancing campaign performance by providing continuous feedback on what’s working and what’s not. Here’s how regular and thorough reporting can make a difference:
PPC reports let you see exactly which ads, keywords, and audience segments are producing the highest returns. Instead of guessing what’s working, you can spot clear patterns in high-performing campaigns and scale those efforts. Whether it’s a specific message, time of day, or platform, strategic reporting helps you lean into what’s driving results.
When you compare how different ad versions perform, it becomes easier to spot what resonates with your audience. Maybe shorter headlines drive more clicks, or one call-to-action consistently delivers better conversions. By using PPC reports to review these elements regularly, you can refine your messaging and visuals for stronger engagement and better ROI.
PPC platforms provide granular data about who is clicking and converting—broken down by age, device, location, time of day, and more. With this data in hand, you can shift spend toward your most profitable segments and cut back on underperforming ones. Precision targeting = less waste and more results.
A/B testing is only useful if you know what to test and how to interpret the results. PPC reporting gives you that foundation. By measuring changes in CTR, CPA, or conversion rate across test variants, you can confidently identify which ad elements are moving the needle—and apply those insights across your entire campaign structure.
Your PPC budget should go where it delivers the highest return. With clear reporting, you can spot which campaigns, ad groups, or platforms deserve more investment—and which ones are draining spend without delivering value. This lets you reallocate in real-time, keeping your overall strategy lean and profitable.
A well-structured PPC report doesn’t just present data — it tells a clear story about performance, spend, and what to do next. Whether you’re building one for yourself or a stakeholder, here’s how to do it step-by-step:
Every PPC report should open with a clear reminder of what the campaign is trying to achieve. Are you focused on driving leads, increasing ROAS, growing brand awareness, or cutting acquisition costs? This sets the context for everything that follows and keeps the report goal-focused—not just data-dense.
Pro tip: If you’re managing multiple campaigns with different goals, segment your report by objective so performance is easier to interpret.
Pull the core performance metrics from your ad platforms. At a minimum, include:
Make sure each metric aligns with the stated goal. If your goal is lead gen, CTR and CPA matter more than ROAS. If you’re focused on sales, conversion rate and ROAS take priority.
Avoid overloading the report with metrics that don’t tell a story. Clarity beats quantity.
Include a snapshot of your budget allocation vs. actual spend for the reporting period. This helps stakeholders see at a glance whether campaigns are pacing correctly or overspending.
If you’re running multiple campaigns or platforms, break this out by channel. That way you can spot where your budget is going — and whether it’s paying off.
This is where the insights start to emerge. Identify your best-performing keywords, placements, devices, and audience segments. Which ones are driving conversions at a sustainable cost? Which are draining budget without results?
You don’t need to list every data point — just surface what’s working, what’s not, and where there’s room for optimization.
Look for patterns across time, campaigns, or channels. Are certain days performing better? Is ROAS improving month over month? Has CPC spiked unexpectedly?
Spotting these trends helps you course-correct before performance dips — or double down when you see positive momentum.
Wrap up your report with clear, tactical suggestions based on what the data shows. Should you pause a poor-performing campaign? Shift budget to a high-ROAS audience? Test a new headline variant?
This final section should answer the question: “So what should we do next?”
Manually building PPC reports is how most marketers start. And for small campaigns, it can work fine. But as performance data piles up across multiple platforms, spreadsheets and screenshots quickly become unmanageable.
Here’s how manual and automated PPC reporting compare:
Manual reporting often relies on spreadsheets, platform exports, and manual copy-paste. It works when you only have one or two campaigns to manage — but it doesn’t scale. And one formula error or missed data pull can throw off the whole picture.
Automated tools connect directly to your ad accounts (Google Ads, Meta, Microsoft Ads, etc.), pulling fresh data into pre-built dashboards and templates. This means less time spent on data wrangling — and more time acting on the insights.
See how Reporting Ninja makes automated PPC reporting effortless.
If you’re ready to move beyond spreadsheets, these tools can help streamline your PPC reporting workflow. We’ll start with a full-featured reporting platform (Reporting Ninja), then include a few lighter or niche options that serve different use cases without overlapping heavily.
If you want full control, clean presentation, and zero manual work—this is the tool for you.
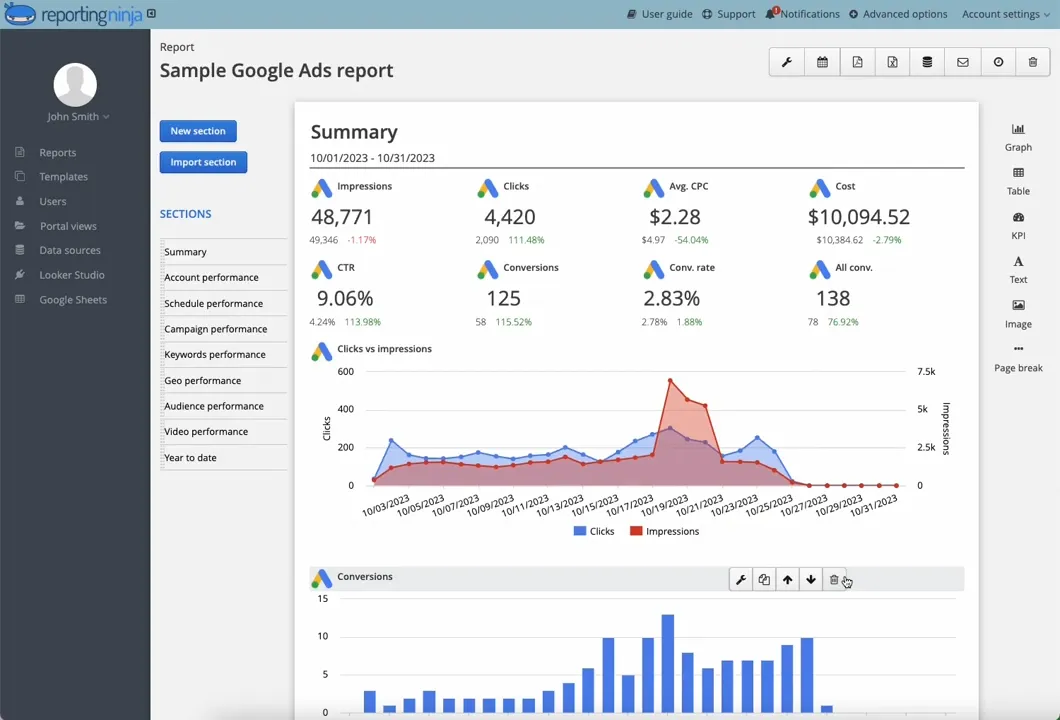
Reporting Ninja connects to Google Ads, Facebook Ads, Microsoft Ads, LinkedIn Ads, Google Analytics, and more. It pulls real-time data, supports custom dashboards, and lets you build white-labeled reports that update automatically. Whether you’re managing five campaigns or five hundred, Reporting Ninja is built to scale with you.
Source: Google
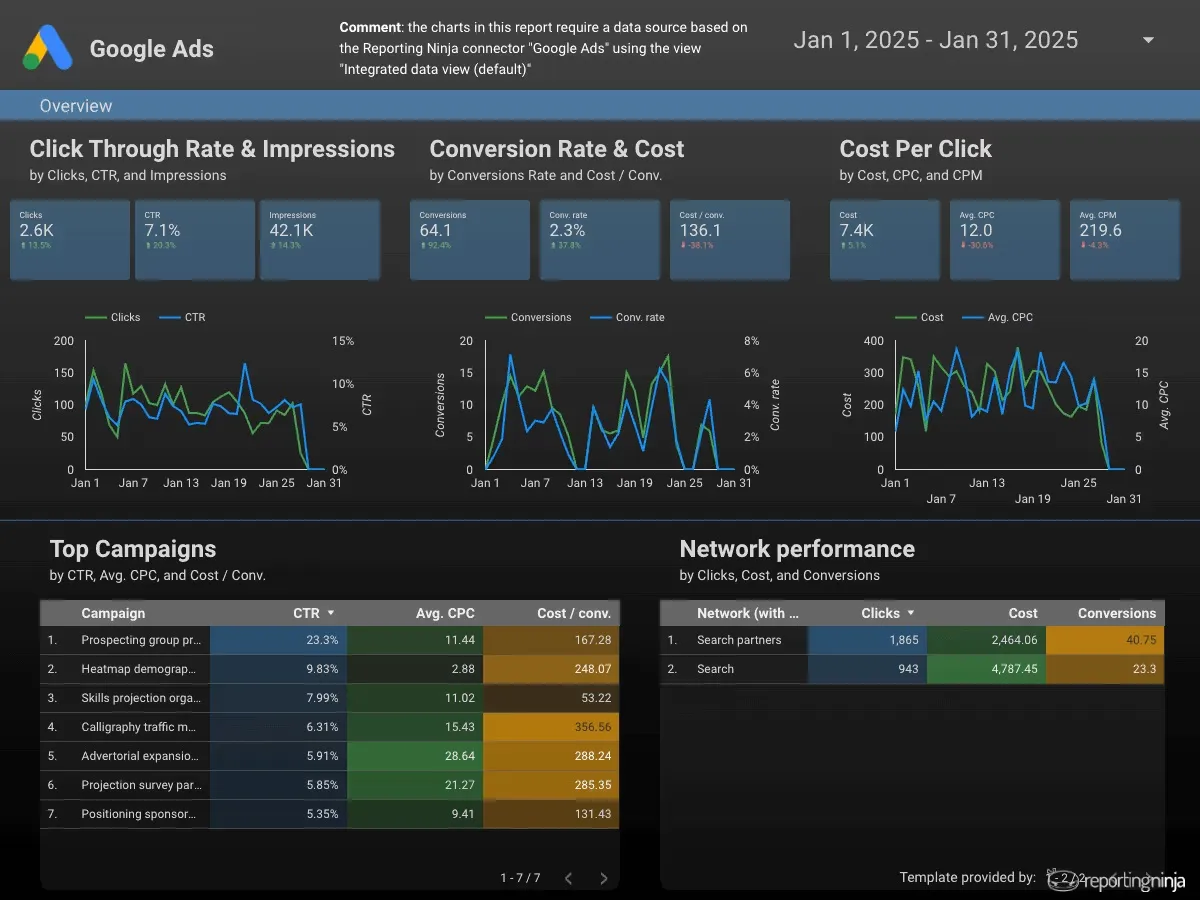
Looker Studio is Google’s free data visualization tool. It’s flexible and supports custom dashboards—if you’re comfortable building them from scratch.
And if you’re already using Looker Studio, Reporting Ninja can simplify the process with built-in connectors and templates for major PPC platforms.
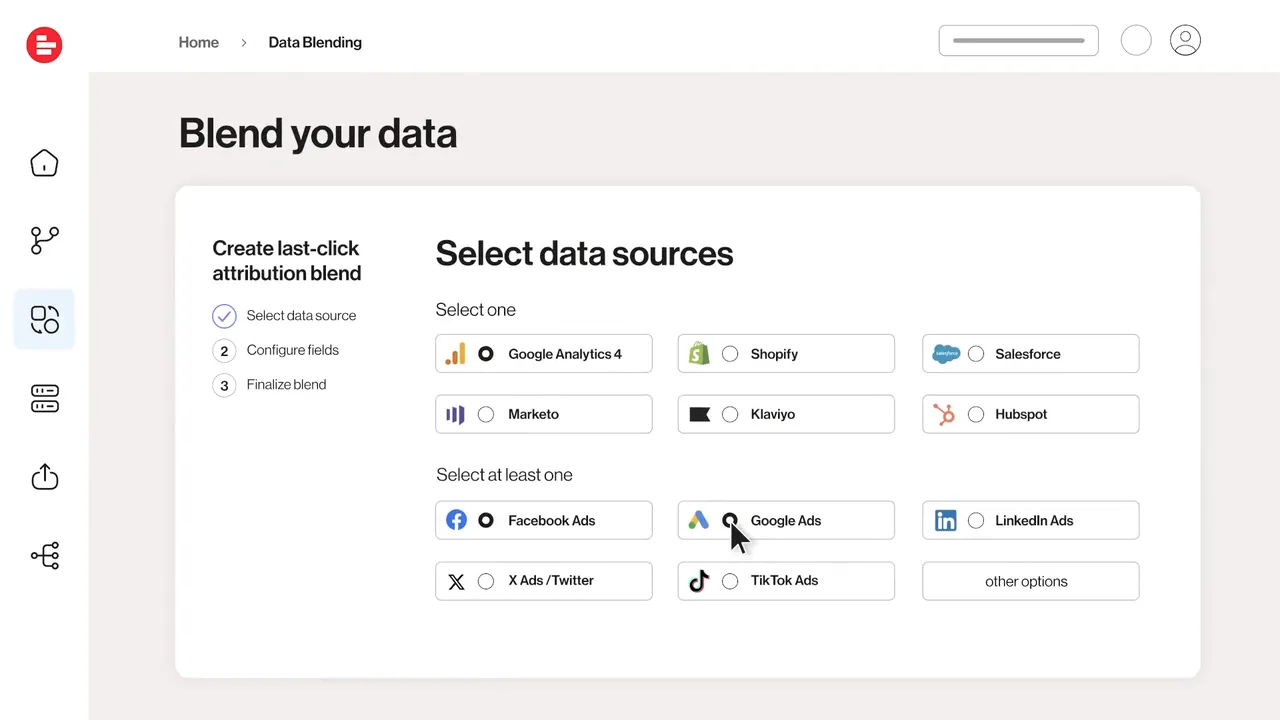
Source: Supermetrics
Supermetrics is a data pipeline tool that moves marketing data into spreadsheets, dashboards, or BI tools. It doesn’t create reports itself—it just delivers the raw data.
To better understand how Supermetrics fits your budget and reporting needs, explore our overview of Supermetrics pricing.
Source: Swydo
Swydo offers reporting automation with a focus on simplicity. It’s a lighter alternative for agencies that need basic performance reports without deep customization.
Once your PPC reporting process is up and running, it’s not just about tracking data — it’s about making your reports clearer, smarter, and easier to act on. Here’s how to get the most value from your reports:
Your CMO doesn’t need the same level of detail as your PPC analyst. Customize your reports based on who will be reading them. Executives want top-level KPIs and budget summaries. Campaign managers want channel performance and optimization insights. Same data — different views.
Don’t overwhelm your reports with every available data point. Focus on the metrics that directly support your campaign goals — whether that’s ROAS, CPA, or CTR. Clean, targeted reports are easier to interpret and act on.
Charts, graphs, and tables can turn walls of numbers into clear trends and patterns. Visuals help stakeholders quickly spot performance shifts and make decisions faster. Just don’t overdo it — choose visuals that genuinely clarify the data.
Whether you report weekly, bi-weekly, or monthly, consistency is key. It helps identify trends over time and keeps all stakeholders aligned. Irregular reports make it harder to spot performance changes or pacing issues until it’s too late.
Manual reporting is slow and error-prone. Automation tools let you pull real-time data, apply consistent formatting, and share reports on schedule — without the copy-paste grind. More importantly, they give you back time to focus on strategy instead of spreadsheets.
{{cta-block-v1}}
Even well-built PPC reports can miss the mark if they fall into these common traps. Avoiding them keeps your reporting useful, accurate, and impactful.
High impressions and clicks look good, but they don’t always mean your campaign is working. If those clicks aren’t converting, they’re just noise. Focus on performance metrics tied to real outcomes like ROAS, CPA, and conversion rate.
It’s easy to highlight wins and downplay losses, but you learn more from what’s not working. Don’t gloss over poor-performing campaigns or rising CPAs. Flag them early and explain how you plan to respond.
Piling on too many charts, filters, or metrics makes reports hard to read. Keep formatting clean and insights easy to digest. If a stakeholder has to dig for answers, the report isn’t doing its job.
Blended metrics hide performance issues. Break out results by platform, device, location, or audience where possible. You’ll catch trends and outliers faster — and make smarter optimization decisions.
Data without context is just noise. Every report should answer: What happened? Why? And what should we do next? If those answers aren’t clear, your report needs work.
PPC reporting is not just a routine task; it’s a powerful tool that, when done correctly, can significantly improve your digital marketing performance. By following the best practices outlined above, you can create reports that not only provide clarity but also drive action and results.
Ready to streamline your PPC reporting process? Explore the PPC Reporting Tool from Reporting Ninja. It’s designed to simplify the reporting process, providing you with all the insights you need to optimize your campaigns and achieve your marketing goals.
Start making data-driven decisions with ease today!
{{cta-block-v1}}
Sign up for a 15 days free trial. No credit card required.

Build and automate amazing custom reports in a few clicks. Save time, be more productive, impress your clients.