Social
April 24, 2026
Set up Facebook Ads reporting dashboard in 10 minutes (template)


Every day, you open Facebook Ads Manager to answer the same questions:
Is ROAS holding? Which ad sets are slipping? Where’s the budget leaking?
And every time, you end up exporting data, fixing columns, and formatting numbers just to get a usable view. It’s slow. Repetitive. And completely avoidable.
A Facebook Ads reporting dashboard gives you the clarity Ads Manager doesn’t. One screen. Live metrics. Everything you need to make decisions without digging for it.
In this guide, you’ll learn how to set up a complete dashboard in 10 minutes, which KPIs actually drive results, and how to automate reporting so you never manually build a client report again.
A Facebook Ads reporting dashboard is a visual tool that tracks and displays your campaign performance in real time. It brings together key metrics (like impressions, clicks, conversions, and cost) into one organized view.
Instead of jumping between reports, you can monitor everything from one dashboard. You’ll instantly see what’s working, where ad spend is going, and which campaigns drive the best return.
A Facebook Ads dashboard saves time, removes guesswork, and gives you a clear view of your marketing ROI. The main advantages:
Instead of switching between multiple reports, you get all campaign metrics—spend, clicks, impressions, conversions—in one place. It simplifies analysis and reduces reporting time.
Visual dashboards highlight trends instantly. You can identify which ads perform best, cut underperformers, and reallocate budget without digging through data exports.
Team members, clients, and stakeholders can access real-time performance updates. It helps align strategy, speed up approvals, and maintain consistent reporting standards.
Put simply, a dashboard removes the noise. Instead of digging through Ads Manager, you get a clear, always-updated view of performance that lets you act faster and report smarter.
Create automated Facebook Ads reports with Reporting Ninja.
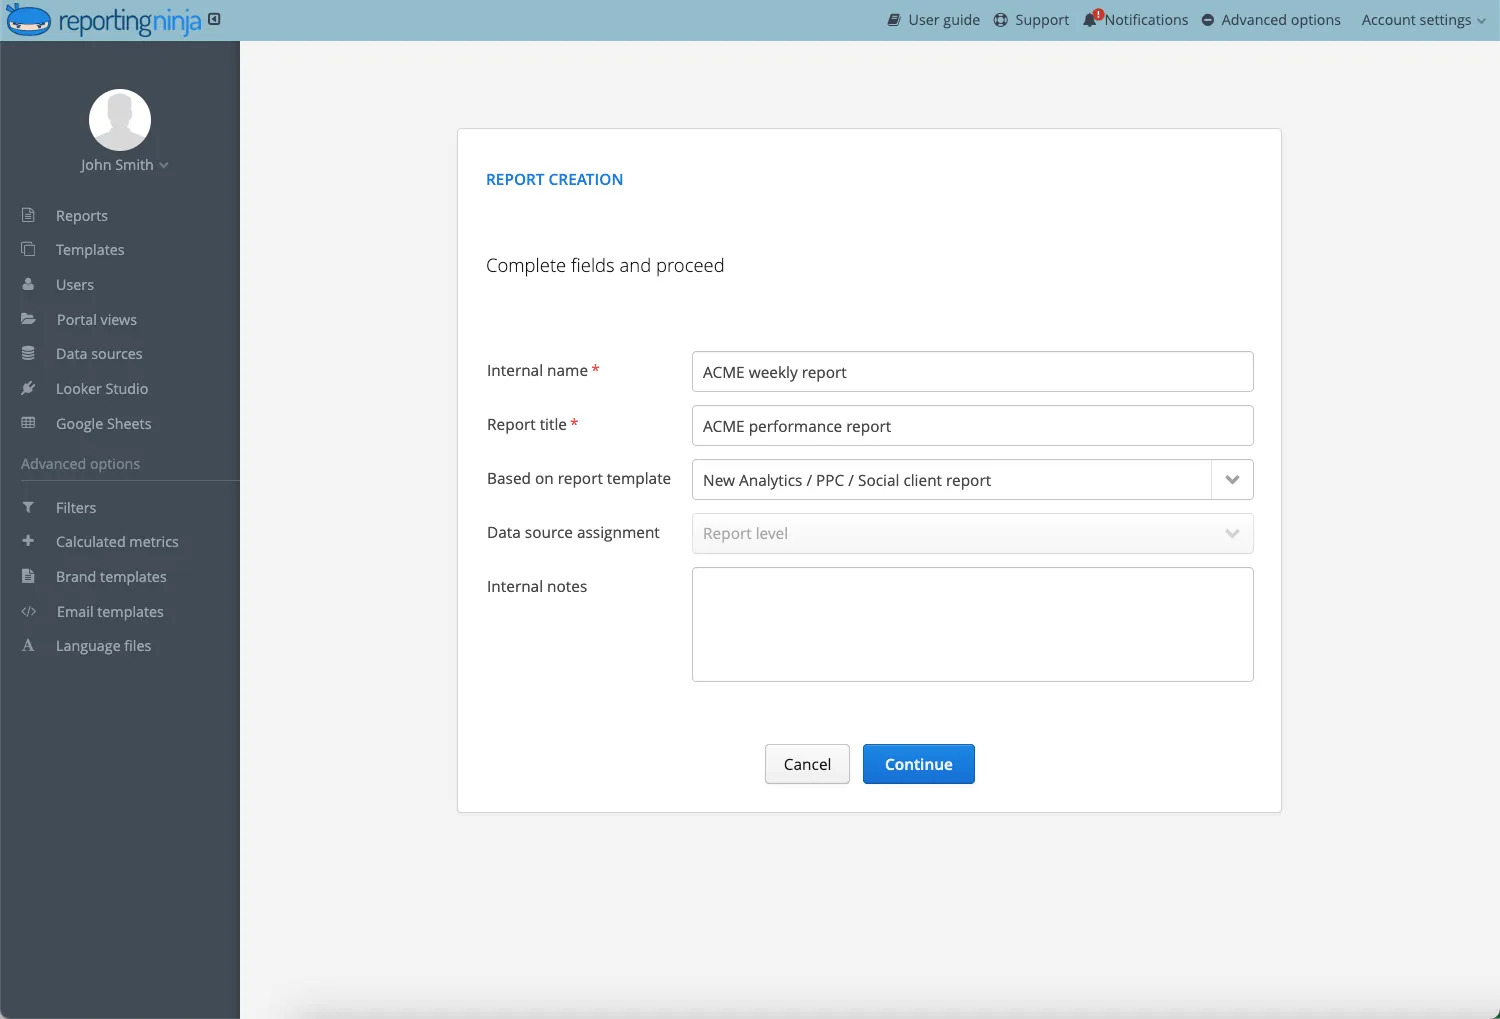
Creating a Facebook Ads reporting dashboard is straightforward once you define your goals and pick the right tool. Follow these steps to get it done in about 10 minutes.
Start by identifying what matters most—conversions, ROAS, leads, or engagement. These goals determine which metrics you’ll include and how you’ll visualize performance.
Choose a reporting tool that integrates directly with Facebook Ads. Reporting Ninja connects in seconds and automatically syncs your data, saving hours of manual exports.
Include essentials like impressions, clicks, CTR, CPC, and cost per conversion. Add ROAS, reach, or frequency if you manage multiple campaigns or audiences.
Group metrics logically: performance at the top, spend in the middle, and conversion data below. Use charts to make trends and ROI easy to interpret.
Schedule automated reports to update daily or weekly. Reporting Ninja lets you share dashboards instantly with clients or teammates, keeping everyone aligned.
When you set this up with a tool built for marketers, like Reporting Ninja, the dashboard becomes a fully automated reporting system. Your metrics update in real time, your reports send themselves, and you avoid the manual exports that drain hours from every week.
A great dashboard is more than a collection of metrics. It's a decision-making tool. Keep these practices in mind when building yours:
Decide what business questions your dashboard should answer before choosing metrics or layouts. A performance dashboard answers "what's working?" while an ROI dashboard answers "is this profitable?"
Focus on the KPIs that drive performance. Too many metrics create clutter and confusion. Eight to ten metrics are usually enough for a performance overview.
Compare data week over week or month over month to identify true trends, not one-off spikes. Facebook's algorithm takes time to optimize; judge campaign performance over at least 7-14 days.
Use charts and color coding to make results easy to interpret at a glance. Avoid over-styled visuals that distract from insights. A simple line chart beats a flashy 3D pie chart every time.
Automate data refreshes and report sharing so you spend less time pulling numbers and more time optimizing campaigns. Manual reporting is where hours disappear.
Several tools can help you visualize and automate Facebook Ads reporting, but they differ in setup time, customization, and how much manual work they remove. Here are the top options to consider.
As one of the leading social media reporting tools, Reporting Ninja connects directly to Facebook Ads and pulls your data automatically, no CSV exports, no manual refreshes, no connector plugins. You can start with pre-built templates for ROAS, CPC, CTR, and conversions, or customize your own dashboard in minutes.
It also supports white-label branding and automated delivery of facebook reports for clients, making it a strong fit for agencies managing multiple ad accounts. It’s built for agencies managing multiple ad accounts without the enterprise price tag.
A flexible, free dashboard tool if you prefer building everything from scratch. It offers deep customization but usually requires extra steps, like setting up data connectors, managing quotas, and troubleshooting blend errors. Reporting Ninja includes a ready-made Looker Studio Facebook Insights template that removes most of that setup work.
Supermetrics is helpful for pulling Facebook Ads data into Google Sheets, BigQuery, Looker Studio, or other visualization tools. It’s powerful for teams that want raw data control, but it only handles extraction—you’ll still need another platform to build and visualize your dashboards.
Looker Studio and Supermetrics offer plenty of flexibility, but they take longer to configure. If your priority is speed and automation, Reporting Ninja gives you a working dashboard immediately, without the extra moving parts.
Explore more options in our detailed guide on Supermetrics alternatives.
{{cta-block-v1}}
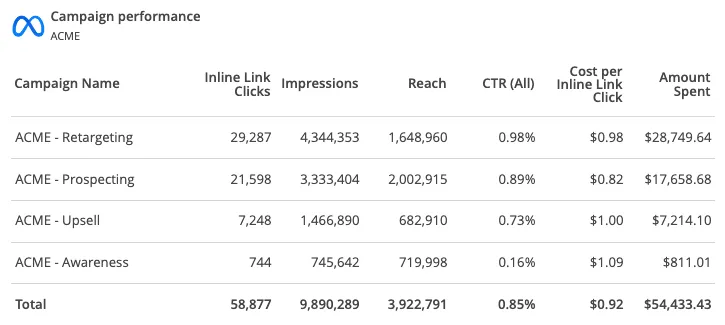
A well-built dashboard focuses on the metrics that actually impact performance. Tracking everything leads to clutter, so focus on these essentials instead:
These metrics together give you a complete picture of performance, from visibility to ROI, so you can optimize campaigns with precision.
Not every dashboard serves the same purpose. Depending on your marketing goals, you'll want to choose or build a dashboard that focuses on the right insights. Here are the three most common types:
Your all-in-one view of campaign health. Highlights key metrics like impressions, clicks, CTR, CPC, and conversions. Use it for daily performance checks and quick budget adjustments. Most marketers rely on this dashboard as their primary reporting view.
If your goal is profitability, this is the dashboard to watch. Focuses on ROAS, total revenue, cost per conversion, and customer acquisition cost. Track whether ad spend translates into sales and which campaigns deliver the highest return on investment. Essential for decision-makers managing large budgets or multiple campaigns.
Breaks down campaign performance by audience type: demographics, interests, devices, and regions. Shows you who responds best to your ads and where your budget performs strongest. Use these insights to refine targeting, expand winning audiences, and reduce wasted spend on segments that don't convert.
The right dashboard depends on what you’re trying to understand—overall performance, profitability, or audience behavior. Use each type for a specific job instead of trying to make one dashboard do everything.
A strong Facebook Ads dashboard follows a clear hierarchy: summary metrics at the top, performance trends in the middle, campaign breakdowns at the bottom:
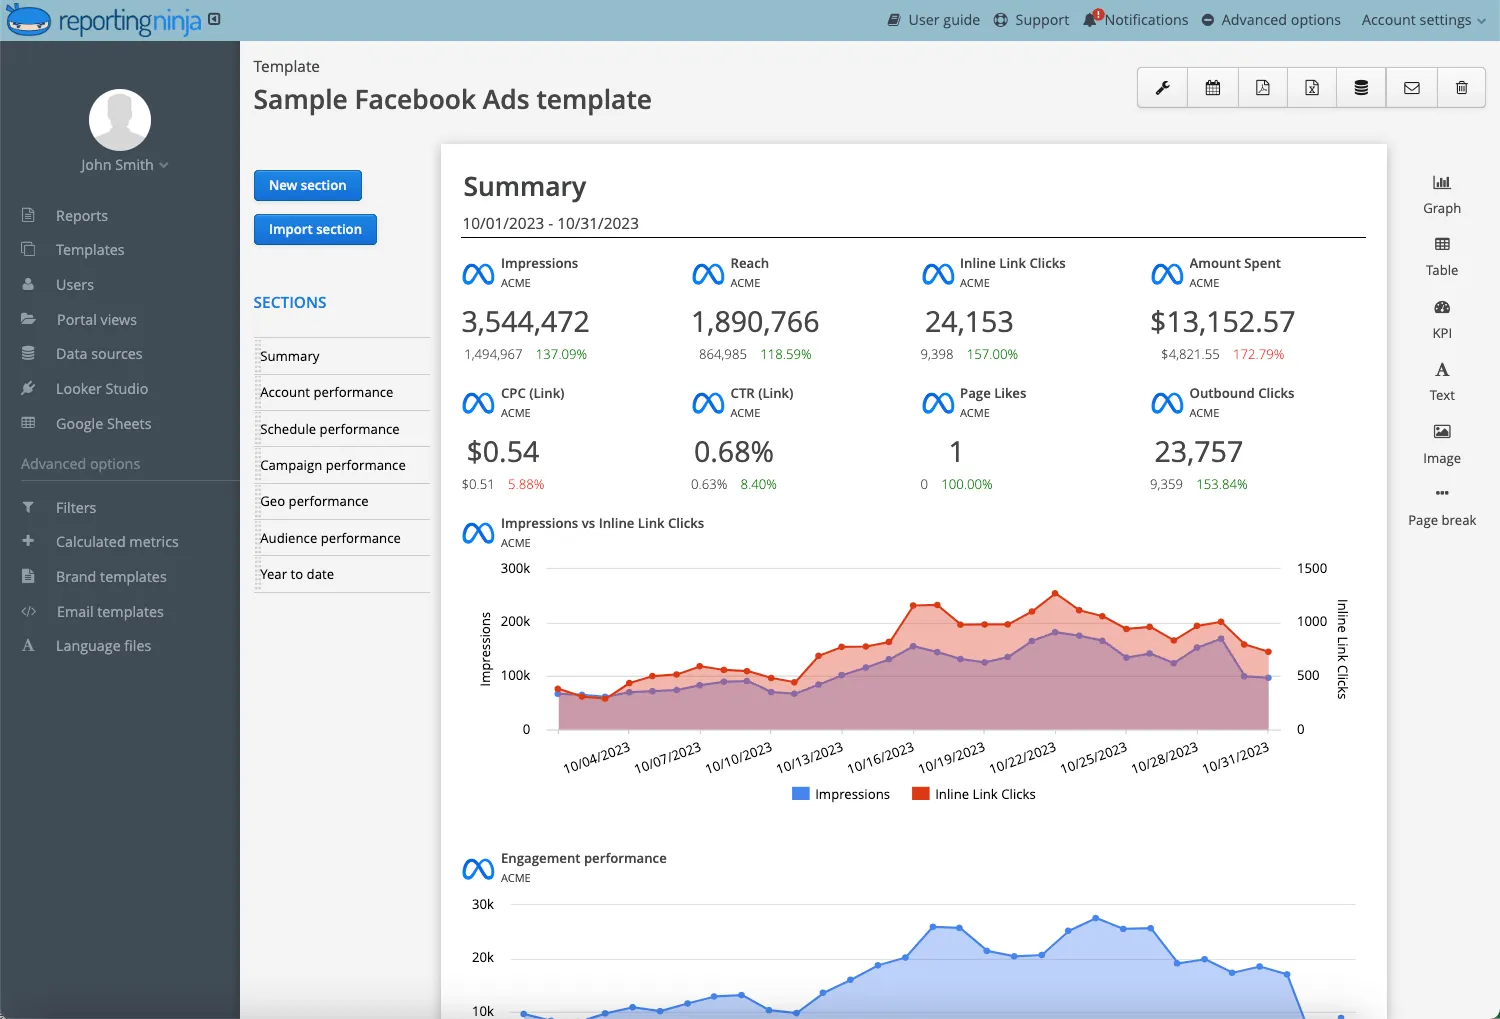
This layout gives you both performance and profitability in one view. You can make budget decisions in seconds instead of hunting through Ads Manager.
Manual reporting slows everything down. Dashboards fix that, but only if they update reliably, stay organized, and are easy to share. Reporting Ninja handles the data syncs, the templates, and the client delivery so your reporting becomes a background process rather than a weekly chore.
If you want Facebook Ads reporting that runs itself, try Reporting Ninja free today and get your dashboard live in minutes.
{{cta-block-v1}}
Sign up for a 15 days free trial. No credit card required.

Build and automate amazing custom reports in a few clicks. Save time, be more productive, impress your clients.