Social
May 27, 2026
2026 Social media analytics dashboard examples, types & how to use


Tracking social media performance usually means hopping between platforms, exporting reports, and piecing together data manually. It’s slow, inconsistent, and rarely client-ready.
A social media analytics dashboard changes that by pulling every key metric into one view.
In this guide, you’ll see how dashboards work, why they matter, and real examples you can use to save time and impress clients.
A social media analytics dashboard is a single, centralized view of your performance across platforms like Facebook, Instagram, LinkedIn, and TikTok.
Instead of switching between native tools such as Facebook Insights or Twitter Analytics, you get all key KPIs in one place. This unified view makes it easier to benchmark channels side by side, track progress toward campaign goals, and identify trends before they’re obvious in siloed reports.
For agencies and freelancers, the difference is even bigger: instead of wasting hours exporting spreadsheets or screenshots, you can create professional, client-ready reports in minutes. The result is less manual effort, faster insights, and data stories clients actually understand.
Managing social media performance without a dashboard often means scattered data, wasted hours, and inconsistent insights. A dashboard fixes these issues and adds value in ways that go beyond efficiency.
Without a dashboard, reporting means jumping between platforms, exporting spreadsheets, and stitching data together. It’s slow and prone to error. A social media analytics dashboard automates this process by pulling all KPIs into one place.
Agencies and freelancers can spend less time formatting numbers and more time analyzing results, managing multichannel campaigns, and delivering insights that actually move the needle.
Native analytics tools work well in isolation, but they make cross-channel comparisons difficult. A dashboard solves this by combining data from Facebook, Instagram, LinkedIn, TikTok, and more into a single view.
This unified perspective makes it easy to spot trends, benchmark performance, and allocate budgets where they’ll have the most impact—something fragmented reports can’t provide.
Clients don’t want raw spreadsheets; they want clarity. Dashboards present complex metrics in a simple, visual format that highlights what matters.
Instead of wading through dozens of charts, clients see a story: what’s working, what isn’t, and where opportunities lie. This improves trust and makes it easier to demonstrate ROI at every reporting cycle.
For agencies, presentation matters. White-label dashboards let you apply your own logo, colors, and style so reports look like they were built in-house. Reporting Ninja offers flexible white-label options, allowing you to deliver polished dashboards that reinforce your brand. It’s a simple way to add professionalism without spending extra hours on design.
A social media analytics dashboard doesn’t just make reporting easier—it makes it more effective. By saving time, unifying data, and elevating client communication, it turns reporting from a chore into a competitive advantage.
Dashboards aren’t one-size-fits-all. The right setup depends on what you need to measure and who will see the results. Below are five common dashboard types agencies and freelancers use to track performance and present client-ready insights.
An engagement dashboard shows how people interact with content—likes, comments, shares, and click-throughs. Agencies use this to identify what resonates, such as which Instagram Reels spark the most discussion or which LinkedIn posts generate quality clicks.
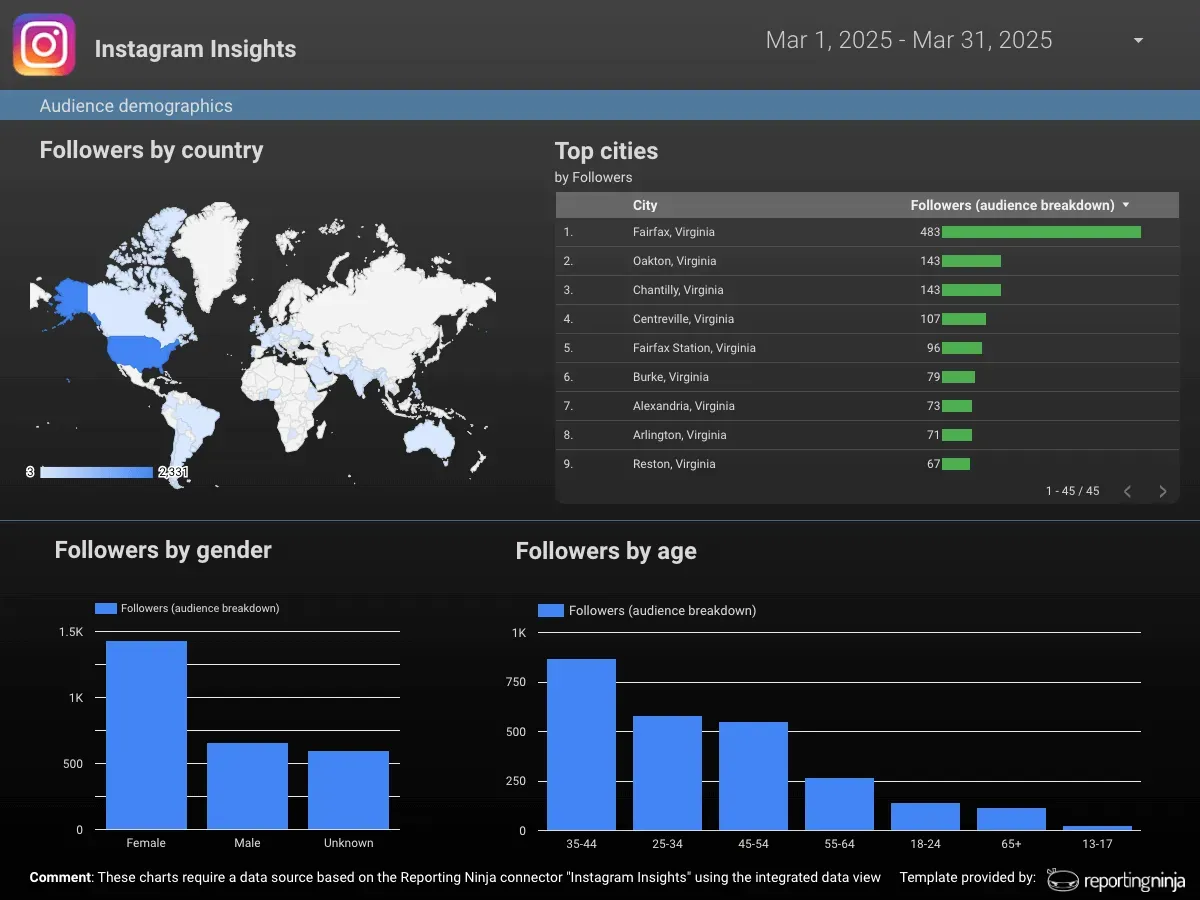
With Instagram Insights templates, you can quickly create reports that highlight engagement wins, helping clients see where their message is connecting with the audience.
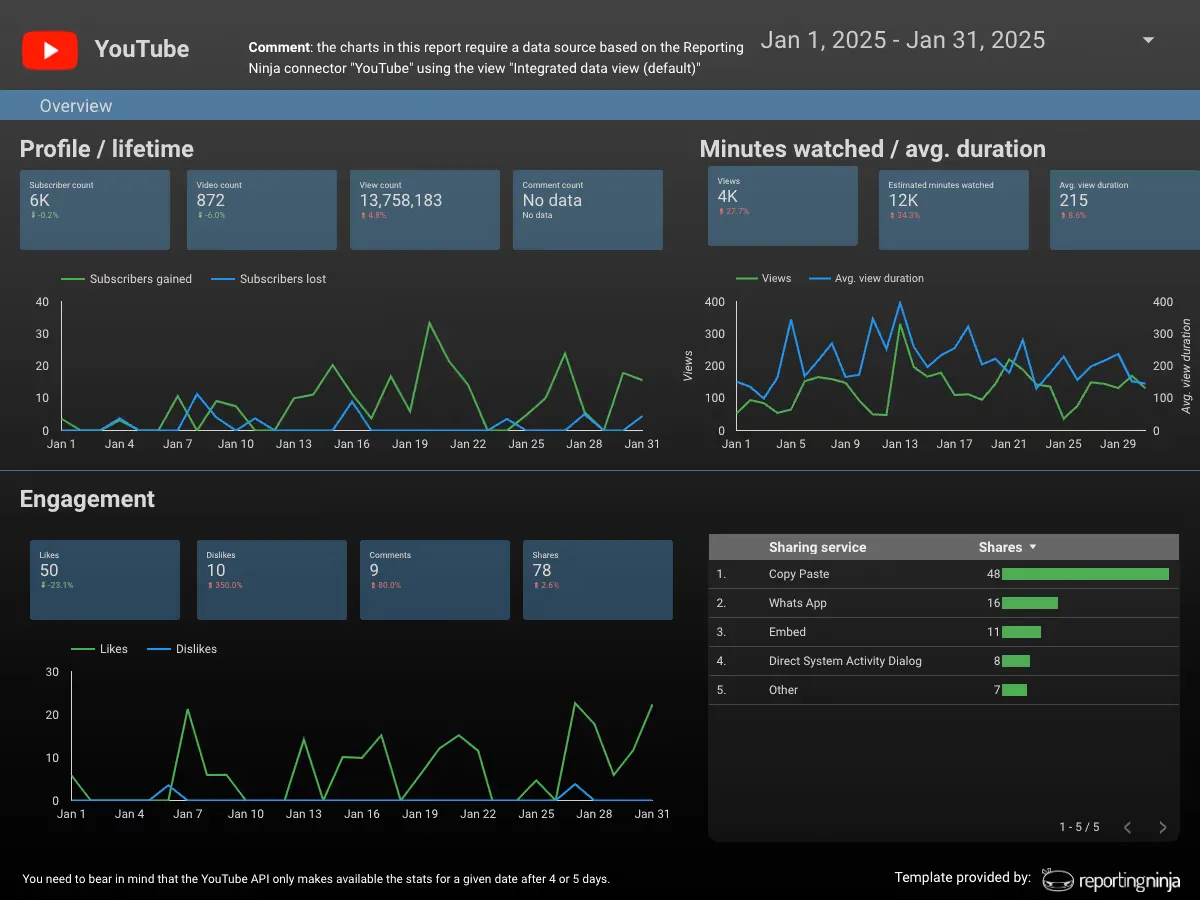
Awareness dashboards focus on reach, impressions, and follower growth. They’re essential when campaigns are designed to increase visibility rather than drive conversions. For example, using a YouTube template, agencies can present video views and subscriber growth in a format that proves the brand is building recognition.
Paid dashboards track spend, conversions, and ROI across ad platforms. They’re vital for showing clients how budgets translate into results.
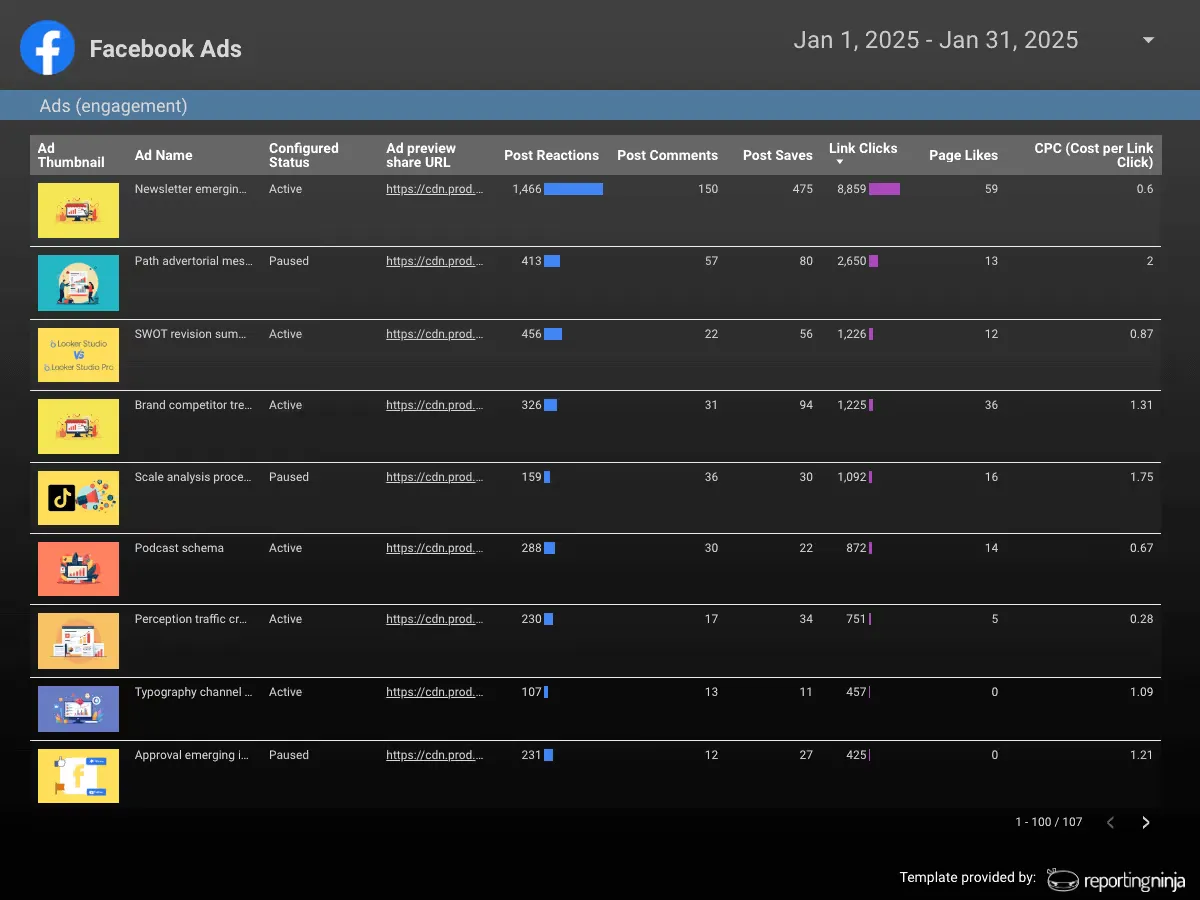
An agency might use a Facebook Ads template or a Reddit Ads dashboard to compare campaign performance and reveal which ads generated the best cost per conversion. Following proven Reddit Ads best practices makes it easier to optimize spend mid-campaign and ensure you are effectively tracking PPC results alongside your organic social growth to prove that all ad investments are paying off.
For inspiration and benchmarking, marketers also review Reddit ads examples to understand how different formats, hooks, and messaging styles perform in real-world paid campaigns.
When clients run campaigns across several networks, a multichannel dashboard is the only way to see the big picture. Agencies use it to spot patterns, such as LinkedIn generating higher-value leads while Instagram drives stronger engagement.
Reporting Ninja supports connecting multiple sources like Google Analytics with social accounts, creating unified reports that show how each channel contributes to total performance.
Decision-makers don’t want endless charts; they want clarity at a glance. An executive dashboard summarizes KPIs like total reach, engagement rate, and conversions in a polished, branded view. Agencies often use these in quarterly reviews to demonstrate ROI and secure budget approval.
Well-chosen dashboards help agencies and freelancers tell the right story for every campaign. Whether it’s proving ROI, highlighting brand growth, or showing which posts hit hardest,
Reporting Ninja’s templates save time and give you reporting clients trust.
Browse the full range of Looker Studio templates here.
Dashboards are only as useful as the metrics they include. The right mix of KPIs not only shows what happened but also connects performance to client goals. Here are the five categories worth tracking.
Likes, comments, shares, and click-through rates reveal how audiences interact with your content. High engagement shows your message resonates and helps identify posts worth boosting with paid spend. Agencies use engagement dashboards to prove community-building efforts are working and to guide clients toward formats that generate the most meaningful conversations.
Follower count, reach, and impressions track how your audience is expanding over time. These numbers tie directly to brand awareness campaigns, showing whether content is attracting new people while keeping existing audiences engaged. For example, a steady rise in follower growth rate proves visibility is increasing, a metric most clients want to see.
Sign-ups, downloads, and sales link social performance to business results. Tracking conversion rate, cost per conversion, or revenue from ads provides hard evidence of ROI. Agencies rely on this category to show clients that social isn’t just driving likes, it’s delivering leads and sales that support the bottom line.
Metrics like top-performing posts, average watch time, and best publishing times highlight what works best. This helps optimize posting schedules and allocate resources toward formats that deliver results. For instance, an agency may show that short-form video drives higher completion rates than static images, proving where clients should invest creative effort.
Cost per click, cost per conversion, and return on ad spend reveal whether paid campaigns are profitable. Monitoring these KPIs ensures budgets are optimized and ad dollars go to the platforms delivering the best return. For example, analyzing reddit ads examples alongside Facebook or LinkedIn campaigns can reveal how audience intent and engagement differ across platforms.
Agencies use this to show clients which channels maximize ROI and where to adjust spend mid-campaign.
Together, these metrics give a complete picture of social performance—from how people engage with content to how campaigns deliver real business outcomes. By aligning each category with campaign objectives, agencies and freelancers can show clients not just numbers, but a clear story of growth, impact, and ROI.
See how agencies turn these paid metrics into clear client reports.
A good social media dashboard balances clarity with purpose. Always tailor the view to your audience—internal teams may need detailed breakdowns with campaign-level data, while clients usually prefer high-level summaries that tell a clear story.
Keep layouts simple by grouping related metrics, limiting charts to essentials, and using consistent colors and formats. This makes dashboards easier to scan and avoids overwhelming stakeholders.
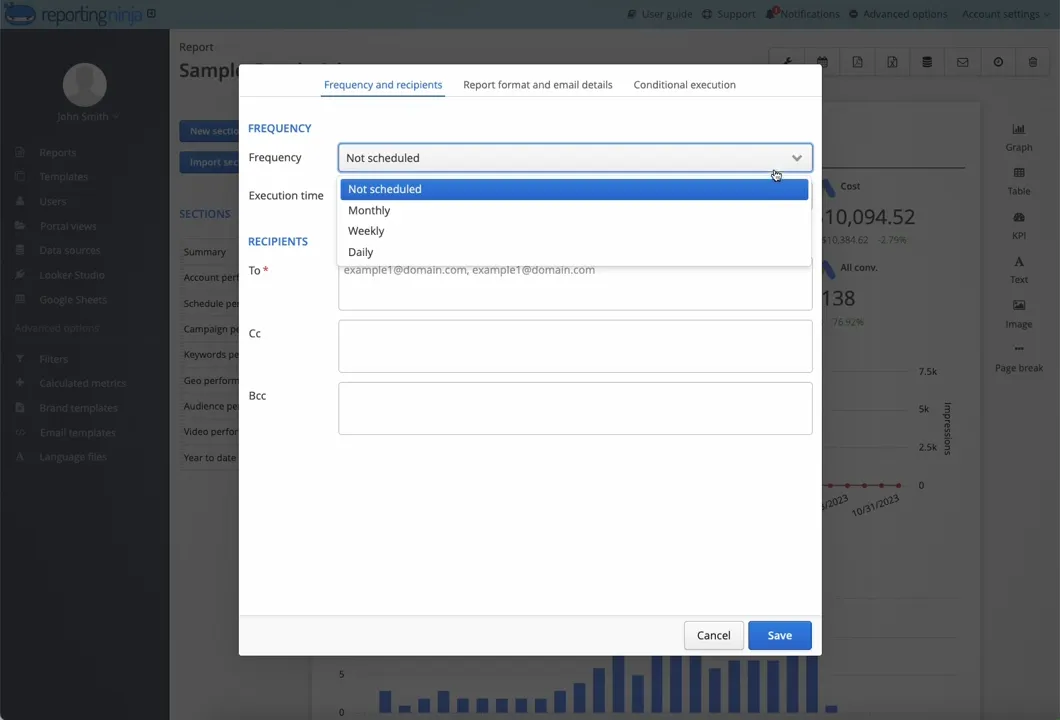
Automation is equally important. Manually exporting spreadsheets not only wastes hours but also risks errors. Tools like Reporting Ninja automate data collection and scheduling, so dashboards are always up to date. For agencies, white-label options add another layer of professionalism, letting you present polished, client-ready dashboards under your own brand.
Several tools can help build dashboards, but features, pricing, and ease of use vary. Here are four options to consider.
Reporting Ninja specializes in automated, white-label reporting for agencies and freelancers. Its pre-built templates for social media, SEO, and PPC let you create dashboards quickly without manual setup. Dashboards update automatically, saving hours of data collection.
The white-label feature allows you to brand reports with your logo and colors—ideal for client presentations.
Pricing is straightforward too, making it easier to scale reporting across multiple accounts without hidden costs.
{{cta-block-v1}}
Looker Studio (formerly Data Studio) is free and integrates well with Google platforms like Analytics and Ads. It’s flexible for custom reporting, but building dashboards takes time and technical skill. Non-technical users may find the setup challenging, and without built-in white-label options, it’s less ideal for agencies managing branded client reports.
DashThis offers user-friendly templates and strong support, making it a good choice for beginners. It simplifies dashboard creation, but pricing scales with the number of metrics dashboards, which can become costly for agencies. Customization is also limited compared to other platforms, which may restrict agencies that need more advanced or tailored reporting.
Klipfolio is known for its advanced customization and wide range of integrations, appealing to users who want full control over their reports. However, it demands more setup time and ongoing maintenance than template-driven tools. For smaller agencies, the complexity and resource requirements can outweigh its benefits.
If you’re an agency or freelancer, Reporting Ninja is built for you—automated updates, white-label branding, and clear pricing make it the most efficient way to deliver dashboards at scale. For larger in-house teams that want deep customization, Klipfolio or Looker Studio may fit. For smaller teams seeking simplicity, DashThis can work.
A social media dashboard should save time, prove ROI, and impress clients every reporting cycle.
Reporting Ninja does exactly that with automated updates, white-label branding, and straightforward pricing that scales with your agency.
Impress clients with dashboards that highlight wins and tell a clear story of growth. Start for free today.
Sign up for a 15 days free trial. No credit card required.

Build and automate amazing custom reports in a few clicks. Save time, be more productive, impress your clients.