Analytics
September 15, 2026
AI marketing analytics: a complete guide for marketing agencies



If you spend part of every reporting cycle moving numbers between Google Ads, Meta, and GA4 to answer one question, you have the problem AI marketing analytics solves.
AI marketing analytics uses machine learning to analyze that connected data automatically, flag unusual changes, compare periods, forecast performance, and write plain-language summaries.
CMOs already allocate an average of 15.3% of their marketing budget to AI, according to Gartner's 2026 CMO Spend Survey of 401 marketing leaders. That spending only helps if you know which tasks to give to AI and which decisions still need a human marketer.
This guide covers the core capabilities, the clearest use cases, the metrics to track, and what to check before you buy an AI analytics tool.
AI marketing analytics moves analysis closer to real time. Traditionally, you collect the data by hand, analyze it, explain the results, and decide what to do. By then the data can be several days old—and your plan of action outdated.
With AI, the system examines data as it arrives, identifies patterns and unusual changes, explains what moved, and produces forecasts. Google Analytics, for example, uses machine learning for automated insights, custom insights, and predictive metrics such as purchase probability and churn probability.
Four capabilities make this possible: automated data analysis, pattern and anomaly detection, performance forecasting, and AI-generated insights and recommendations.
Instead of exporting spreadsheets from each organic and ad platform and matching them by hand, AI systems pull data directly from connected sources and process it continuously. Manual matching is slow, and it is also where most reporting errors start.
Common errors include mismatched date ranges, duplicated conversions, and a campaign that was renamed partway through the period. Automated analysis removes the copy and paste step, so the numbers you review match what the source actually holds.
You get results faster, and you spend your time on the questions rather than on assembling the data.
AI models are good at noticing when a metric moves outside its usual range. Examples include a sudden CPA increase, a conversion rate that falls after a landing page change, or two campaigns competing for the same audience.
For example, Google Analytics Intelligence regularly evaluates property data and surfaces automated insights when metrics show unusual changes or emerging trends. It also supports custom insights that you configure around conditions that matter to your business, with optional email alerts.
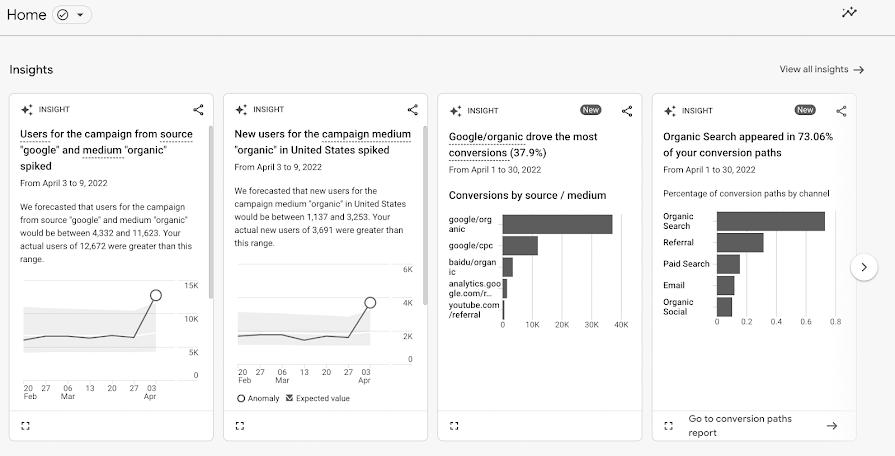
Source: Google
This means you find a problem that is wasting budget on day two rather than at the end of the month. But remember, an anomaly is a signal to investigate, not always proof of a cause.
Forecasting uses historical performance data to project what a campaign or channel is likely to do next. LinkedIn's Campaign Manager, for instance, estimates reach, impressions, and cost per result before your campaign launches.
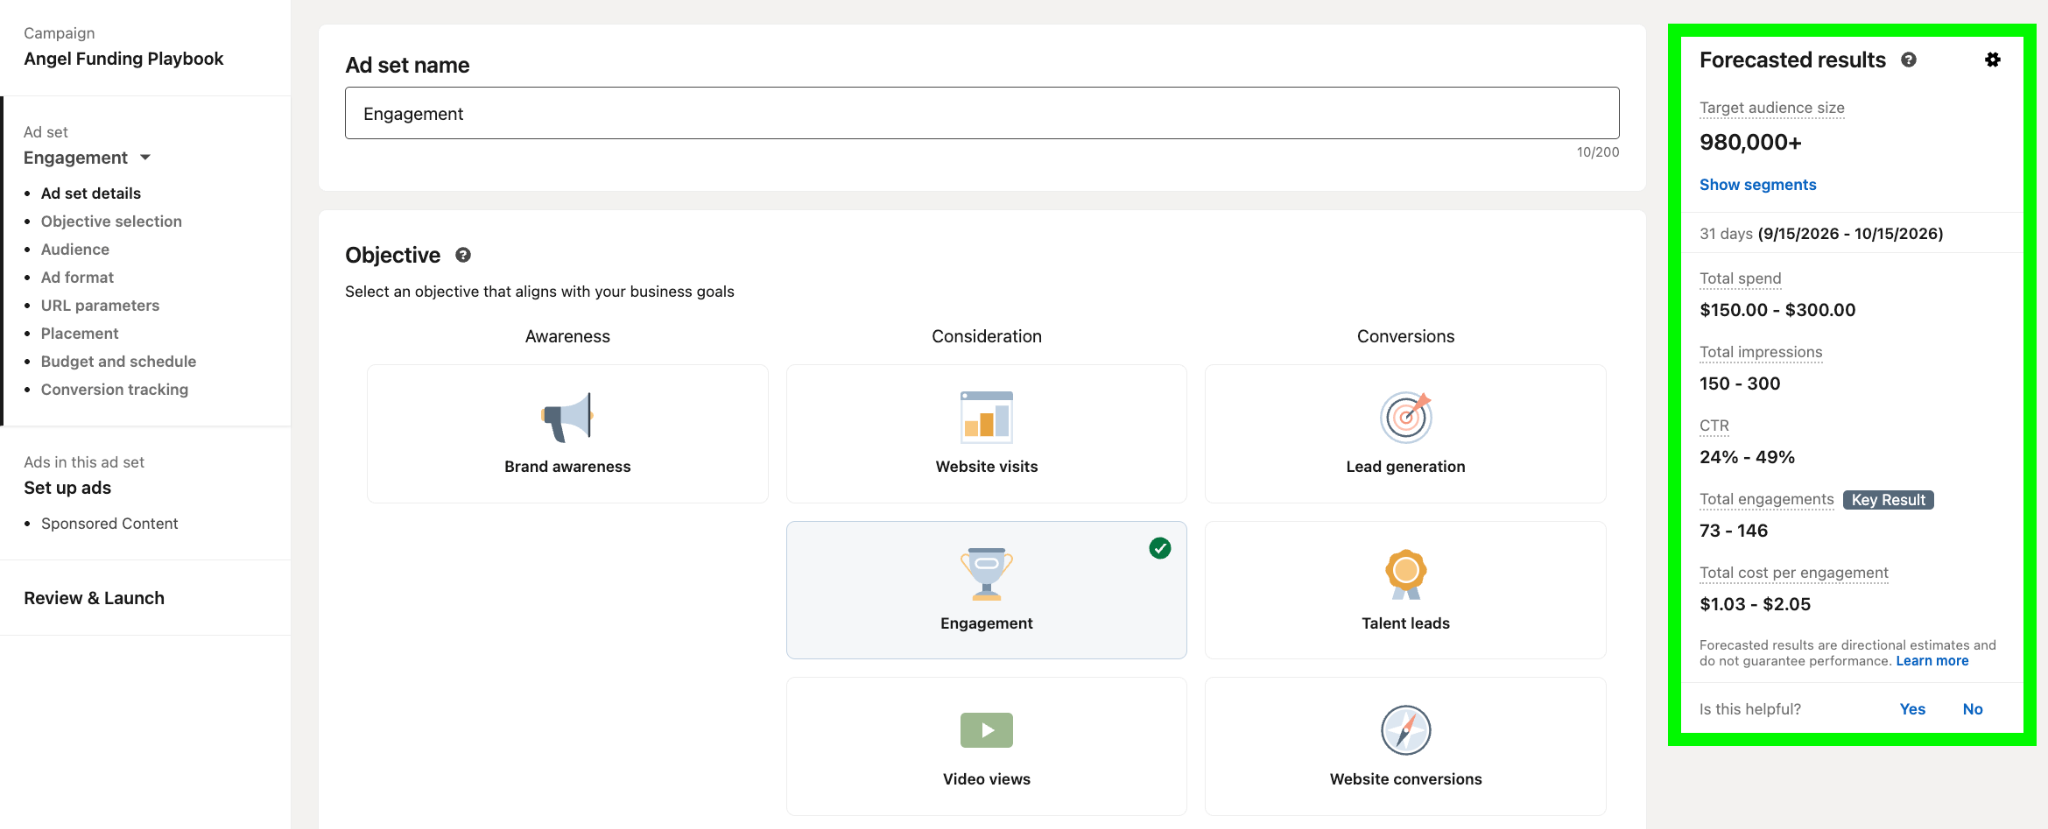
Planning then starts from an estimate based on past data rather than a guess. The forecast does not guarantee an outcome. Instead, it gives you a number to measure actual performance against.
The fourth capability turns the analysis and the forecast into a written explanation of what happened and what to do next. A chart shows you a number. This output reads more like what an analyst would tell you in a meeting.
The value depends heavily on data quality, which is why later sections cover how to keep that input clean.
{{cta-block-v1}}
These four use cases cover the situations marketing teams meet most often. Each one needs connected data from several channels to be useful.
Goal: You want to move budget toward the campaigns, ad groups, or audiences that drive conversions, without waiting for a weekly manual review.
How AI helps: AI bidding and budget systems evaluate performance signals continuously and reallocate spend automatically.
What data it uses: They draw on historical spend, conversion, and bid data from the platform itself, weighed against account goals such as target CPA or ROAS.
Outcome it improves: Google reports that advertisers who turn on AI Max for Search typically see 14% more conversions or conversion value at a similar CPA or ROAS. The figure reaches 27% for campaigns still using mostly exact and phrase match keywords. You can test that on one account before applying it across a client roster.
Goal: Attribution becomes difficult when several channels contribute to the same conversion. You want to know which channels contribute and which ones happen to receive the last click.
How AI helps: Machine learning models weigh each touchpoint in a customer journey by its actual contribution.
What data it uses: They use multi-touch journey data from ad platforms, website analytics, and CRM records, combined into one view rather than compared platform by platform.
Outcome it improves: Last-click reporting gives all the credit to the final touch, so platforms often claim conversions that would have happened anyway. Correcting for that changes how you split budget, especially for the early-funnel channels that last-click reporting undervalues. Choosing an attribution model and running cross-channel attribution properly is what makes that correction possible.
Goal: You want to reach the people most likely to convert, without building and testing audience segments one by one.
How AI helps: AI can analyze your best-converting audience to uncover the behavioral and firmographic patterns that signal a high likelihood of conversion. They then identify new users who share those traits.
What data it uses: Predictive targeting models analyze first-party customer lists, CRM data, and platform engagement history.
Outcome it improves: LinkedIn reports that early tests of Predictive Audiences with lead generation objectives produced a 21% lower cost per lead. For a B2B agency, that is the same lead volume for less budget. The caveat? The model needs enough conversion history before you see that result.
Goal: You want an accurate, current view of performance across every connected channel, without assembling it every week.
How AI helps: With Reporting Ninja's AI reporting features, you describe the marketing report you need in plain English. The system proposes the sections, widgets, and data sources and then builds the report for you automatically. The best part is that nothing is created without your approval first.
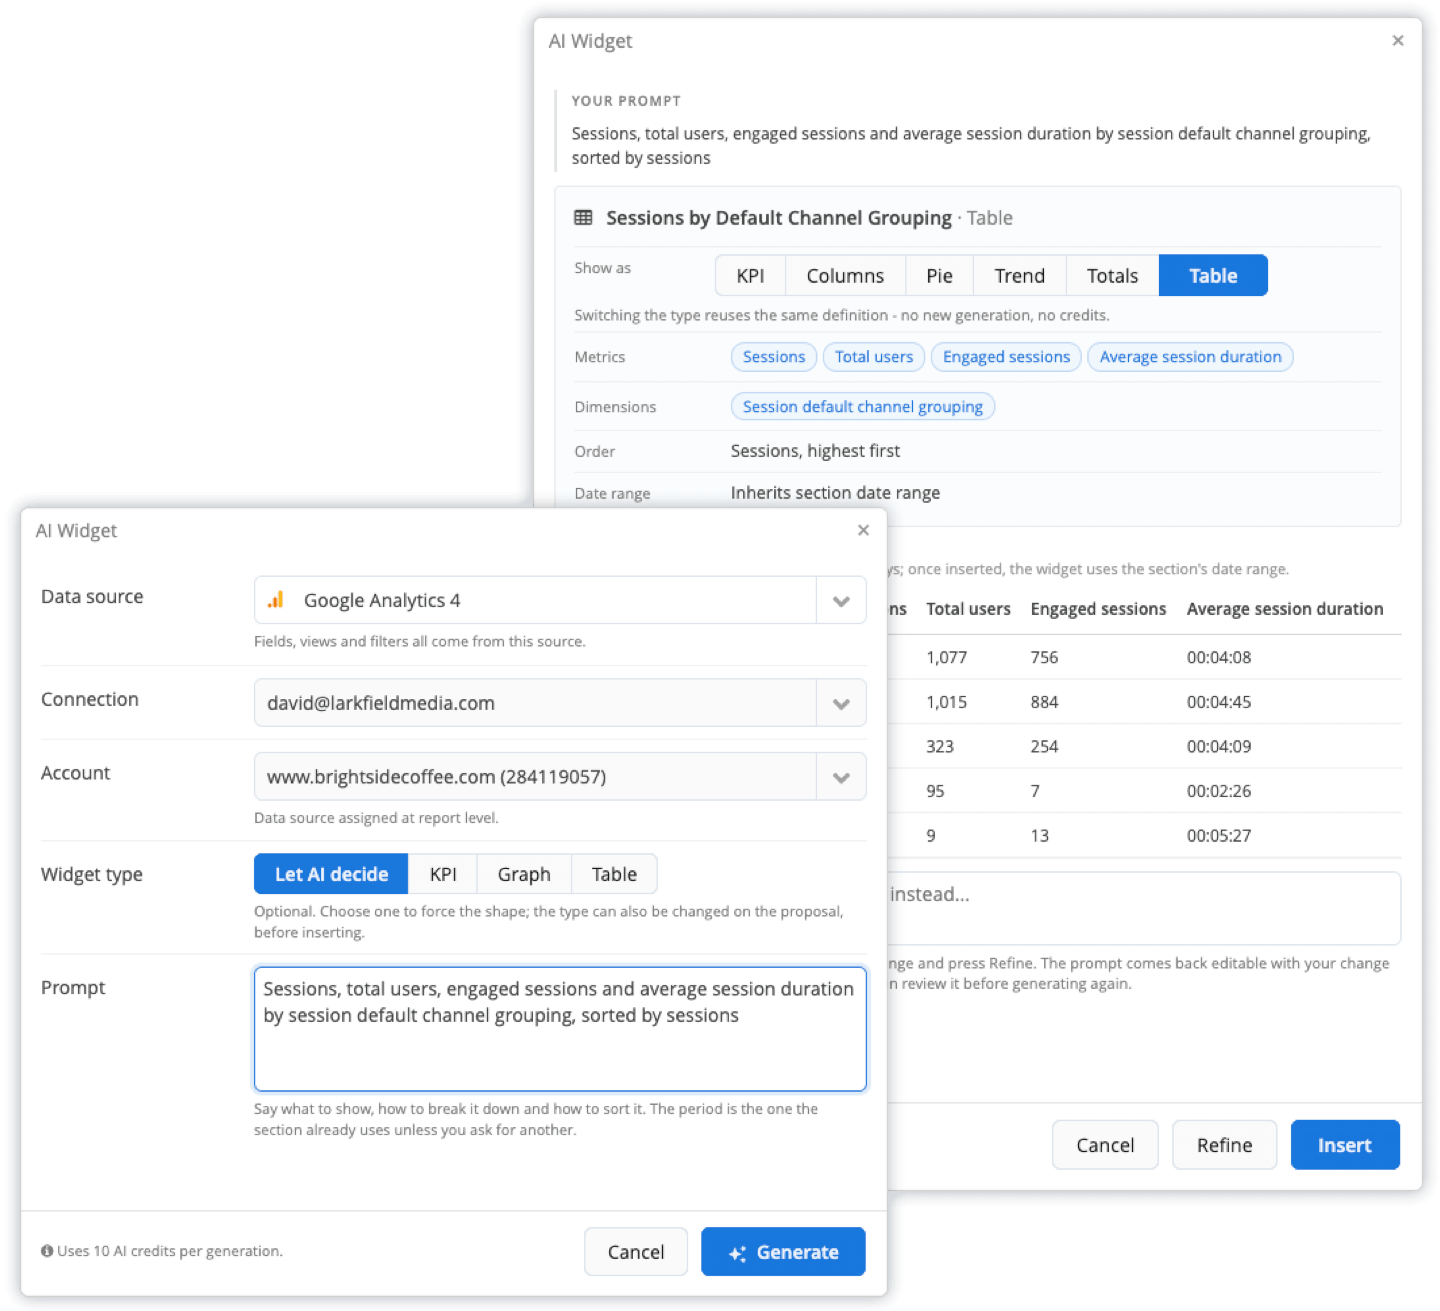
What data it uses: AI-assisted reporting can combine connected sources such as Google Ads, Meta Ads, GA4, and LinkedIn Ads into one report and write the analysis alongside it. You can also use it for platform-specific reports.
Outcome it improves: You spend less time assembling reports, and client reports stay consistent from month to month. That consistency matters most for cross-channel marketing reporting, where the same accounts have to appear the same way every cycle.
Reporting Ninja brings your connected channels into one report and drafts the analysis with AI. Start your free 15-day trial and build your first report, ten times faster than you used to.
Judge AI marketing analytics by the same business outcomes you use for any other marketing effort. How much data it processes and how advanced its model sounds are not useful measures.
A tool that produces detailed dashboards but does not improve CAC, ROAS, or revenue is not worth paying for, whatever the sales page says. The table below covers the metrics marketing teams actually use to make decisions, grouped by funnel stage, plus a few AI-specific measures worth tracking separately.
A live metrics dashboard makes it easier to catch a metric moving outside its normal range, rather than finding it during a monthly review. Knowing the difference between KPIs and metrics also matters here, because not every number on this list deserves equal weight in every report.
AI output becomes more useful when the underlying data and the decision process are clear. The following practices improve the quality, accuracy, and usefulness of that output.
AI models do not distinguish between good data and bad data, instead processing whatever they are given. If your UTM naming is inconsistent, your conversion tracking has gaps, or the same lead appears twice in your CRM, the model builds its recommendations on those errors.
Before turning on any AI feature, audit your tracking setup. Confirm conversion events fire correctly, standardize naming conventions across campaigns, and remove duplicate records in your CRM.
This is not a one-time task. Set a recurring schedule, monthly for most accounts, to confirm nothing has changed since your last audit.
AI bidding systems need a target to work toward. If you turn on automated bidding without a defined CPA or ROAS goal, the system chases whatever default objective it was given. That objective may not match what your business needs this quarter.
Write down the specific outcome you want before enabling any AI feature. Decide whether the goal is a lower CAC, more leads, or protected margin on high-value customers.
Each of those goals needs a different configuration. Skipping this step is one of the most common reasons AI-driven campaigns underperform.
Treat AI-generated recommendations as the start of a decision, not the decision itself. A forecasting model does not know that your biggest client just signed a new contract, or that a competitor is running a promotion that is holding down your conversion rate.
Spot-check AI recommendations against what you know about the account before you implement them, especially for large budget shifts. Most of the time a quick review is enough to catch the recommendations that ignore real-world context.
An AI model can tell you that conversions dropped 20% last week. It generally cannot tell you the drop coincided with a site migration, a pricing change, or a planned pause in spend.
Only your team knows that context, because it is not recorded in the data. When you review AI-generated insights, pair them with a short internal log of campaign launches, landing page updates, and pricing changes.
This turns a raw number into an explanation, which is what helps you make the next decision. It also makes your marketing reports far more useful to anyone reading them who was not in the room when the change happened.
AI models trained on historical data drift as market conditions change. That drift can come from a shift in customer behavior, a platform algorithm update, or your own account outgrowing the data the model learned from.
Set a recurring check, quarterly for most teams, comparing AI forecasts and recommendations against actual outcomes. If accuracy has dropped, retrain the model, adjust its inputs, or pause automated actions until you understand why.
Good data visualization makes this comparison easier to read than a raw export.
AI marketing analytics solves real problems on one hand, and on the other, it introduces its own risks. The table below covers the practical challenges marketing teams meet, and what to check or change to reduce each one.
{{cta-block-v1}}
The considerations below cover what matters most when choosing a tool, along with where Reporting Ninja fits and where you may need a different type of tool.
If your clients run Google Ads, Meta Ads, GA4, LinkedIn Ads, and a CRM or email platform, check whether the tool connects to those sources without forcing a new workflow. A tool with AI features but few integrations leaves you exporting data by hand anyway.
Reporting Ninja connects to the ad, analytics, and social platforms most marketing teams report on, so it covers the common agency stack.
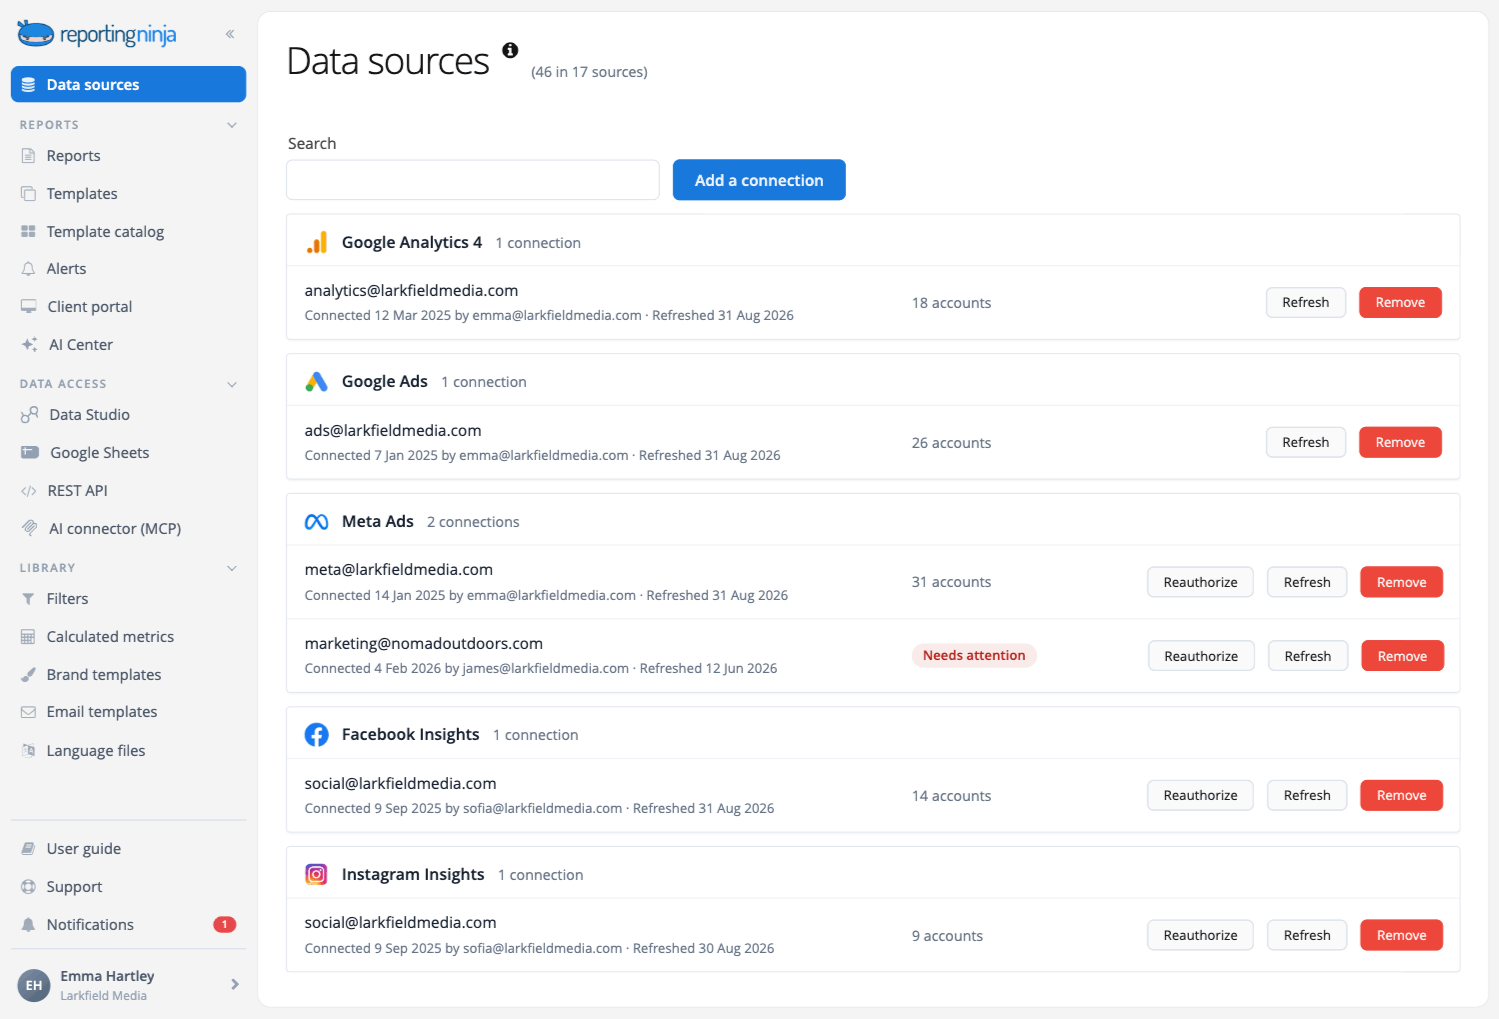
Explore Reporting Ninja’s integrations to get started!
Beyond individual integrations, check whether the tool can combine data from several sources into a single view rather than showing a separate dashboard per platform. This is what makes cross-channel attribution and blended CAC calculations possible.
Reporting Ninja's custom reports platform is built around this. It pulls connected accounts into one report so you do not compare browser tabs.
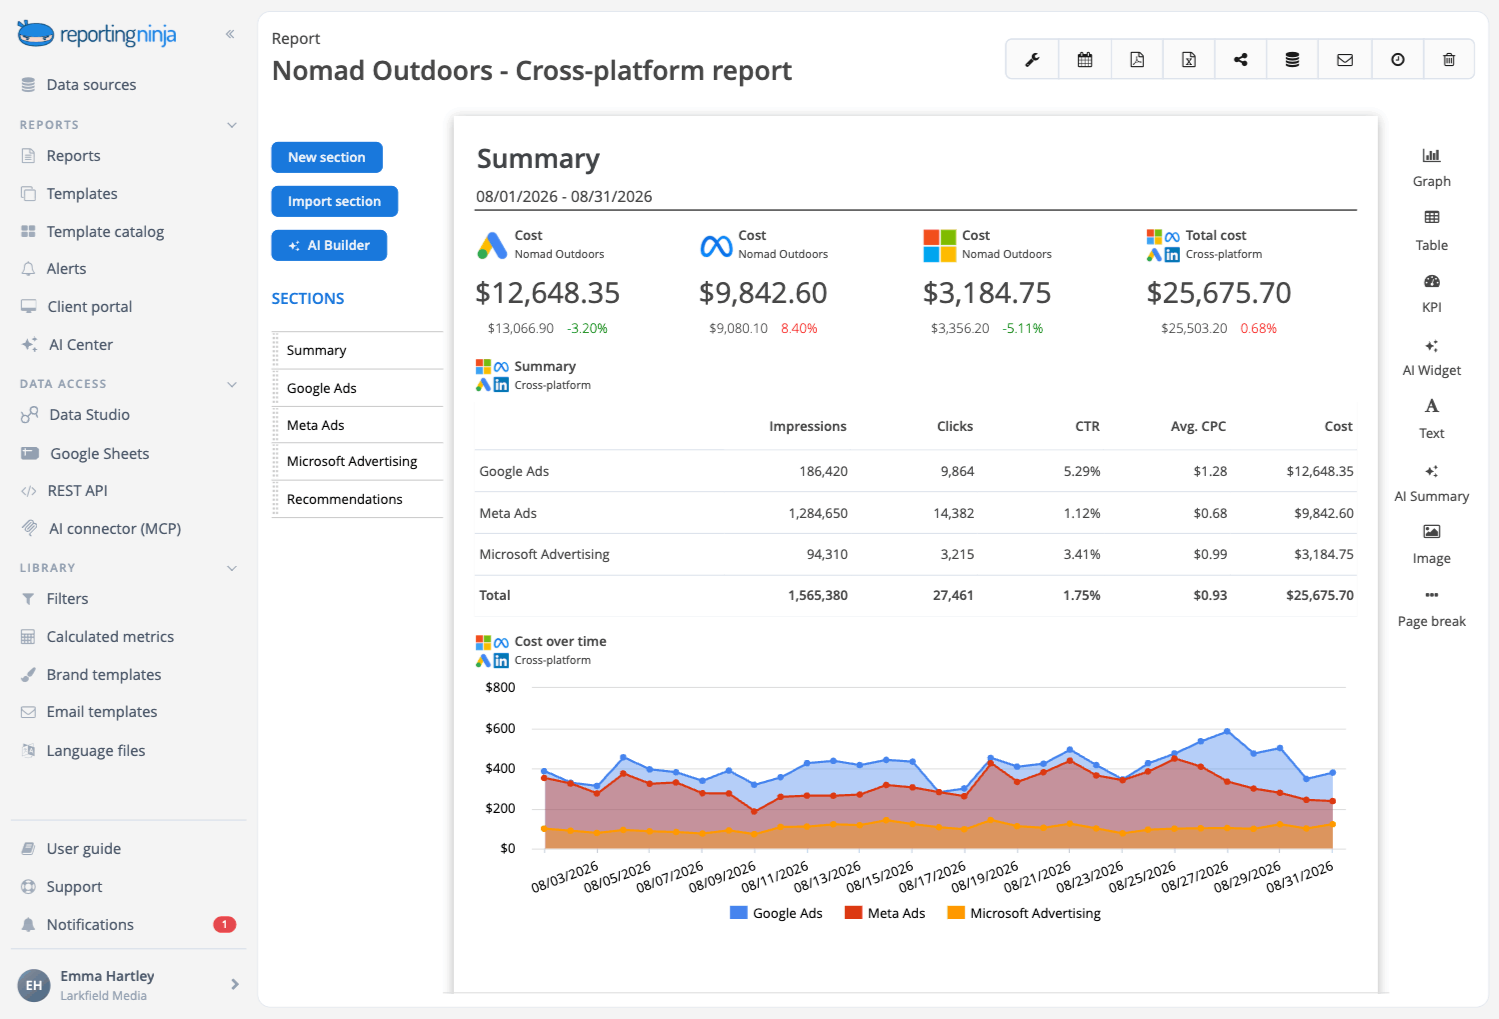
Check what the AI does with your data once it is combined. Some tools only chart it. Others write an explanation of what changed and why.
Reporting Ninja's AI reporting features include three specific functions:
All three are available across Reporting Ninja plans and the free trial. AI usage runs on a credit allowance, and the AI Center shows the cost of each action.
Check how much manual work is left after the data is connected. Some tools make you build every widget by hand, and some make you apply client branding to each report yourself.
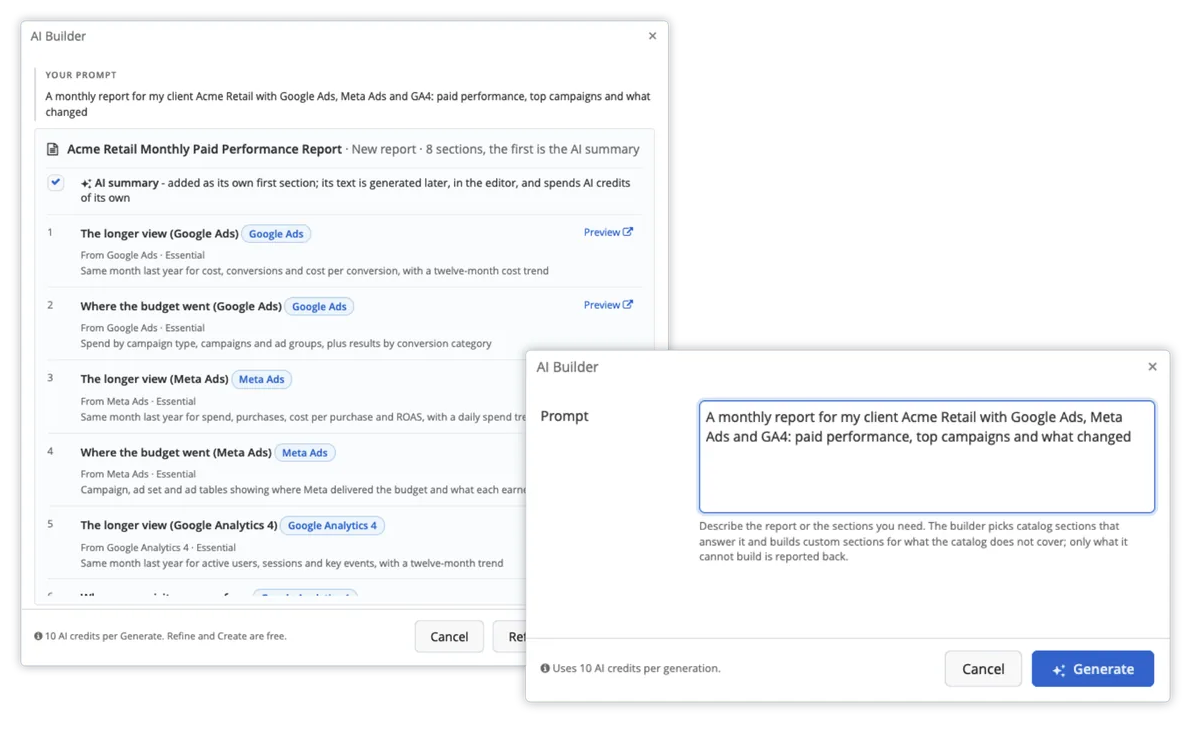
With Reporting Ninja's AI Builder, you describe the report you need in plain English. It proposes the sections, widgets, and data sources for your approval before anything is created.
Check whether reports can run and deliver on a schedule, rather than needing someone to generate and send them every time. Reporting Ninja supports scheduled reports across its formats, and its AI Widget lets you request a specific chart on demand instead of waiting for the next run.
This matters most for agencies, because the same reporting process repeats across many clients. A tool that saves 30 minutes per report makes a measurable difference once that process runs dozens of times a month.
Check whether the tool grows with your account list without a steep cost increase or a rebuild every time you add a client. It is also worth knowing where a reporting-focused tool stops being the right fit.
Heavy statistical modeling, media mix modeling, and enterprise data warehousing are better handled by a dedicated BI platform. Reporting Ninja covers combined, automated reporting with AI assistance built in. It is not built for teams running custom statistical models.
No single model is better for everyone. A freelancer with several client accounts may prefer predictable per-client pricing. A team with fewer clients and many connected sources usually pays less under an account-based model like Reporting Ninja's.
You can compare your current setup against automated reporting tools and software and the wider set of digital marketing agency tools before deciding.
{{cta-block-v1}}
If you are still moving numbers between separate dashboards every month, Reporting Ninja can bring those accounts into one report. Connect each account once, and the report updates from the same sources every cycle.
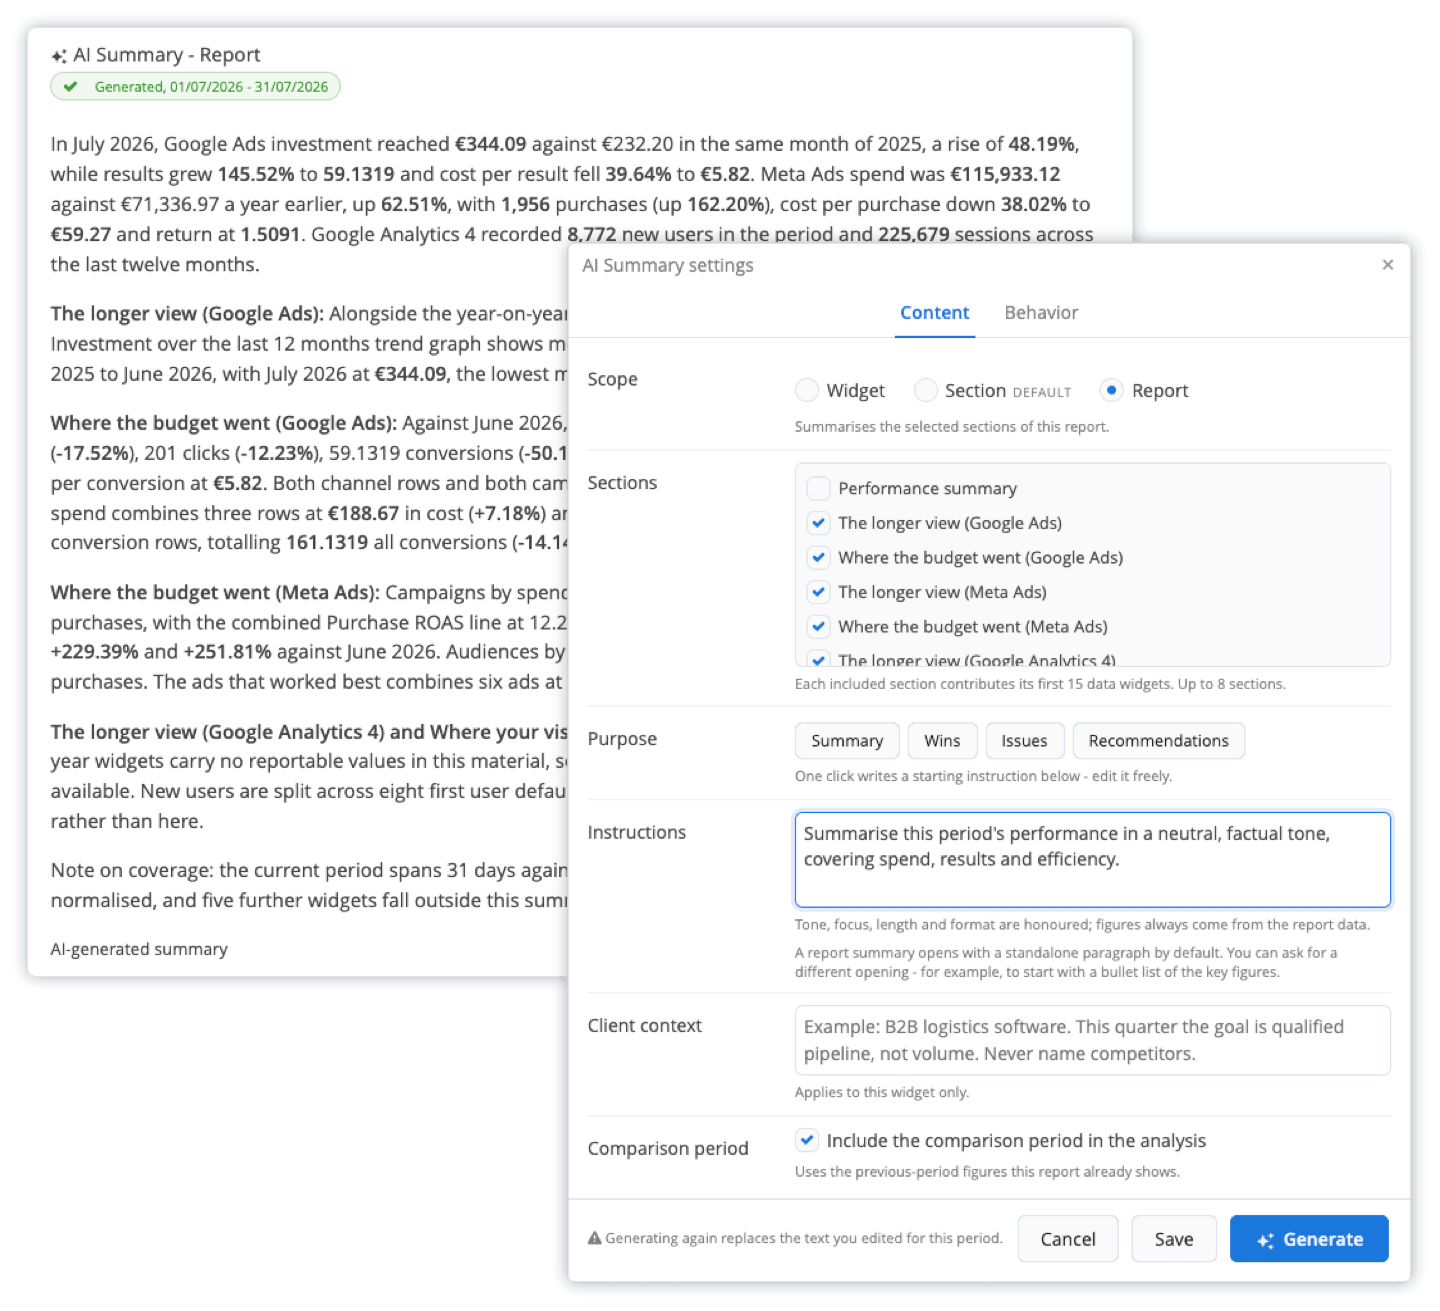
AI Builder, AI Widget, and AI Summary handle the report structure, the individual charts, and the written analysis respectively. You review and approve each one before it reaches a client.
Plans start at $20 per month billed annually, and every integration and AI feature is included on every plan. Start your free 15-day trial with no credit card required.
AI marketing analytics is the use of machine learning to collect, analyze, and interpret marketing data automatically, producing patterns, forecasts, and recommendations with little manual input.
Yes. Small businesses can use AI marketing analytics through features built into platforms they already use, such as Google Ads or Meta Ads, without a data science team.
It depends on data quality and volume. Accuracy improves with clean, consistent data and enough historical performance for the model to learn from.
Yes, within limits. AI forecasting estimates likely outcomes from historical trends, but it cannot account for external events it has not seen data for.
Yes. Many AI marketing analytics tools connect to CRM platforms to combine ad performance with pipeline and revenue data for more accurate attribution.
Sign up for a 15 days free trial. No credit card required.

Build and automate amazing custom reports in a few clicks. Save time, be more productive, impress your clients.