Analytics
September 10, 2026
How to extract data in Looker Studio: a 6-step guide



If your Looker Studio report takes a long time to load, the data connection is usually the reason.
Looker Studio Extract Data creates a static snapshot of the fields you select. Your report then reads from that snapshot instead of querying the live source every time someone opens the page or moves a filter. Google's documentation states that this makes reports load faster and respond better to filters and date ranges.
This guide covers when to use Extract Data, how to set it up step by step, the limits you will run into, and the tools that handle the parts it does not.
One naming note before we start. Google renamed Looker Studio back to Data Studio in April 2026, so both names appear in this guide and across Google's own documentation.
Extract Data is not a default setting for every report. It helps in four specific situations: slow dashboards, aggregated sources you want to recombine, connectors on fixed refresh rates, and recurring reports that do not need current data.
A report with more than a handful of charts sends a separate query for each chart. That happens every time someone opens the page and every time someone changes a filter. With several people viewing the same report, the query volume grows quickly.
An extract removes that repeated querying. Google's performance documentation states that once an extracted data source exists, data requests from your report go to the snapshot and not to the underlying dataset.
Google Ads and GA4 arrive already aggregated, which limits how you can recombine their metrics. In a standard Analytics data source, for example, the Users metric is locked to Auto aggregation and you cannot change it.
Extracting from an aggregated dataset produces a disaggregated one. Google's documentation confirms that an extracted Analytics source lets you apply any available aggregation type. You get the speed improvement and more control over the numbers at the same time.
Live connections do not all behave the same way. Google's data freshness table shows that Google marketing and measurement products, including Google Ads, Search Console, and YouTube Analytics, refresh every 12 hours on a rate that cannot be adjusted.
Weekly client reports, monthly recaps, and historical trend dashboards rarely need data from the last hour. A daily or weekly extract with Auto update gives you fast load times and a defined dataset.
Reports that genuinely need current numbers should stay on a live connection. If you are still deciding which reports fall into which group, this guide to using Looker Studio covers how the connection types differ in practice.
{{cta-block-v1}}
Creating an extracted data source takes six steps. You pick the Extract Data connector, choose a source, select fields, narrow the data, set a name and a refresh schedule, then save. Here is the full process before we go through each step.
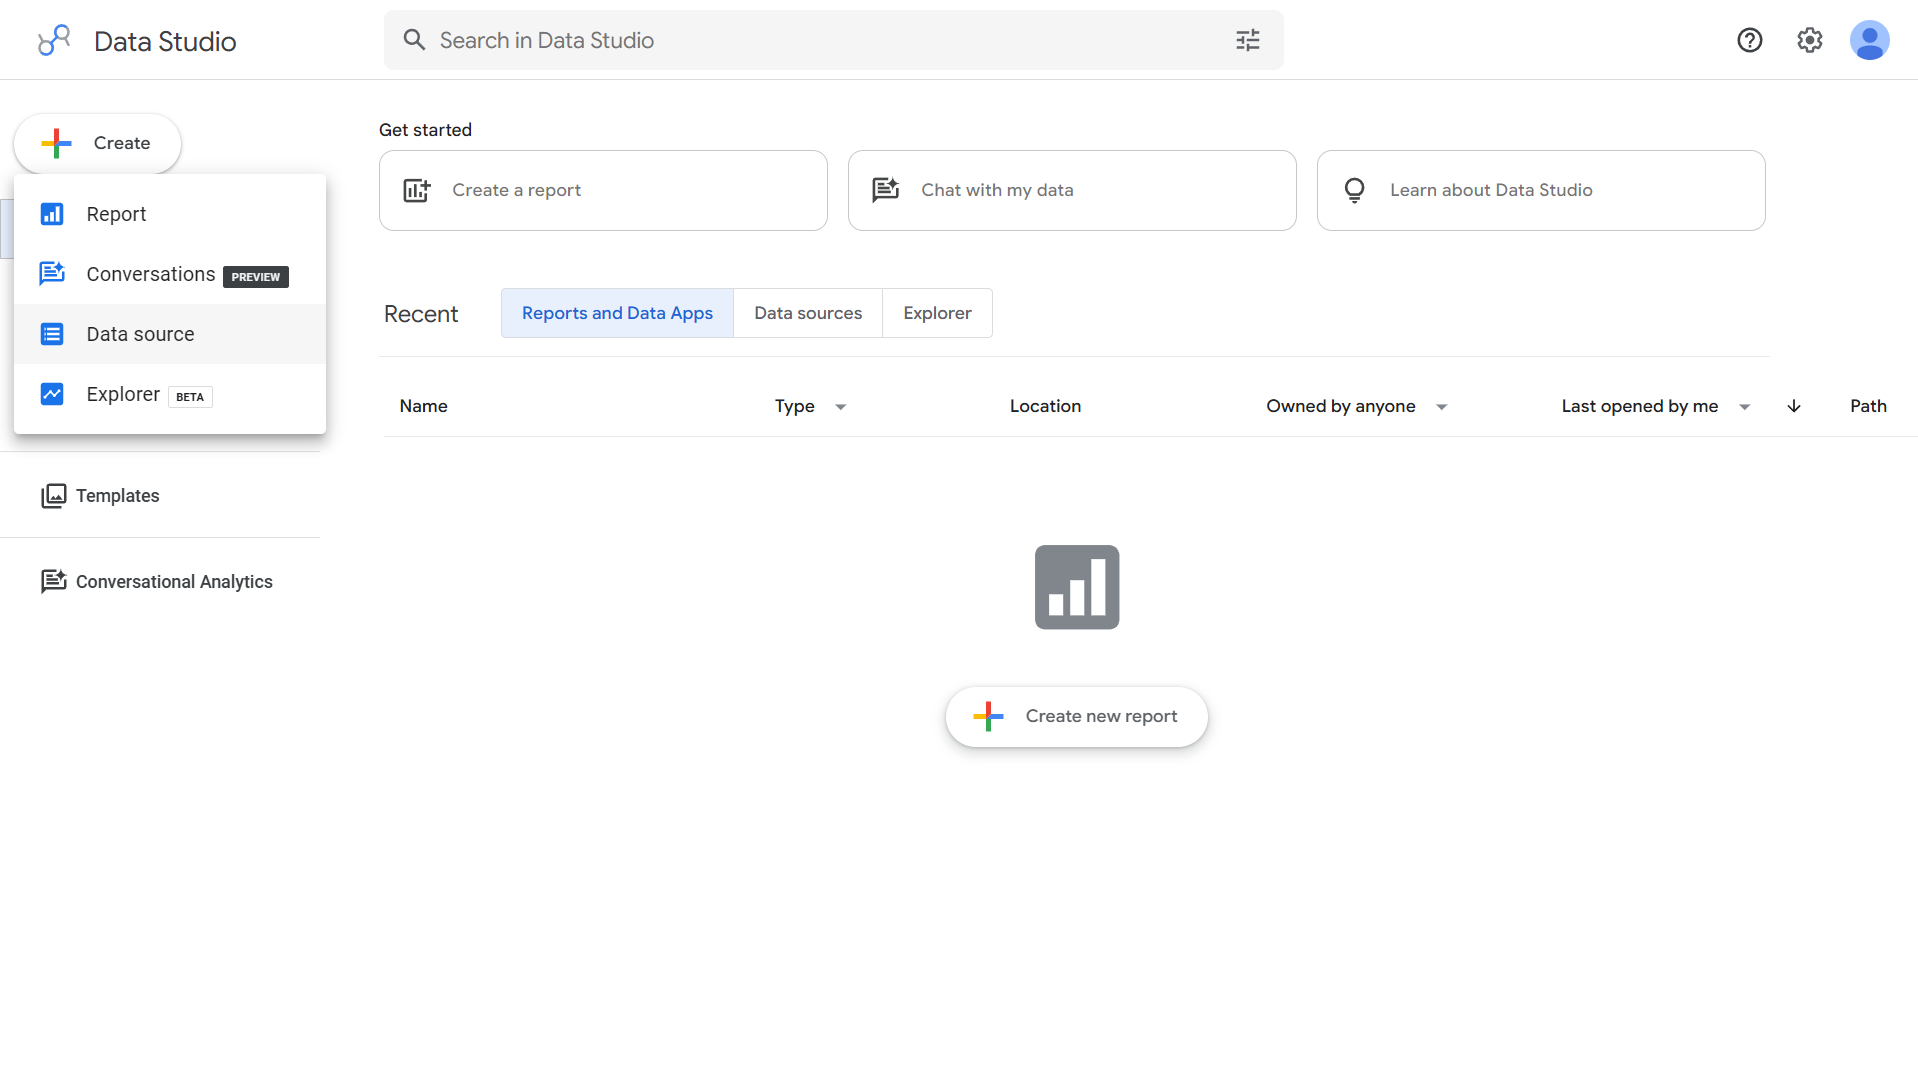
Sign in to Looker Studio. On the home page, click Create, select Data Source, then choose Extract Data from the connectors list.
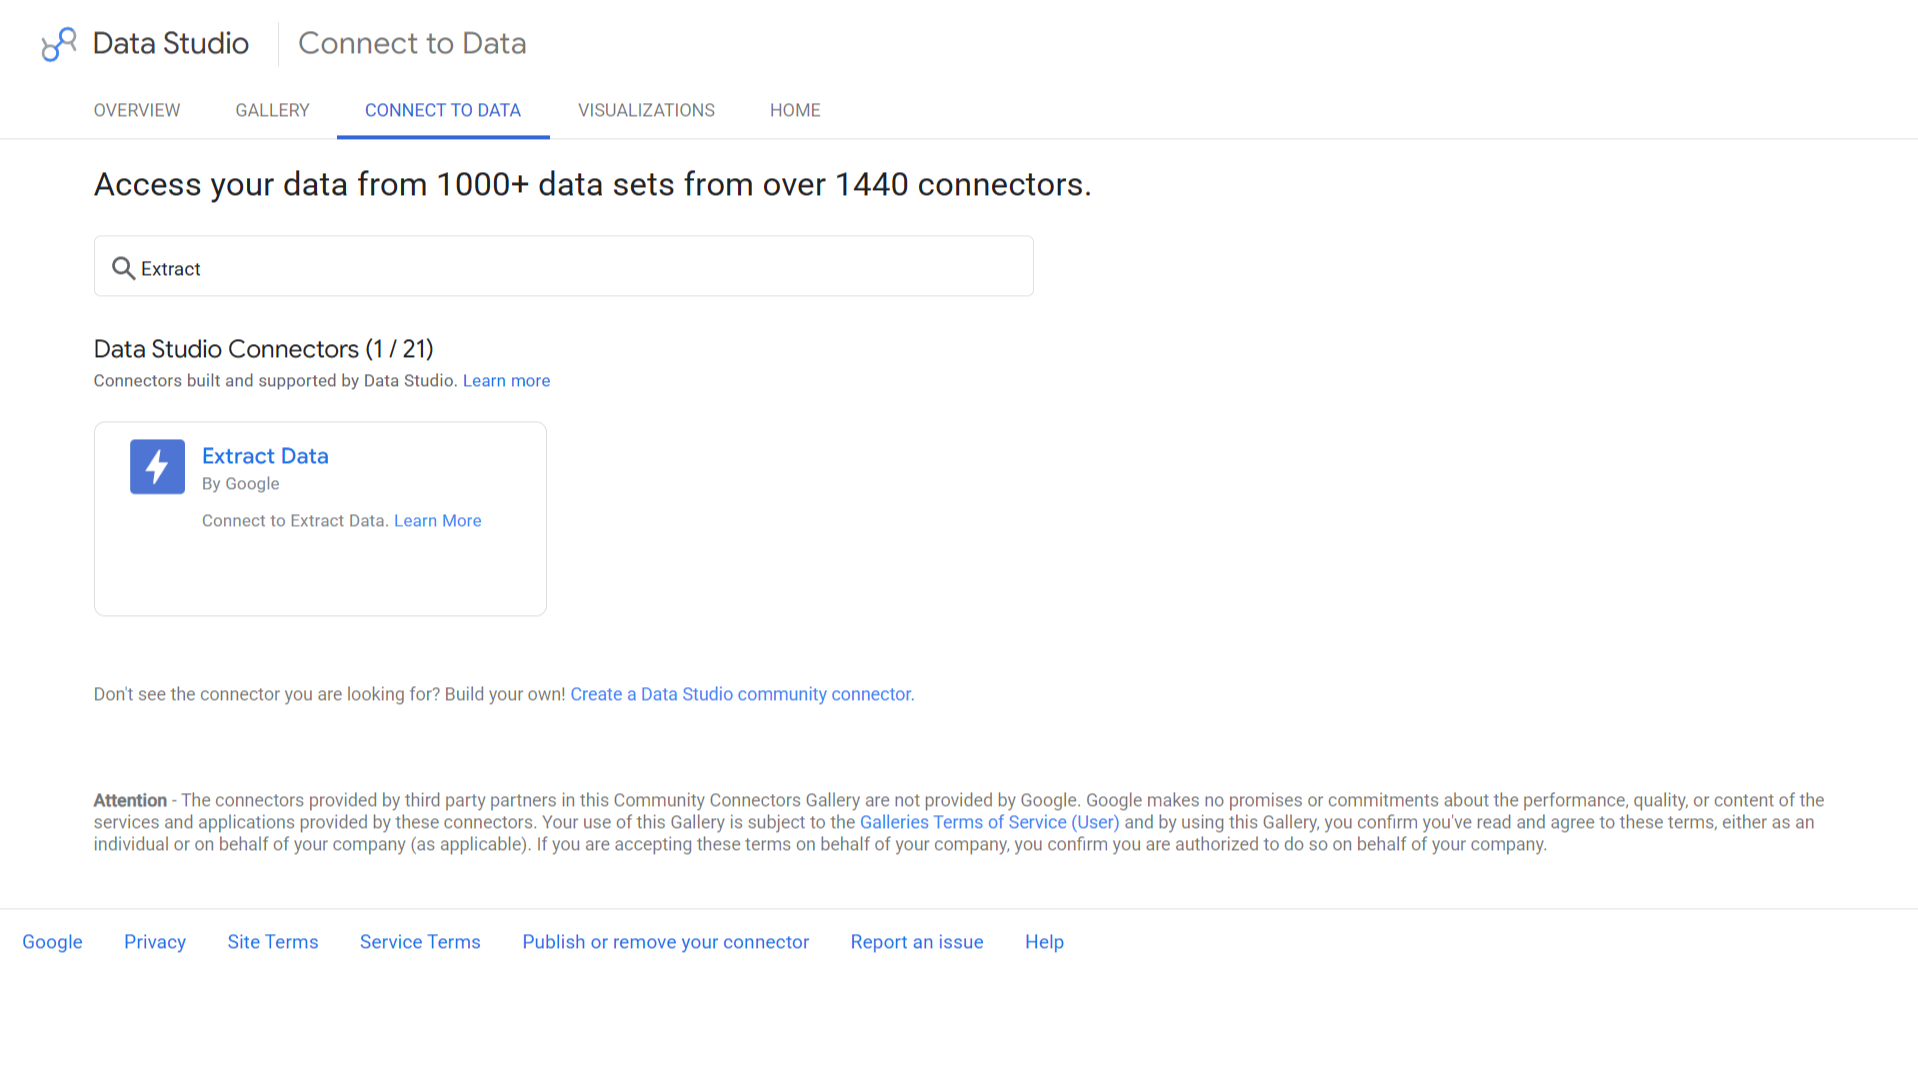
Extract Data is a separate connector type that produces a new data source once setup finishes. It is not a toggle inside a data source you already built.
Choose the live source you already have connected. That might be Google Ads, GA4, Google Sheets, or a third-party option such as Reporting Ninja's Looker Studio connectors.
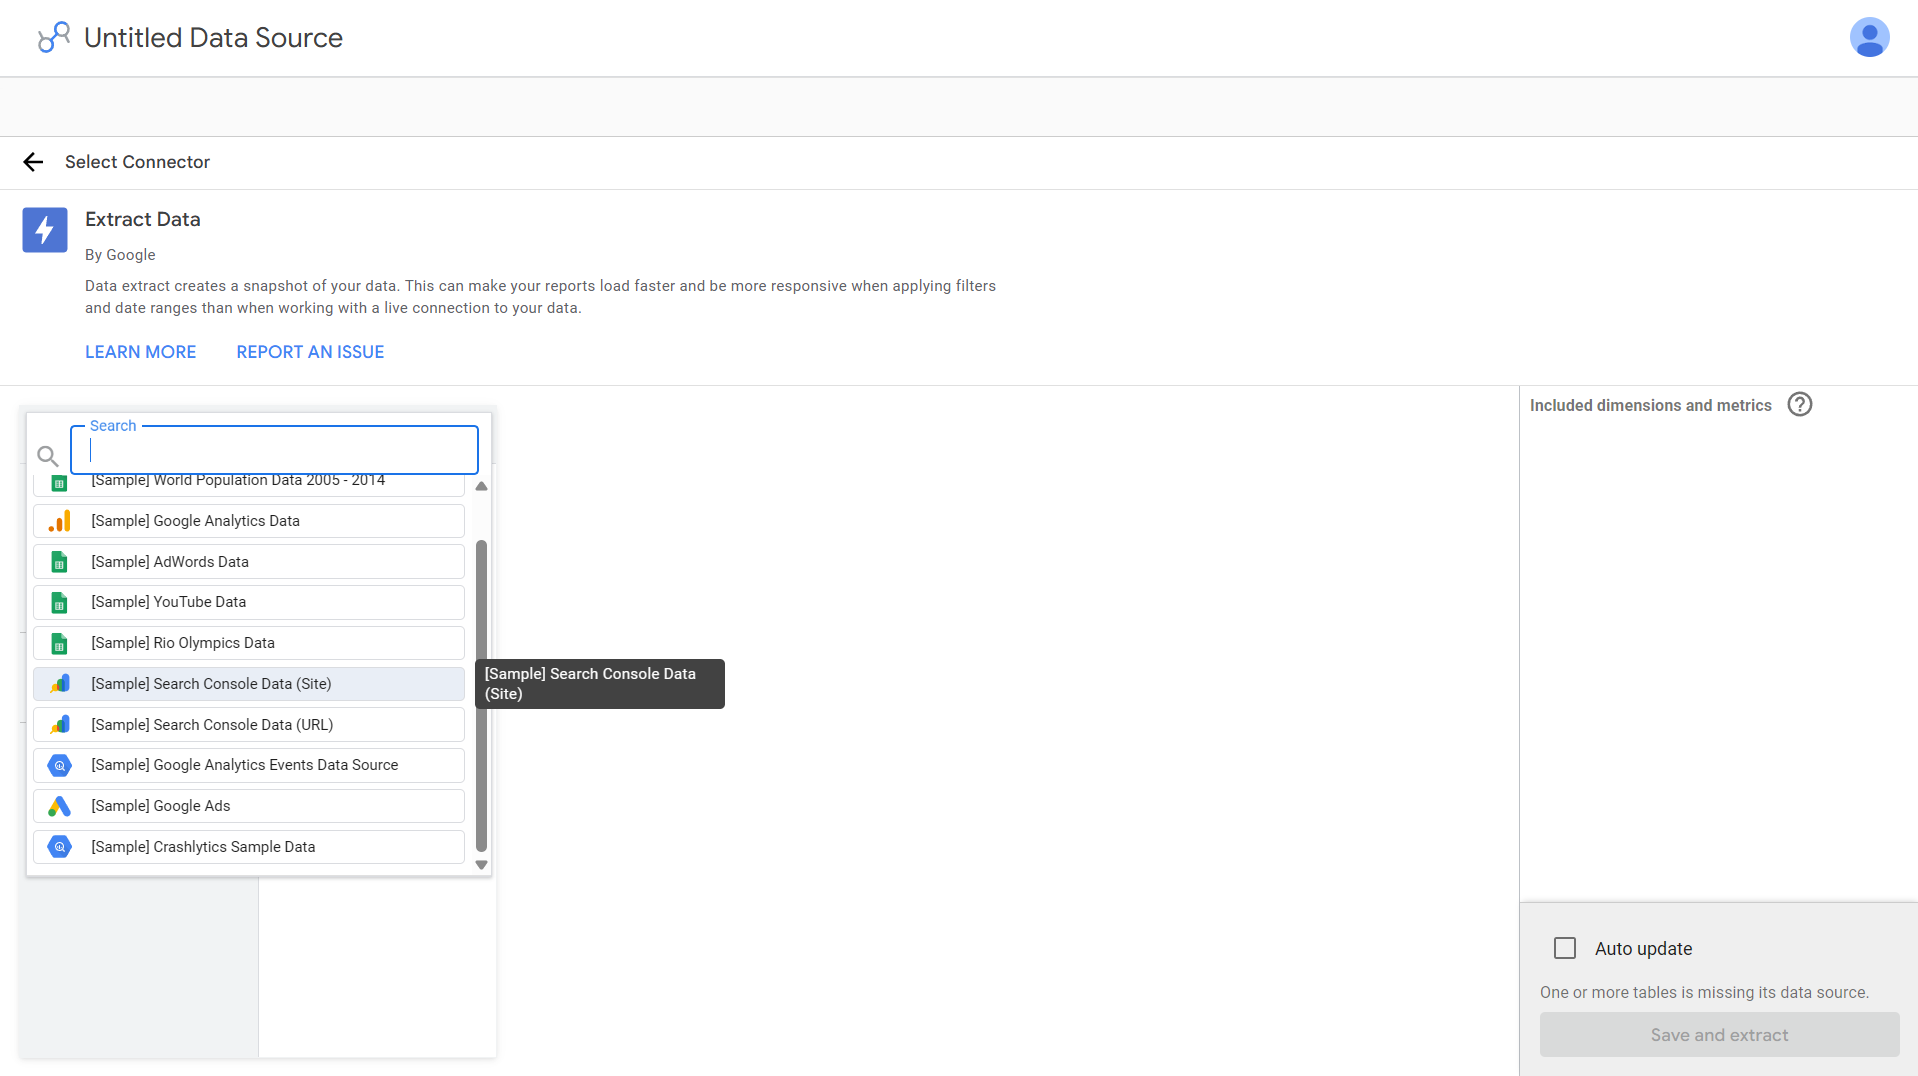
The extract can only be as good as the Looker Studio connectors behind it. Confirm that the source's credentials and permissions are current before you continue, because a broken connection here produces a broken extract.
Drag the fields you need from the Available Fields list onto the extract, or click Add. Every field you include appears in the list on the right.
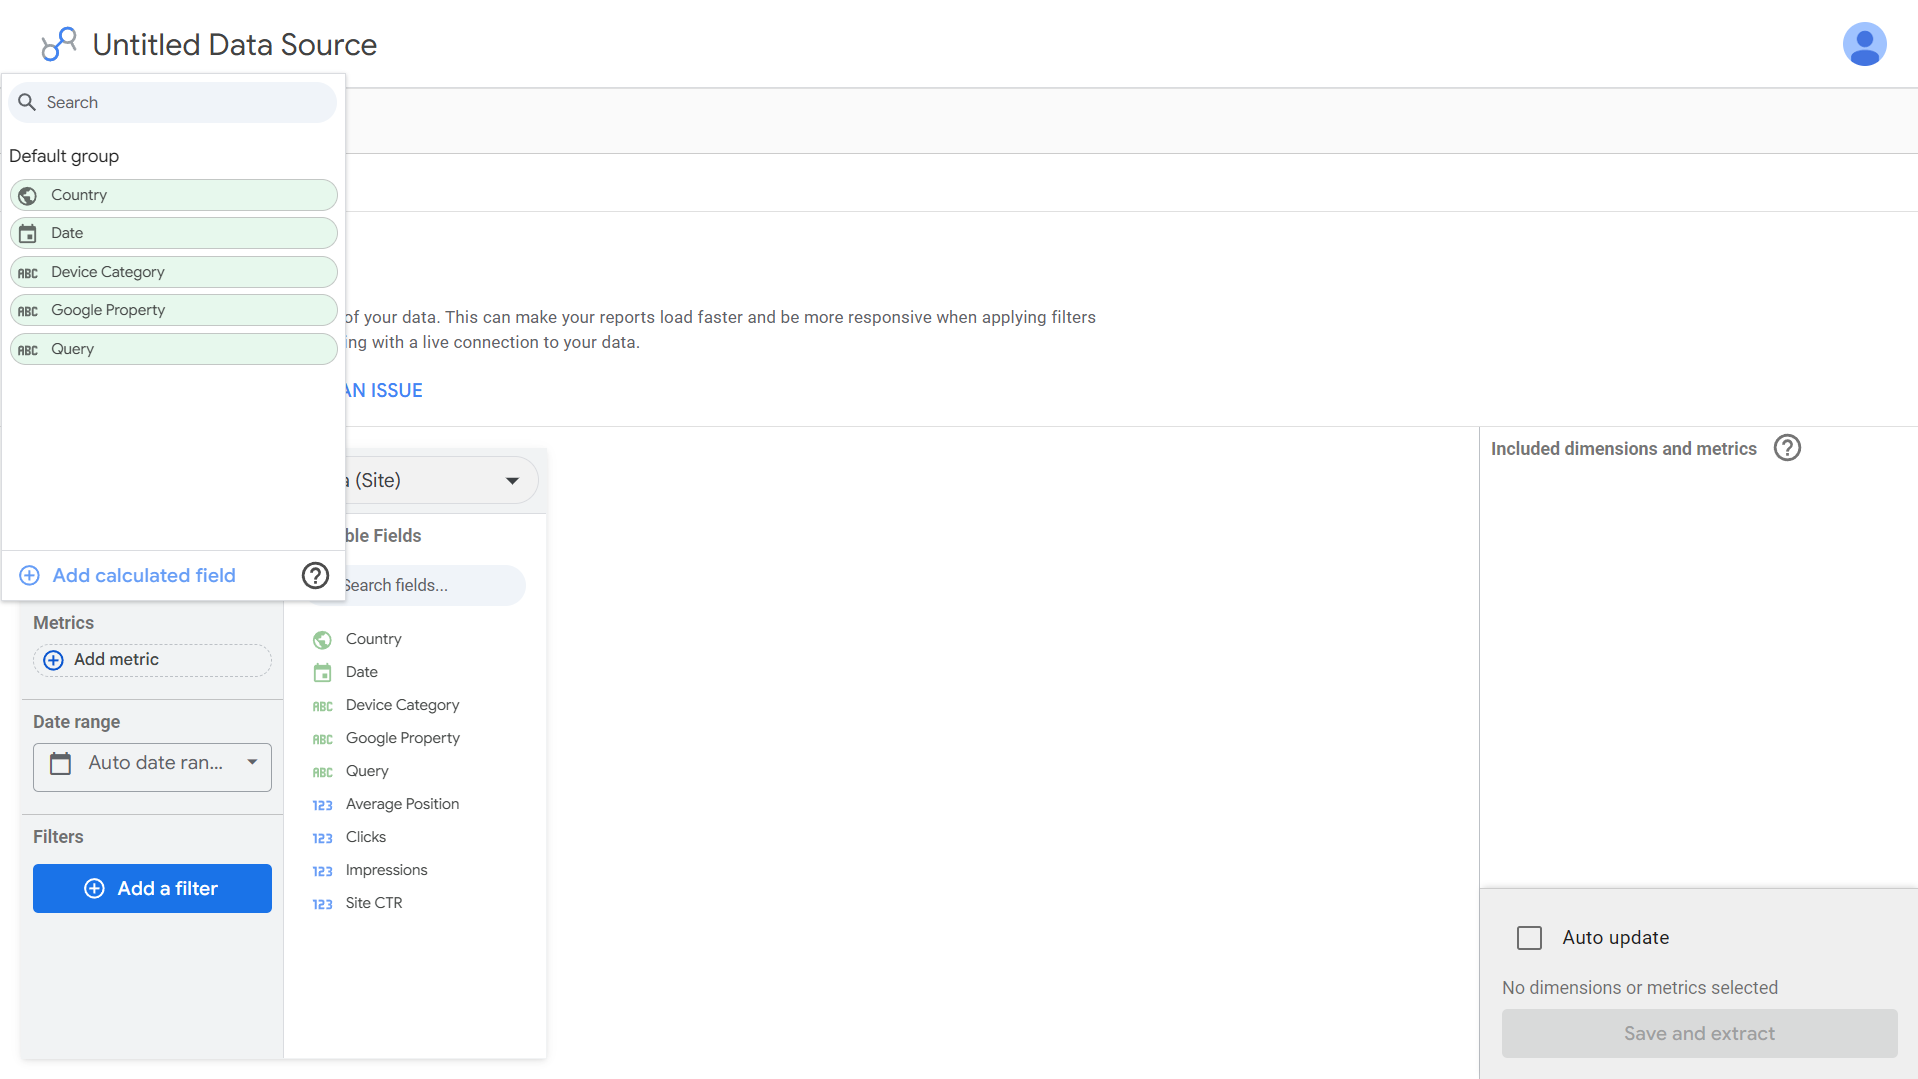
Add only the fields your charts use. If the data is unaggregated, apply an aggregation such as Sum or Average, which Google recommends as a way to reduce the amount of data extracted.
Every extra field increases the size of the extract. Before you add a dimension in case you need it later, check whether any chart in the report actually uses it. Removing unused fields at this stage is the most reliable way to stay under the row limit without rebuilding the extract later.
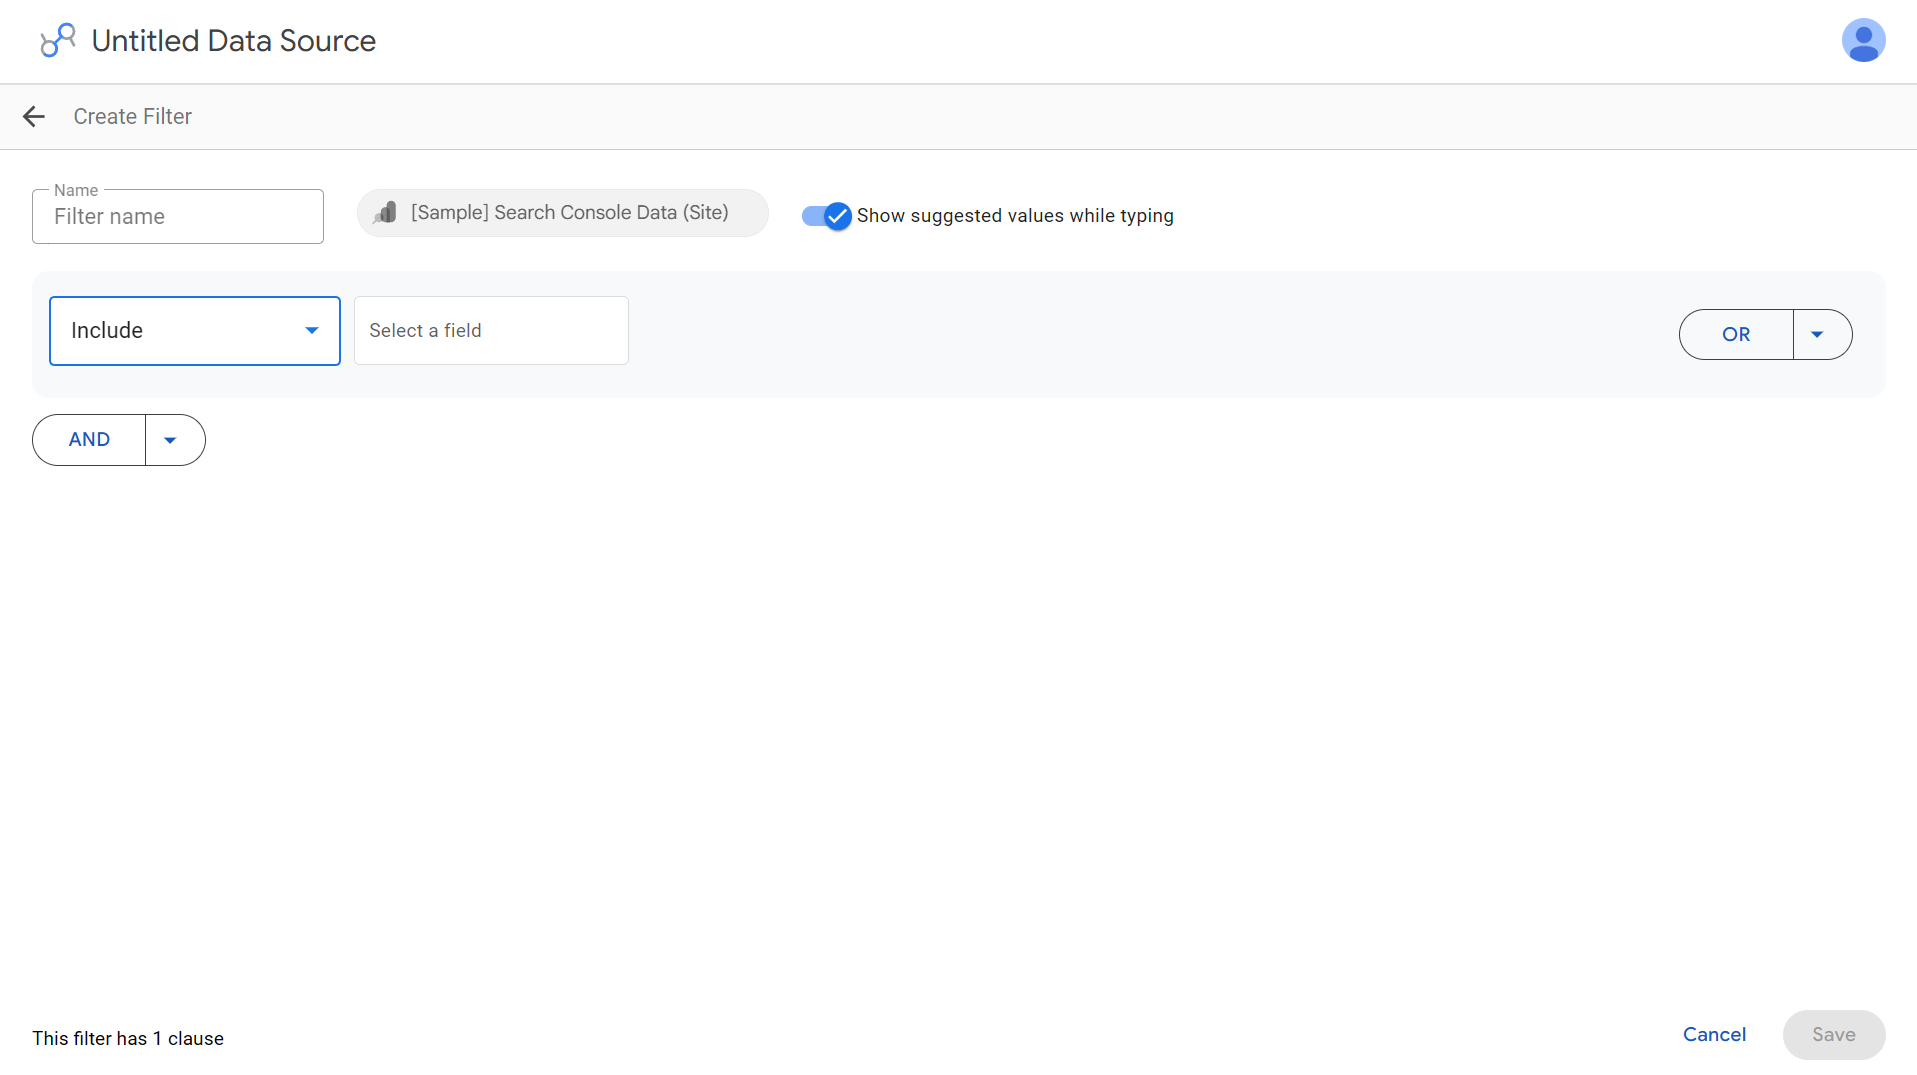
Apply filters to reduce the number of rows, then set a date range. Date ranges are required by some connectors, such as Analytics, and optional for others.
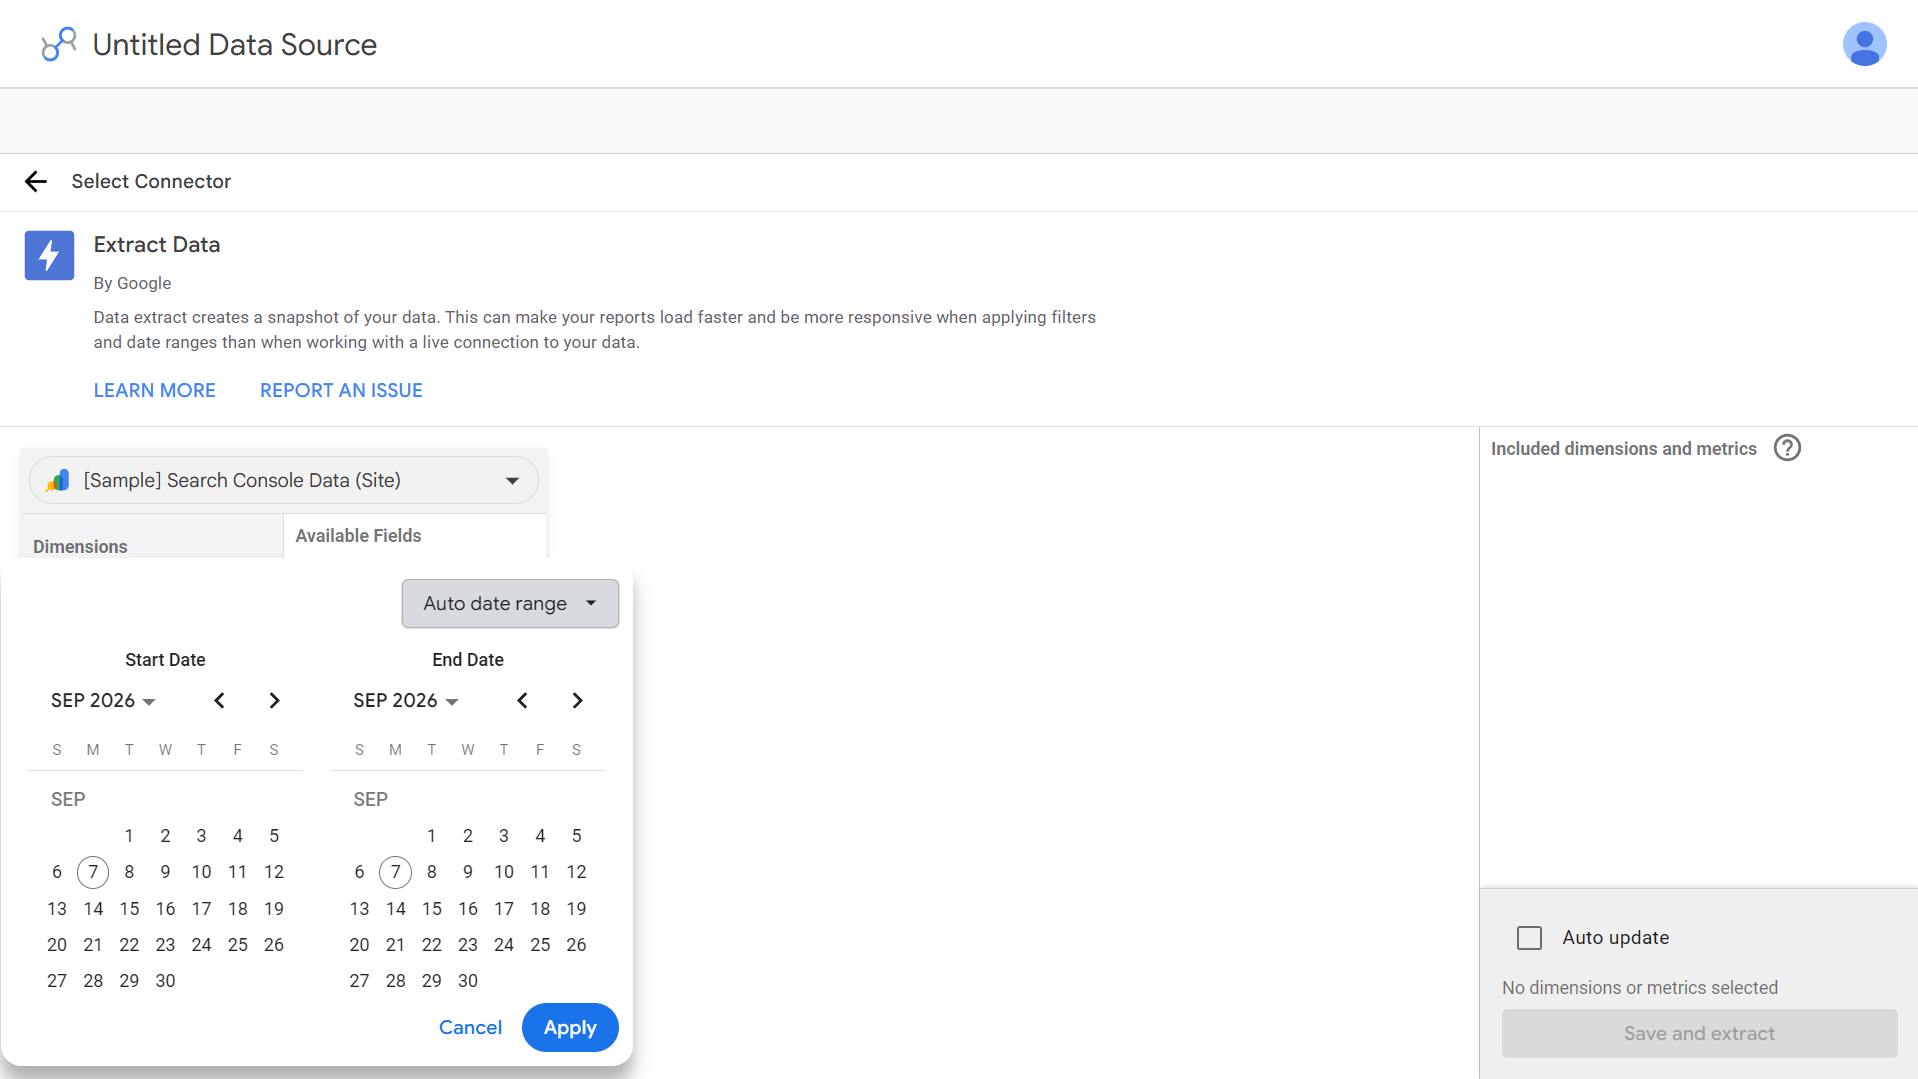
This step does two things at once. It keeps the extract small, and it defines what the snapshot covers, because anything outside the range will not be in the report when someone opens it later.
Click Untitled Data Source in the upper left and give it a name. Use something that describes both the contents and the period, for example, "GA4 extract, rolling 90 days."
Then decide on refreshes. In the lower right, turn on Auto update and set a schedule. Google's documented sequence puts this step before saving, so handle it now.
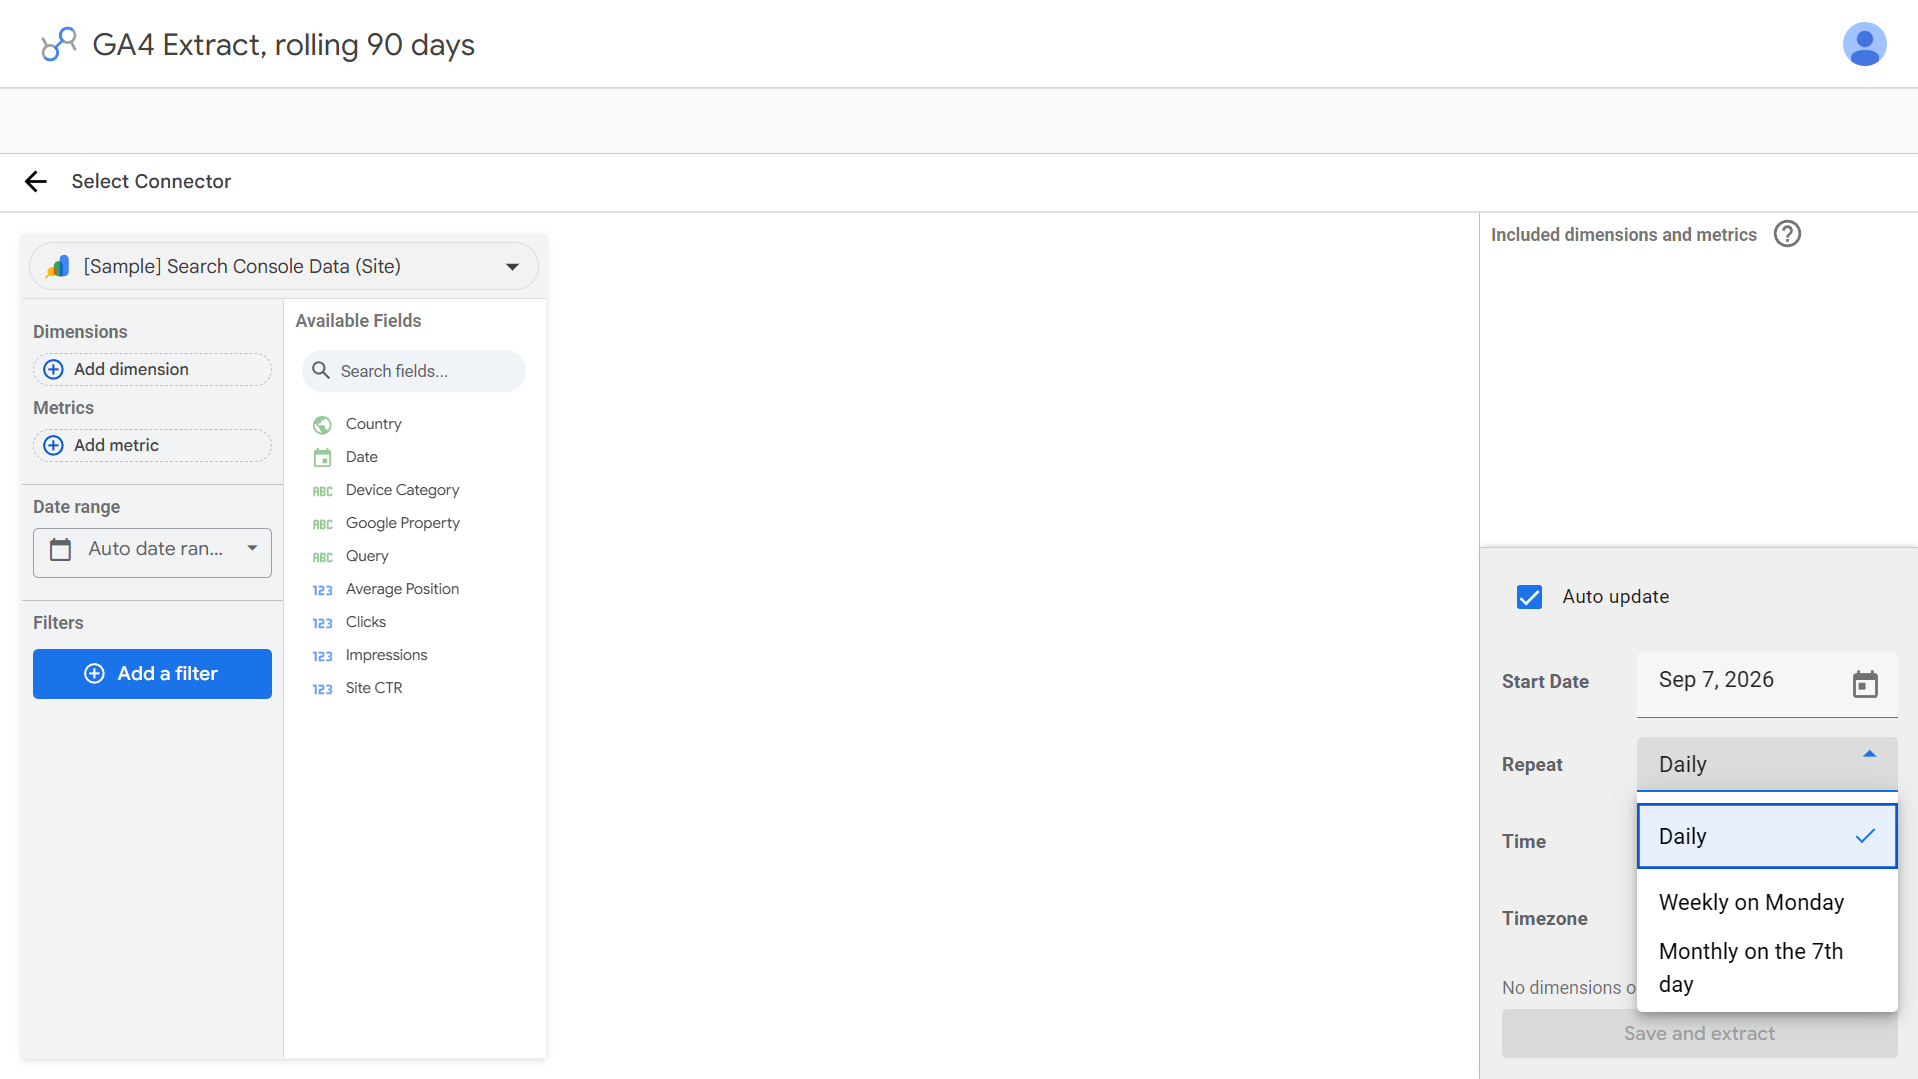
Skip Auto update and the extract stays frozen. Updating it later means opening the data source, clicking Edit Connection, and extracting again by hand. Deciding now saves you from finding a stale dashboard weeks later with no obvious cause.
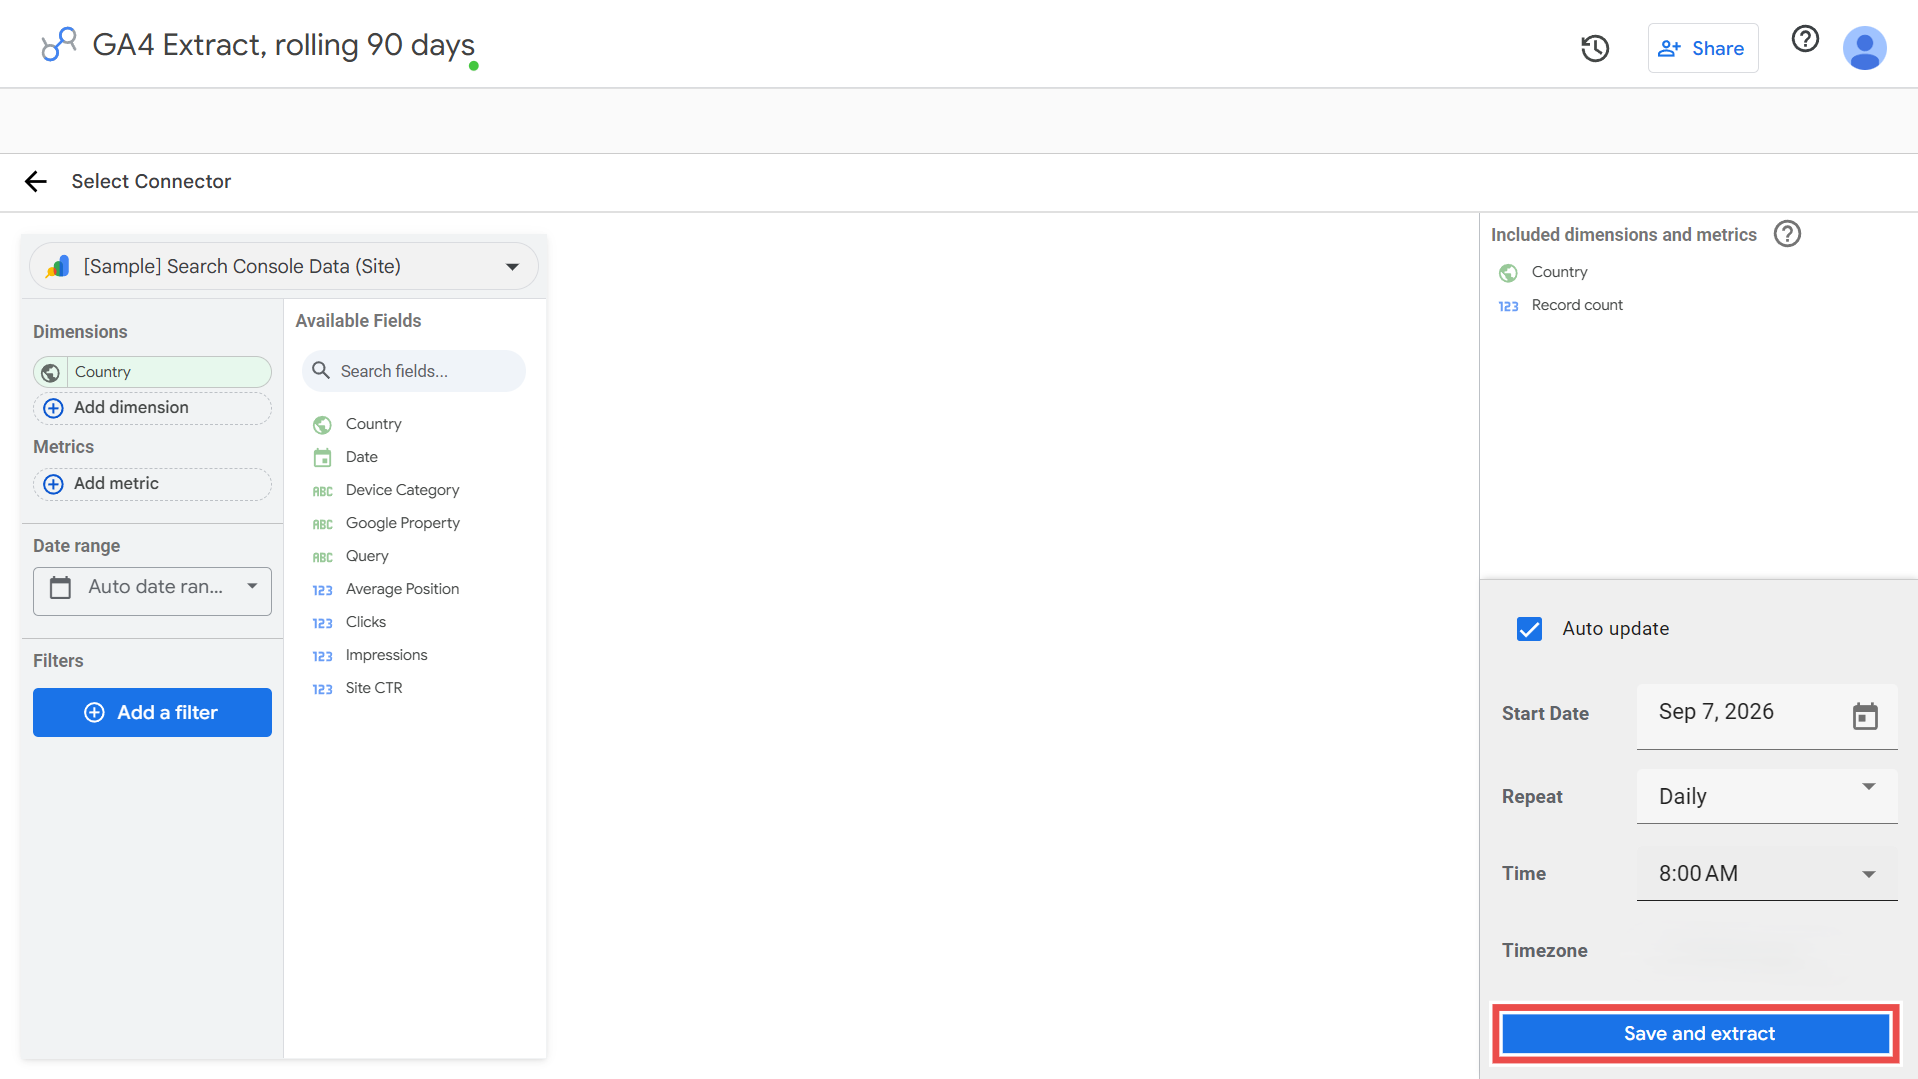
Click Save and Extract in the lower right. This is the point where Looker Studio pulls and stores the data. Everything before it was configuration.
Before you replace a live source in a live report, check these six things:
An extract can look correct while missing a field, a date range, or a filter the report depends on. You can also create dashboards in Looker Studio to cover the reporting side of the workflow.
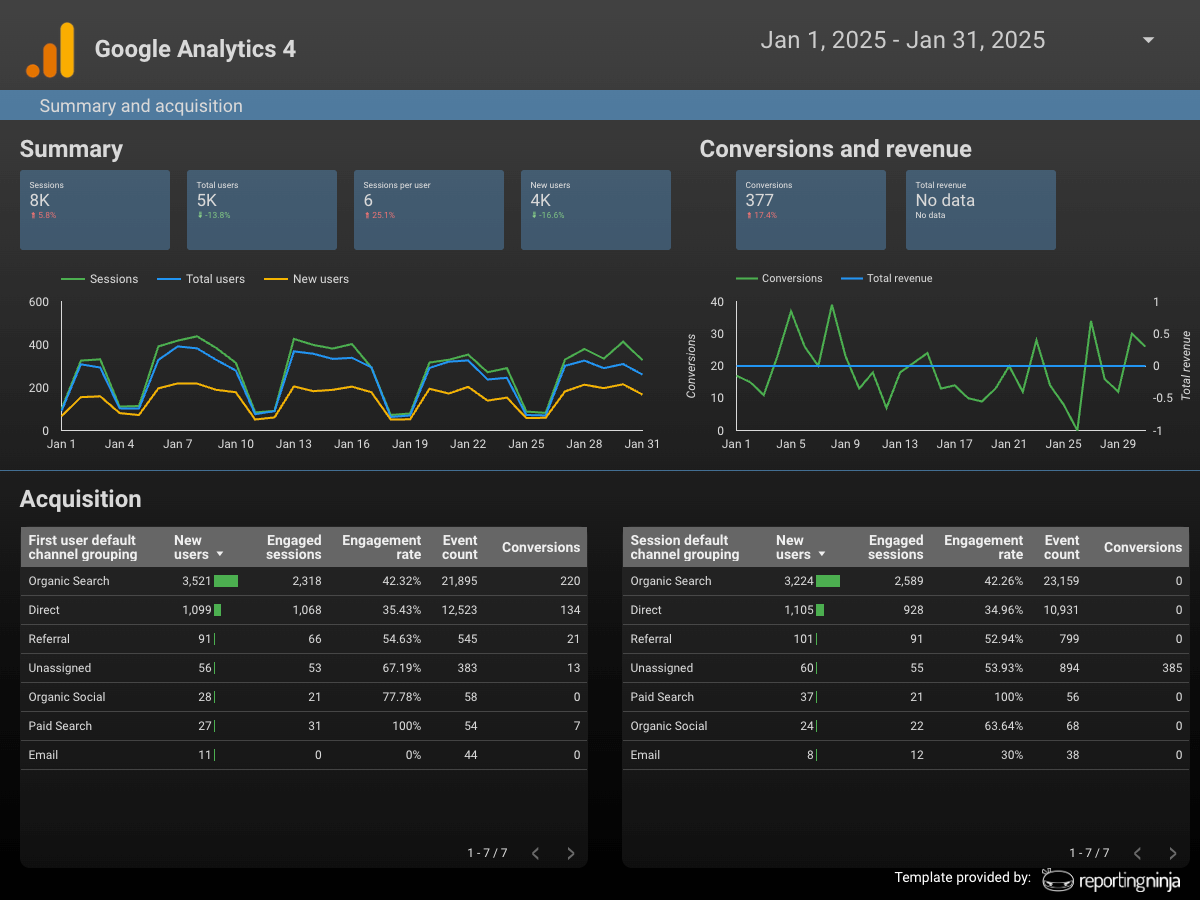
The difference is where Looker Studio gets the data when a report asks for it. Google describes most data source types as maintaining a live connection, with Extract Data as the exception that stores a static snapshot.
Extract Data solves a real performance problem. It also carries hard limits that are not obvious until you reach them.
If the native workflow no longer fits, it is worth comparing Looker Studio alternatives and how Looker Studio, Power BI, and Tableau handle large datasets.
The three scenarios below are illustrative. They describe the reporting problems Extract Data is built to address and the trade-offs each approach carries.
An agency produces weekly Google Ads and GA4 dashboards for a dozen clients. As account history builds up, live queries against months of aggregated data slow down every filter change during client calls.
Extracting a rolling 90-day window of the fields each dashboard actually uses, with a daily Auto update, moves the charts onto a snapshot. The trade-off is that a midday spend change will not appear until the next scheduled refresh, which suits a fixed weekly review cadence.
An in-house team builds a monthly recap combining Google Ads spend with GA4 conversion data. The report does not need current numbers, but live connections still query fresh data every time a stakeholder opens it during the review cycle.
Extracting the prior month once, after month-end close, with no Auto update at all, produces a stable and fast report that will not change again until the next extraction. The limitation is that anyone wanting to check the current month needs a separate live view.
A team building recurring SEO or PPC reports hits slow queries every time a filter or date range changes. Extracting the relevant fields into a source scoped to the reporting period removes the live connection from that report.
The 750,000-row ceiling is the constraint here. A large historical dataset means the team has to narrow the scope or aggregate more before extracting. Once the reports are stable, automating the reporting cycle removes the remaining manual work.
{{cta-block-v1}}
Extract Data solves one performance problem inside Looker Studio. Most reporting workflows use it alongside other tools. Here is what each one does best.

Looker Studio, officially rebranded to Data Studio in April 2026, is where the dashboards live, and the core product is free. Its native connectors cover Google's own products directly.
Anything outside that set needs a third-party connector, and Extract Data is the built-in way to make any connected source load faster. It is built for visualization, and it does not pull or blend data from non-Google platforms on its own. Free Looker Studio templates are available if you want to start from an existing report structure.
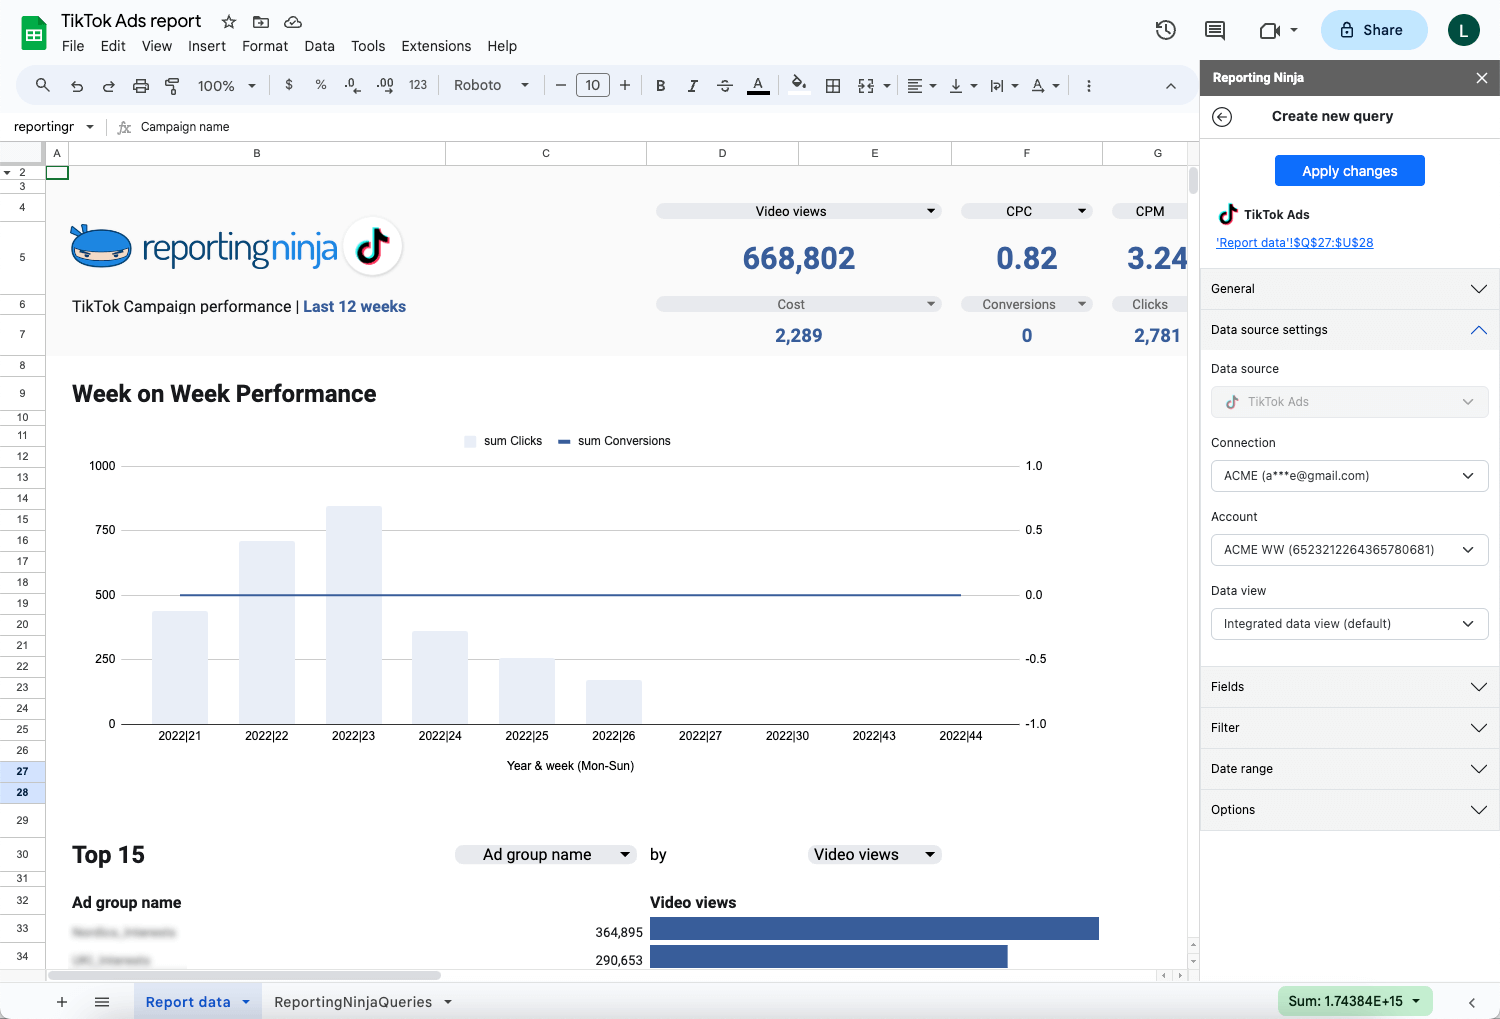
Sheets is the practical option when data needs manual cleanup, blending, or staging before it becomes dashboard-ready. It connects to Looker Studio as a free native source, and Google's freshness documentation lists Sheets at every 15 minutes by default, faster than any Google ad connector.
Sheets stops being the right tool once data volume or update frequency grows past what a spreadsheet handles comfortably. That is usually the point where a dedicated connector or an extract makes more sense, and a Google Sheets add-on (like one in Reporting Ninja) can pull the data in without a manual export.
Supermetrics moves marketing data from a wide range of ad and analytics platforms into Looker Studio, Sheets, Excel, Power BI, or a data warehouse. Its Starter package is $44 a month billed annually and includes three data sources and one destination. Growth is $177 a month billed annually with six data sources.
Anyone comparing it specifically for Looker Studio should read the footnote on its own pricing page. Supermetrics states that its automated refresh does not apply to the Looker Studio destination, because those dashboards update on demand.
Extra destinations and users are priced separately, at $49 and $37 a month on Starter. If cost is the deciding factor, this comparison of Supermetrics alternatives covers the market.
Reporting Ninja is built for agencies and marketing teams that need more than a single-report fix. Extract Data improves performance for one dashboard at a time. The platform handles the account-connection layer across a full client roster, then lets you send that data to Looker Studio, Google Sheets, or its own custom reports platform.
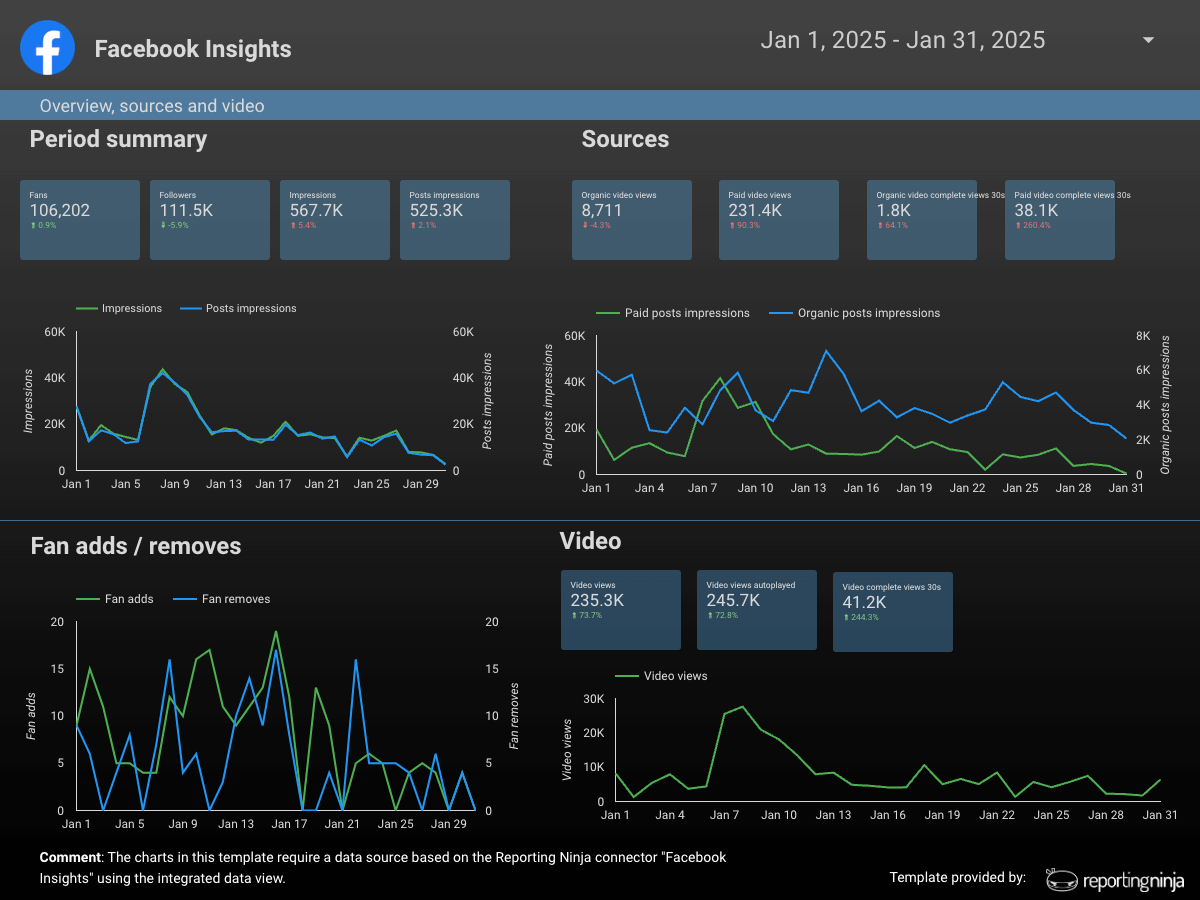
Native Looker Studio connectors for Google Ads, GA4, Meta Ads, Instagram Insights, LinkedIn Ads, Microsoft Advertising, and other major platforms, with access to each source's full set of dimensions and metrics
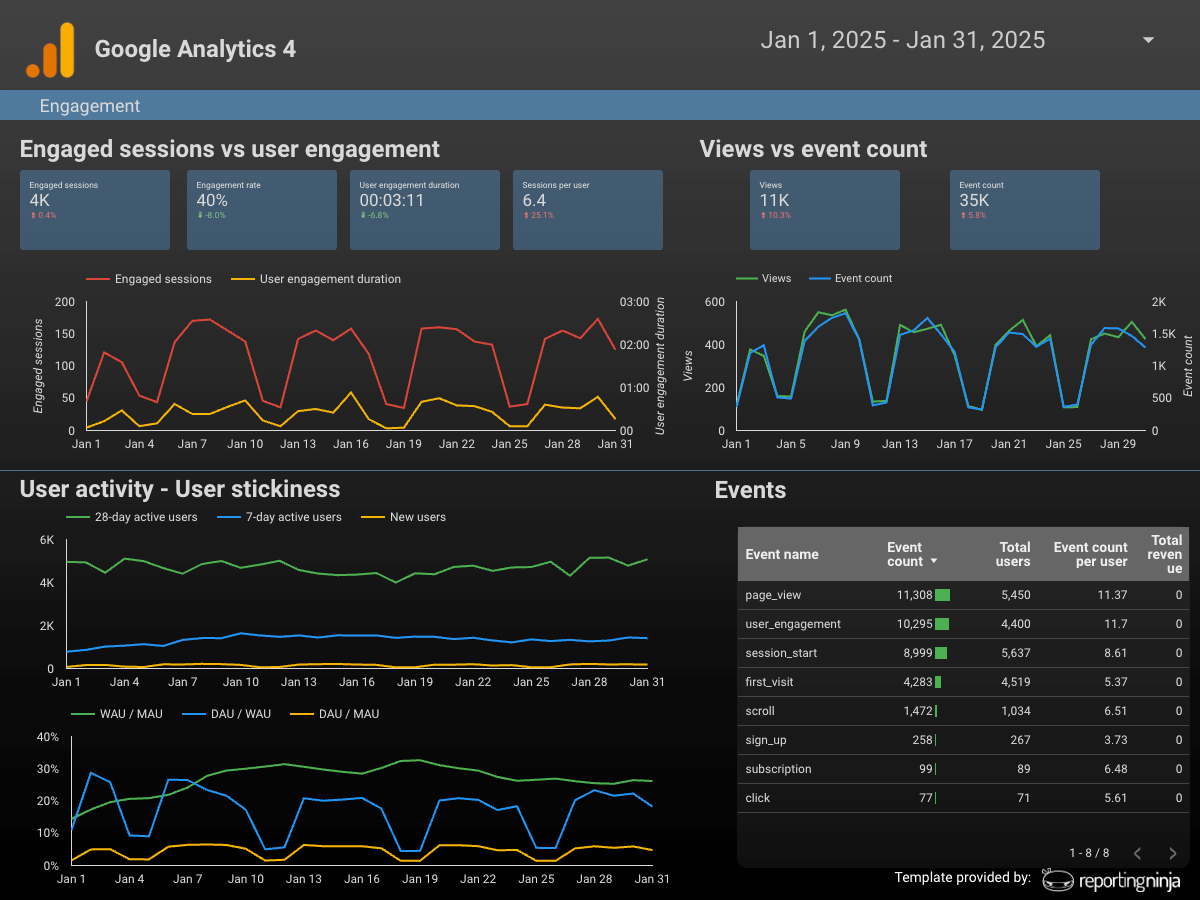
Additional features include:
Plans start from $20 a month billed annually for 10 accounts of each type, up to $120 a month for 150 accounts of each type. The free trial runs 15 days and needs no credit card. Every plan includes all connectors, the custom reports platform, the Google Sheets add-on, API access, and AI reporting.
That flat structure is the key difference from per-connector pricing. Supermetrics charges separately for extra destinations, users, and data sources. Reporting Ninja includes all of them on every plan and scales on account volume instead.
{{cta-block-v1}}
If you came to this guide because your Looker Studio reports load slowly and pull from a dozen separate connections, Extract Data fixes the loading problem one report at a time.
Connect your ad and analytics accounts once with Reporting Ninja, and the same data reaches Looker Studio, Google Sheets, or a scheduled client report without a separate connector subscription for each platform.
If that means less setup than what you run today, start your free trial and connect your first data source, with no credit card required.
Only when you tell it to. Extracted data sources have no data freshness setting, so they update through Auto update on a schedule or through a manual re-extract.
Yes. Google stores the extracted data on its servers, and deleting the extracted data source removes that stored data as well.
No. Extract Data has no direct export or download option. The extract exists as a data source inside Looker Studio for use in reports, not as a file you can take away.
Yes. An extracted data source behaves like any standard data source once created, so it can appear alongside live connections or be blended with other sources in the same report.
No. The 100 MB and 750,000-row caps suit single-report snapshots. A warehouse such as BigQuery handles the volume, joins, and query flexibility that extracts cannot.
Sign up for a 15 days free trial. No credit card required.

Build and automate amazing custom reports in a few clicks. Save time, be more productive, impress your clients.