Analytics
September 22, 2026
AI marketing reporting for agencies: best practices & examples



A report covering five ad accounts, one spreadsheet, and a written summary used to take one person most of an afternoon.
But now, AI marketing reporting removes most of the manual work from a monthly client report. The tools pull the data, build the report elements, and draft the summary with little to no human input, leaving you with enough free time to check the numbers and decide what to do about them.
This guide covers what AI can and cannot automate in a report, what a good AI-built report should include, how to set up the workflow, and what to check before you rely on it.
A marketing report has four stages: collecting and preparing data, analyzing performance, writing explanations, and preparing the report for delivery. AI reporting tools can assist with each stage, although the level of automation varies.
Here is where automation does the most work, and where you still need to check its output.
Pre-built connectors in your AI reporting tool pull data from your ad accounts, analytics, and CRM on a schedule, so you do not export a spreadsheet from each platform by hand. Once the data is in one place, automated rules can flag duplicate rows, missing conversions, or a metric outside its usual range.
This stage removes the most repetitive part of reporting, which includes opening several tabs, copying numbers into a sheet, and reformatting them so they match.
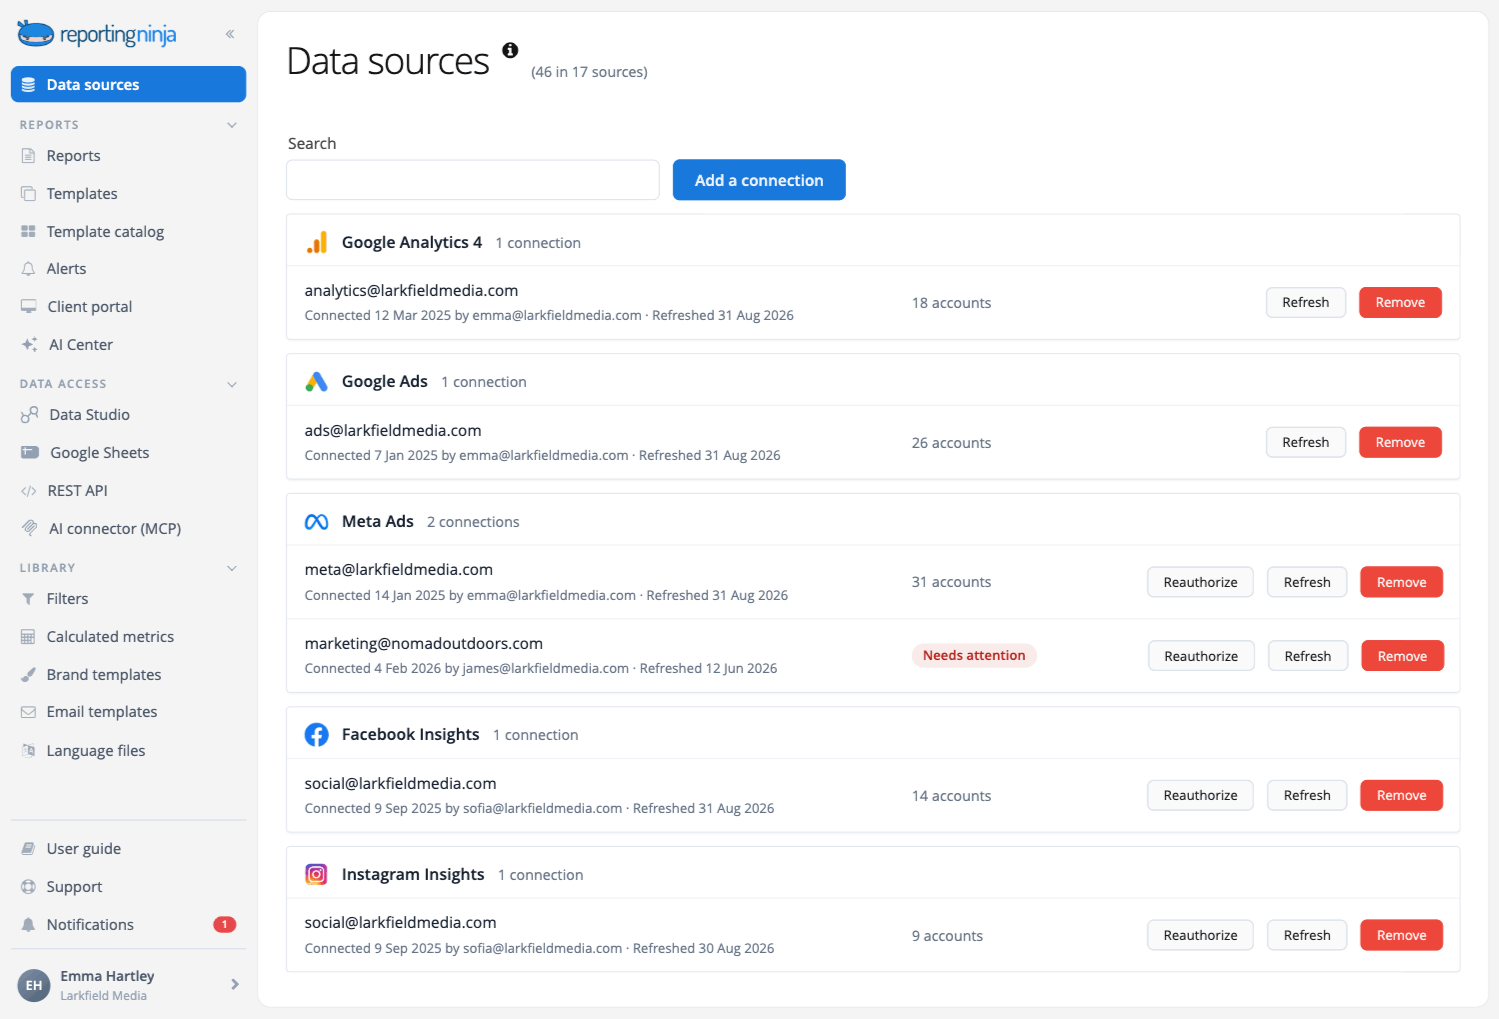
Reporting Ninja collects data from your ad, analytics, social, email, and CRM platforms in one account. From there, you can use cross-platform reporting to combine several sources in a single table or chart.
Connectors need regular upkeep because platforms change their APIs and account logins expire. Reporting Ninja maintains its connectors for you, so your team does not have to find and repair these problems before each report.
Explore how Reporting Ninja's AI marketing platform works
Once your data is in one place, AI can analyze trends, compare periods, group results, and identify changes that deserve attention. It can also build the specific chart or table you need to add inside your report without you configuring it from scratch.
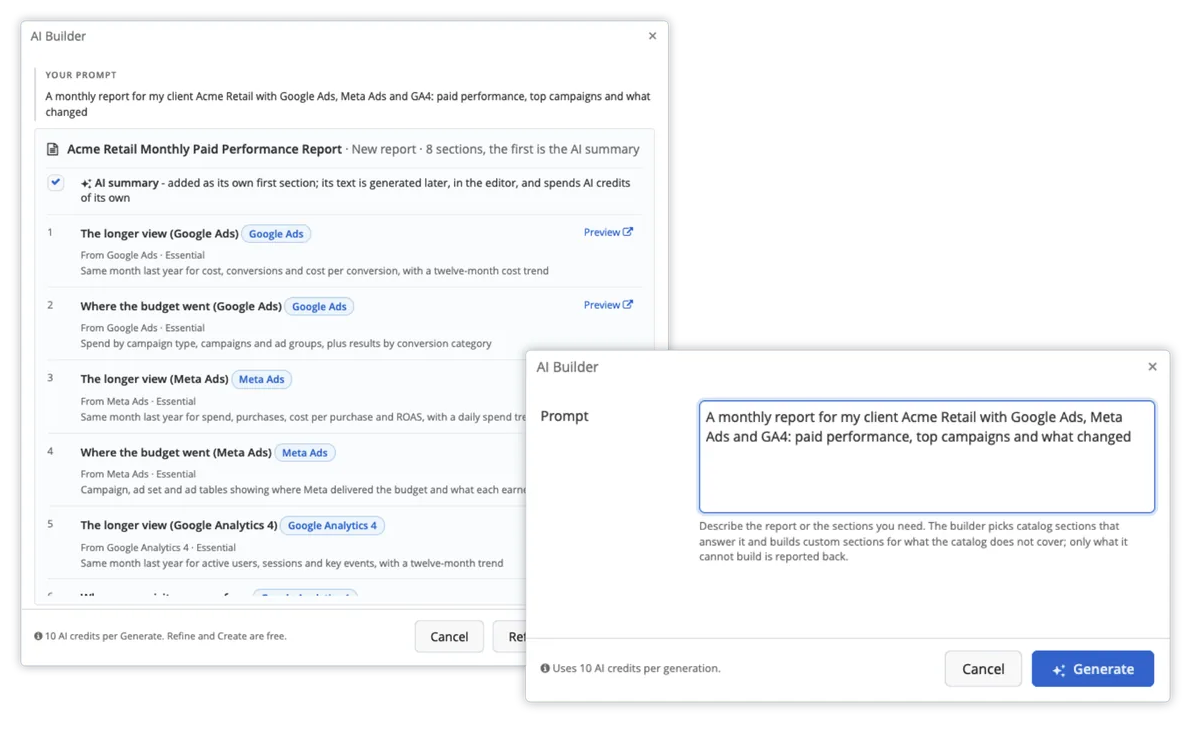
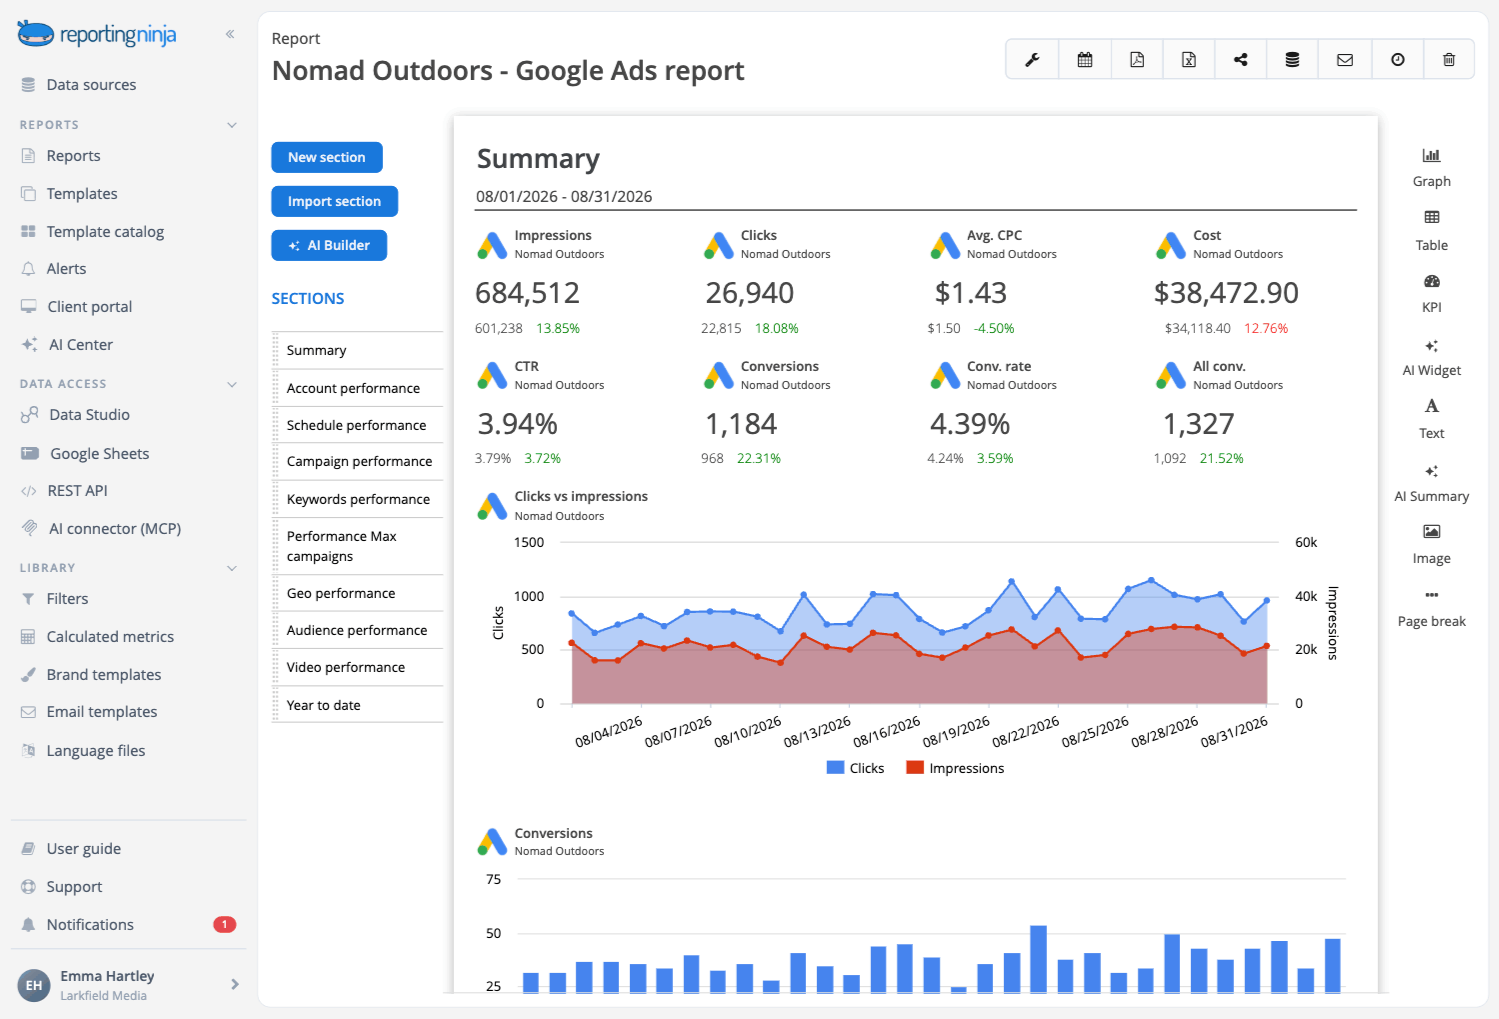
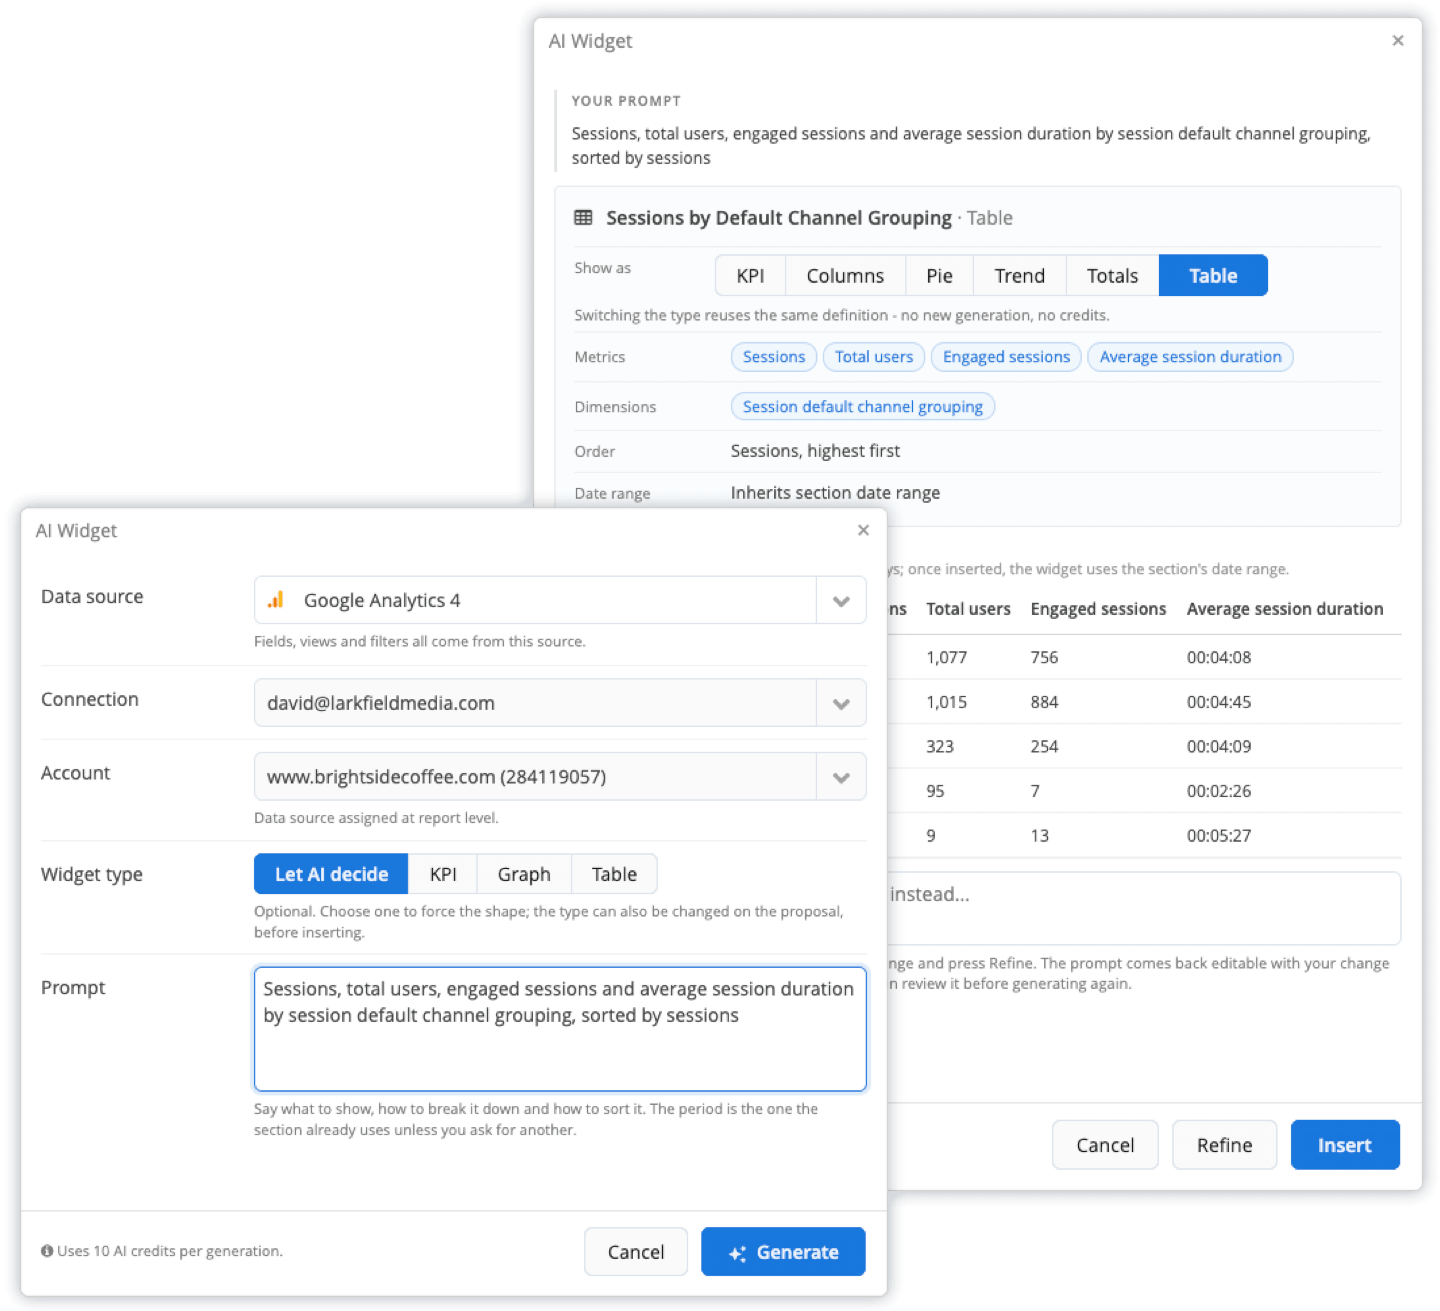
Reporting Ninja's automated marketing reports include AI widgets, which let you describe the chart you want in plain language. The system selects the source, metrics, dimensions, and format, then runs the widget against your connected data before proposing it.
Writing the explanation behind the numbers used to be entirely your job.
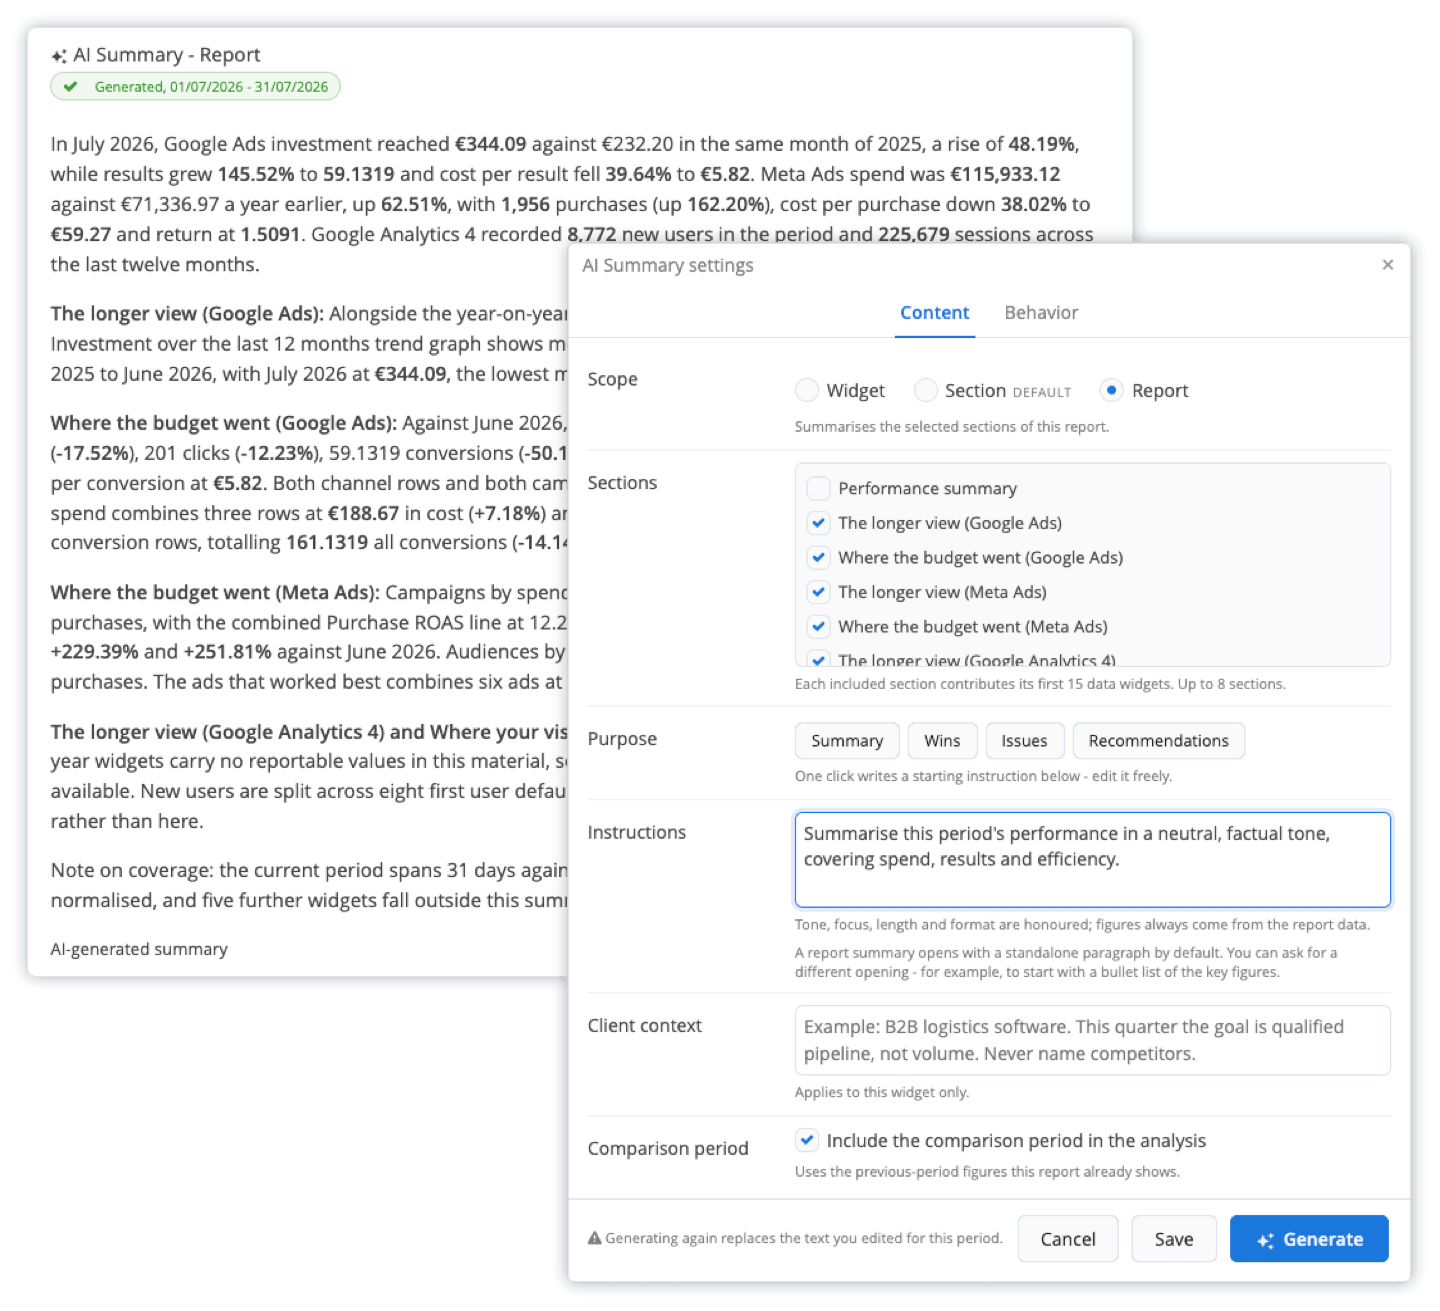
With Reporting Ninja's AI Summary feature, you can now generate that analysis automatically from the numbers already in the report. As a result, you can trust that the AI queries clean, current data instead of stale training material or a broken connector.
You can set the purpose of the summary, add instructions, compare periods, and edit the generated text before it goes out in a PDF, a scheduled email, or the client portal.
Human review is still an essential step before a summary reaches a client. The AI works only from the numbers, so it can miss context such as a promotion the client ended early. That’s why Reporting Ninja does not create, delete, or schedule anything until you approve it. If you edit a sentence in a summary, your version is kept on later runs.
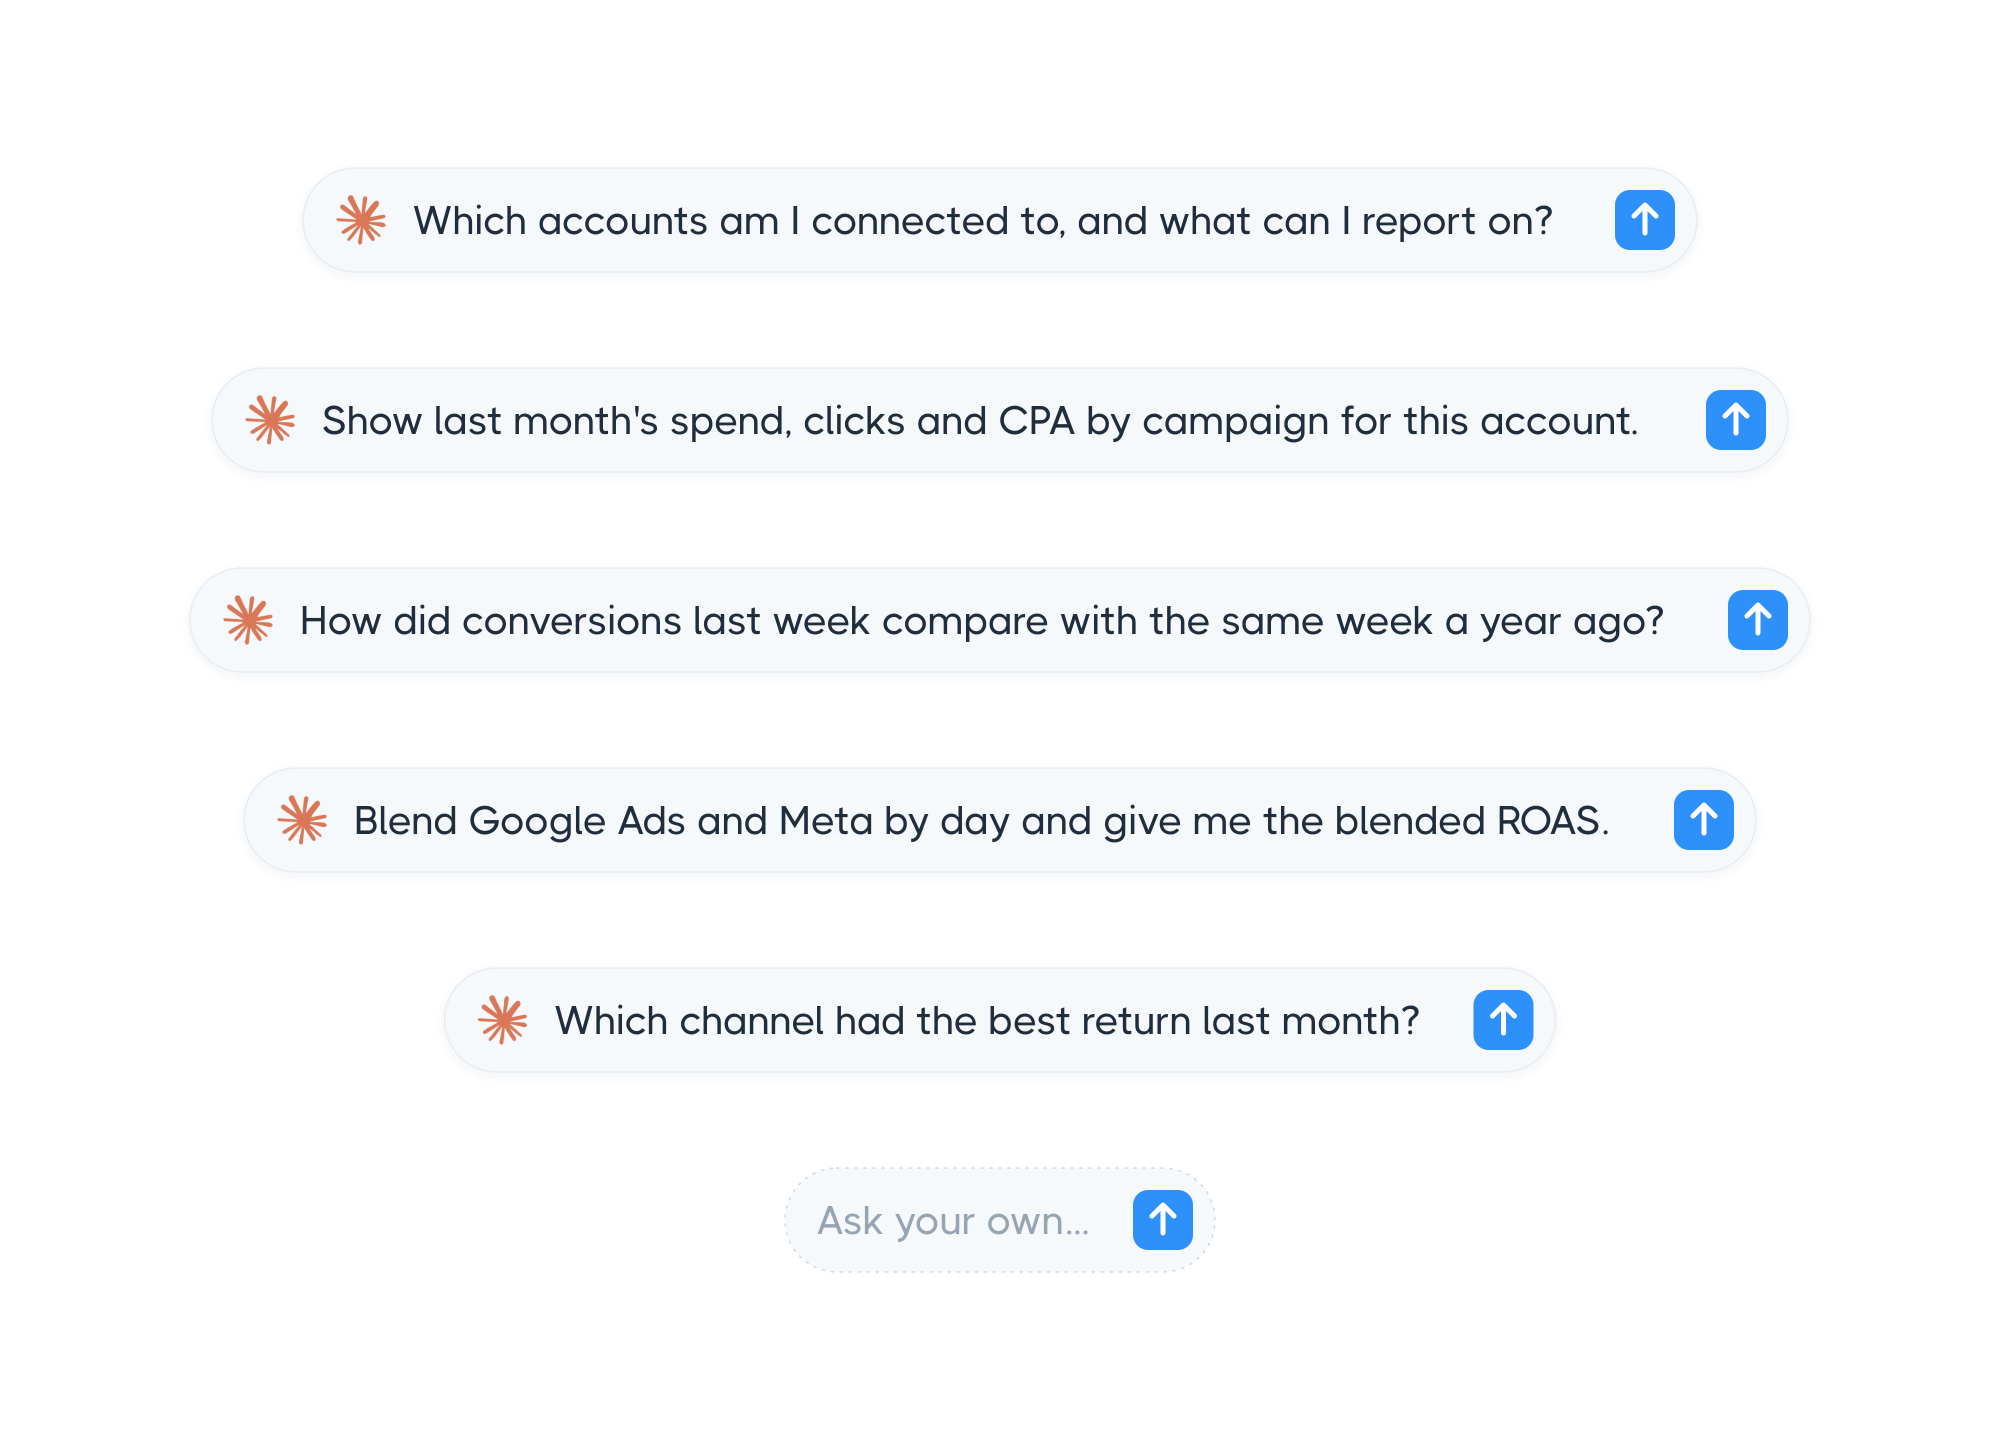
For quicker questions outside a scheduled report, Reporting Ninja's MCP connector lets you ask Claude or ChatGPT directly about your connected accounts. You can ask for a PPC audit or a check on unusual changes without opening a dashboard first. The connector is read-only, so the assistant can look at your data but cannot change your campaigns.
AI can also support the final stage in the workflow, which is preparing the report for recurring delivery. This matters most for agencies sending similar reports every week or month, where rebuilding the same document each cycle takes the most time.
A repeatable process relies on a report template, defined data sources, fixed reporting periods, and scheduled delivery. Reporting Ninja's custom reports platform handles scheduled, branded delivery through PDF, email, or a client portal on the schedule you set. You do not rebuild the report before every client review.
Try Reporting Ninja free for 15 days and build your first AI-assisted report from the accounts you already use. The AI features are included in the trial, and no credit card is required.
A good report is built around the decisions someone has to make after reading it. Those decisions are whether performance is on track, where to move the budget, and what to do next.
Open with the answer before you show the raw numbers. A headline summary states whether the account is on track against its goal in one or two sentences, before any chart appears.
This is where Reporting Ninja’s AI Summary helps. Because it is generated from the same numbers in the report, it can state what changed and why in plain language.
A list of spend and conversions is raw data. A summary adds context, such as "conversions grew 18% month over month, driven mostly by one channel."
This section answers where the performance is coming from, broken down by channel or campaign rather than blended into one number. A blended average can hide an underperforming channel behind a strong one.
Build this section as a metrics dashboard sorted by the metric that matters most for the report, whether that is cost per acquisition, return on ad spend, or lead volume. Knowing the difference between KPIs and metrics helps you decide which number leads.
If you are using an AI-assisted widget builder, a specific request such as showing spend and conversions by campaign with the worst performers first saves the time you would spend building charts by hand.
A number without a comparison period does not tell anyone whether it is good or bad. This section shows the current period against the last one, or against the same period last year, so a reader can tell whether a change is a pattern or normal variation.
AI comparison tools generate this automatically once you tell them which window matters. They are useful because comparing periods by hand across several channels is slow and easy to get wrong.
Keep at least one trend line or comparison table here rather than a single-period snapshot.
This is the section AI should draft but never finalize alone. A recommendations section lists two or three specific next steps, such as moving the budget away from an underperforming campaign, tied directly to what the data showed above it.
AI can turn those patterns into suggested actions. Review each one against the account's goals, constraints, and any changes in the past reporting period.
{{cta-block-v1}}
AI reporting changes how much time recurring reporting takes. Teams spend less time assembling data and more time interpreting performance, checking exceptions, and advising clients.
The aim is to give you more time to decide what the numbers mean within your wider marketing measurement framework. AI should not replace your judgment on a report.
Add AI to your reporting in stages rather than by swapping one tool for another. Connect and standardize your data first. Then decide what to automate and set up the schedule and the review step a person completes before anything reaches a client.
Start by centralizing your marketing data. Bring your ad platforms, analytics accounts, CRM, and ecommerce systems into a single reporting tool instead of checking each source separately.
AI-generated summaries and comparisons are only as reliable as the data feeding them, so this step matters more than which AI feature you turn on first. If a connection breaks or a metric stops updating, the report built from it will still look complete. That is the error most likely to damage client trust.
Before choosing your platform, check that it integrates with the relevant marketing channels you’re reporting on.
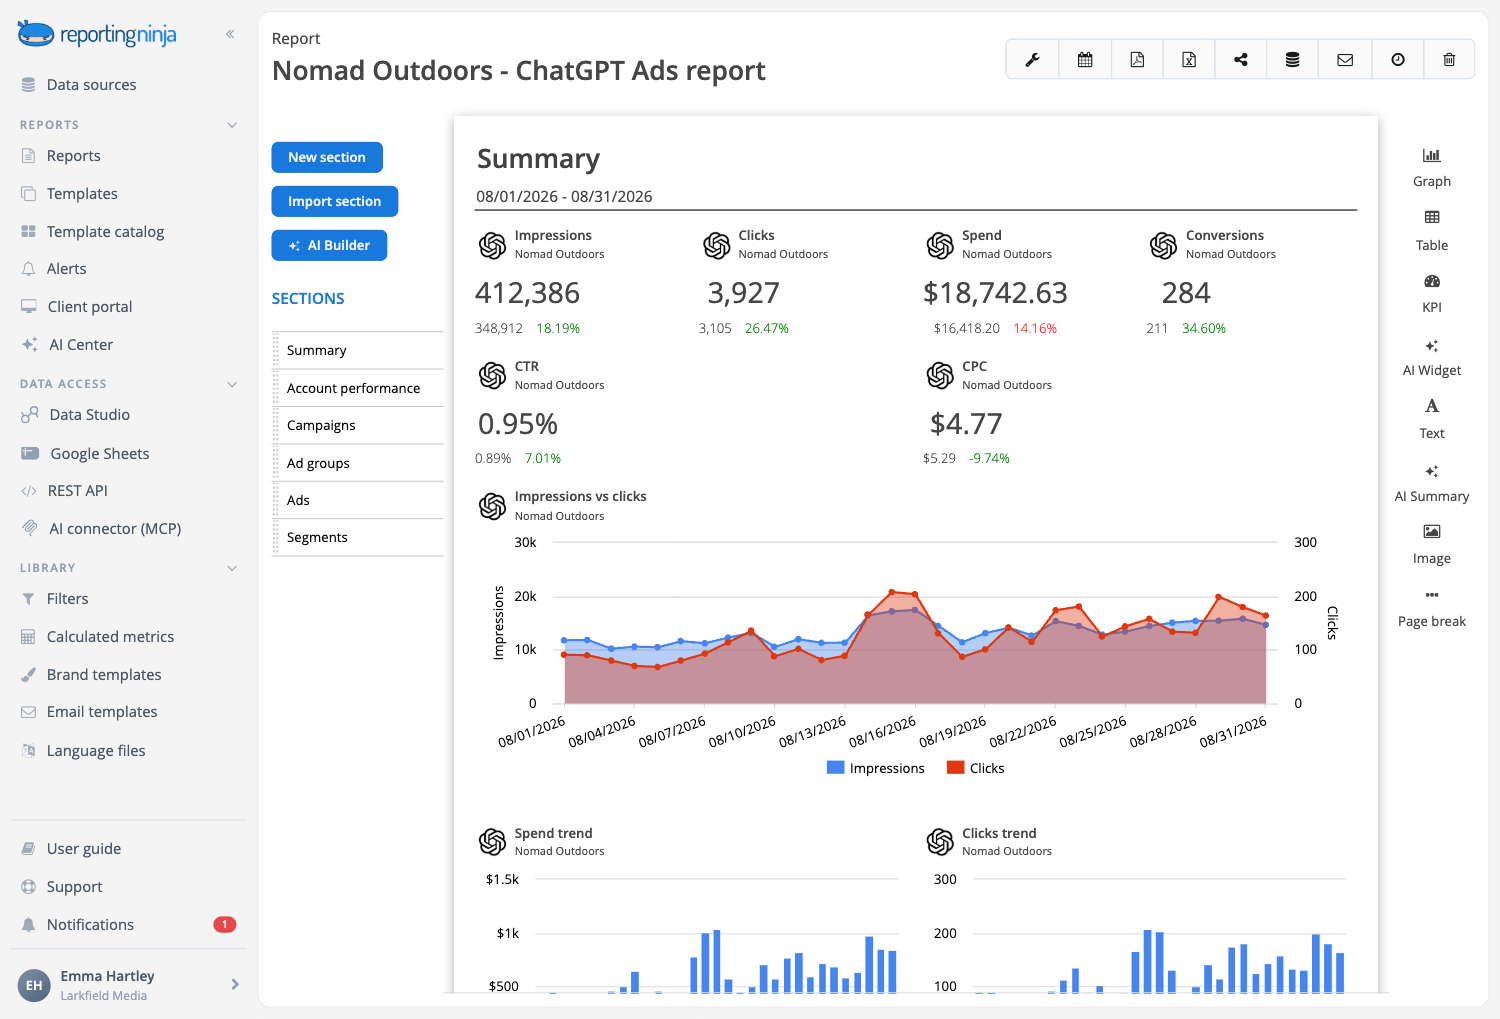
Reporting Ninja, for instance, integrates with not only traditional marketing platforms like Google Ads, GA4, Meta, and LinkedIn, but also emerging channels including Reddit Ads, Snapchat Ads, and even ChatGPT Ads now!
Explore all of Reporting Ninja’s integrations.
Before you let AI compare reporting periods or generate a summary, agree on what each metric means across every account. If "conversion" tracks a form fill on one client's account and a completed purchase on another, an automated comparison treats them as the same metric.
This step is manual and takes longer than expected the first time, but it only needs doing once per report type. Write down which conversion event counts, which attribution window applies, and which date format the report uses.
Once that is fixed, every AI-generated comparison and summary uses the same definitions, so each report does not define them again. This is also the point to review your marketing data analysis process before automating it.
Not every part of your reporting needs automating on day one. Start with the step that costs the most repeated hours, usually data collection and chart-building, because those are the most mechanical.
Leave narrative and recommendations for later in the rollout. Those are the parts a client reads closely, and an early mistake there costs the most trust.
A reasonable order is to connect and centralize data, automate the recurring charts and tables, then turn on AI-drafted summaries once you have checked several manually written ones against what the AI would have produced.
{{cta-block-v1}}
Once the report structure is built, schedule its generation and delivery, whether that is a PDF by email, a scheduled report in your platform, or a live client portal. Build in a review step before delivery rather than after.
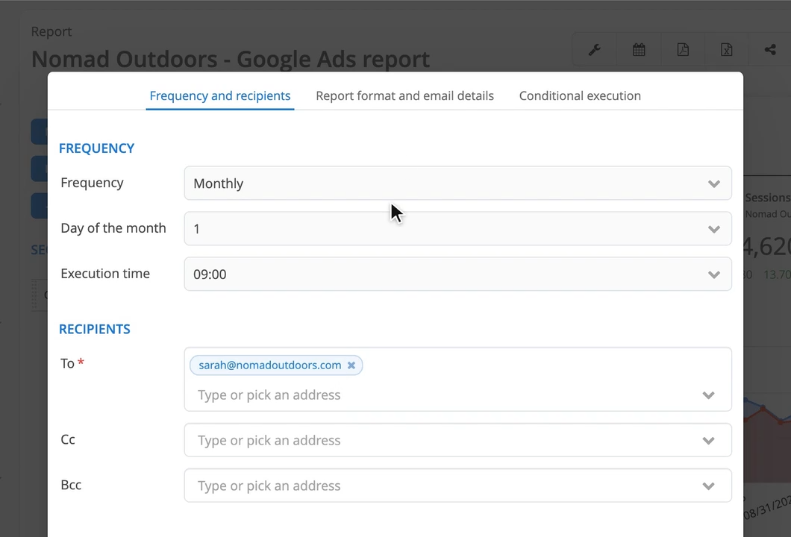
That review is a short check of the numbers and the summary against what you would expect, done by a person who knows the account. Ten minutes reviewing an automated report is still faster than building one from scratch, and it confirms the report is correct before a client sees it.
If you manage several accounts, this review step is also where you catch account-specific context, such as a paused campaign, that no automated tool would know to mention.
AI explanations can sound more certain than the data supports. A report may correctly identify a change and incorrectly explain why it happened. Treat causal explanations as claims that need evidence.
None of these is a reason to avoid AI reporting. Each one is a check to build into your process, so the final report gives the client enough context to understand the result and decide what to do next.
Attribution deserves its own check here. If your report blends channels, the attribution model behind it decides which channel receives credit, and cross-channel attribution changes those numbers before any AI summary reads them.
Good results from AI reporting depend more on your habits than on which tool you pick. These five apply whether you are automating one report or twenty.
Treat every AI-drafted summary or recommendation as a first draft. Check the numbers, comparisons, summaries, and recommendations before sending an AI-generated report to a client.
Pay particular attention to unusual changes, missing data, and claims about why performance changed. This step catches the mistakes that matter most, such as a metric pulled from the wrong date range, a comparison that skips a known anomaly, or a recommendation that ignores something you know about the client's business.
AI narrative and comparison tools work from the same numbers you would use manually. A broken connection or an unstandardized metric produces a confident-sounding summary built on bad data.
Before turning on any AI feature, confirm every source is connected and reporting the numbers you expect, and standardize how each metric is defined across accounts.
A summary generated from clean data is useful. A summary generated from a broken connection states the wrong thing confidently.
AI summaries and comparisons work best against a consistent report structure, because the tool needs to know which numbers matter and in what order. Build your report template first, including which sections appear, which metrics lead, and how comparisons are framed.
Only then should you turn on AI-drafted narrative for that structure. Trying to automate the writing before the structure is settled means rebuilding the summary logic every time you change the layout.
Once the template is fixed, the same AI feature generates a reliable summary for every client using it. Good data visualization inside that template also makes the summary easier to check against the charts it describes.
Tell the system which metrics, comparisons, and sources it should use. Separate facts from interpretations and require evidence for causal claims.
"Conversions increased 18%" is a data-backed statement. "The new landing page caused the increase" requires additional evidence.
OpenAI gives similar guidance for its research tools, which is to check sources and validate key claims before relying on them. Apply the same process to client reports, and keep the source with any outside statistic so anyone reviewing the report can verify it.
A report template that worked well when you built it can drift over time. A client's account changes, a platform updates its metric definitions, or a new channel gets added without being folded into the comparison logic.
Set a recurring check, monthly or quarterly, comparing an automated report against a manual pull of the same numbers. Review that data sources, metric definitions, filters, and reporting periods still match your current workflow.
This matters most when campaigns, tracking setups, or client goals change.
The finished output shows what AI reporting does more clearly than a feature list. These are three common scenarios, based on how AI reporting tools work in practice, showing what changes for a person who builds each report by hand today.
An agency account manager needs a monthly report for a B2B software client covering LinkedIn Ads, Google Ads, and HubSpot, with a summary of pipeline impact at the front. Instead of building the report section by section, they describe what it should look like in plain language.
The tool proposes a structure, the sections, widgets, and the sources each one reads from, pulled from the accounts already connected. Nothing is created until the account manager approves the plan.
An hour of manual layout and chart-building becomes a five-minute review of a proposal. You keep the same control over the final result as you would with cross-channel marketing reporting built by hand.
A performance marketer runs weekly reports for six clients and writes a short summary for each one by hand. With AI summaries turned on, each scheduled report arrives with that summary already drafted from the week's numbers and compared against the previous week.
It is delivered in the PDF, the email, and the client portal at once. The marketer still reads each summary before it goes out and edits anything that needs more context.
Editing a draft takes less time than writing one from scratch, and the underlying data analysis report stays consistent week to week.
An in-house marketer wants a quick read on a Google Ads account before a Monday meeting, without opening the platform and building a report first. Using an AI assistant connected through a read-only connector, they ask for spend, conversions, cost per acquisition, and return on ad spend.
They also ask for the trend against the last period and where spend is producing no return. The assistant pulls directly from the connected account and returns the analysis in the same conversation.
The marketer reaches the same answer by asking a question instead of opening a dashboard.
If you are still assembling reports from several marketing platforms each month, Reporting Ninja brings those sources into one reporting workflow. Its AI tools help with data pulls, chart creation, and report summaries, while you keep control over the final report.
AI Builder, AI Widget, and AI Summary work directly from the accounts you have already connected. Every AI feature is included in the custom reports platform on every paid plan starting at $20 a month, billed annually.
Start your free 15-day trial of Reporting Ninja to reap the time-savings of AI and keep control over the final client report, simultaneously.
Yes. AI can assemble the report structure, pull connected data, and draft a written summary, though a person should review it before it reaches a client.
Yes. AI reporting combines data from several marketing platforms when the reporting tool supports those sources. A cross-platform report brings advertising, analytics, and CRM metrics into one workflow.
Sometimes. Accuracy depends on the source data, metric definitions, instructions, AI system, and review process. Clean data reduces one source of error but does not guarantee an accurate report.
Yes. Small agencies can use AI reporting to reduce repetitive data collection, analysis, and report preparation. Start with the recurring reports that take the most manual work.
AI reporting uses AI for tasks such as analysis, summaries, chart creation, and insight generation. Automated reporting focuses on collecting data, updating reports, and delivering them on schedule. A workflow can use both.
{{cta-block-v1}}
Sign up for a 15 days free trial. No credit card required.

Build and automate amazing custom reports in a few clicks. Save time, be more productive, impress your clients.