Analytics
May 27, 2026
2026 Content marketing metrics dashboard: how to build & more


Most teams publish content without a clear view of what’s driving performance. Data sits in multiple tools, results are hard to compare, and decisions often rely on assumptions instead of evidence.
A content marketing metrics dashboard solves that by pulling your key metrics into one place and showing how each piece of content contributes to traffic, engagement, and conversions.
This guide explains what dashboards are, the types you can build, and the metrics that matter for teams running multi-channel content programs.
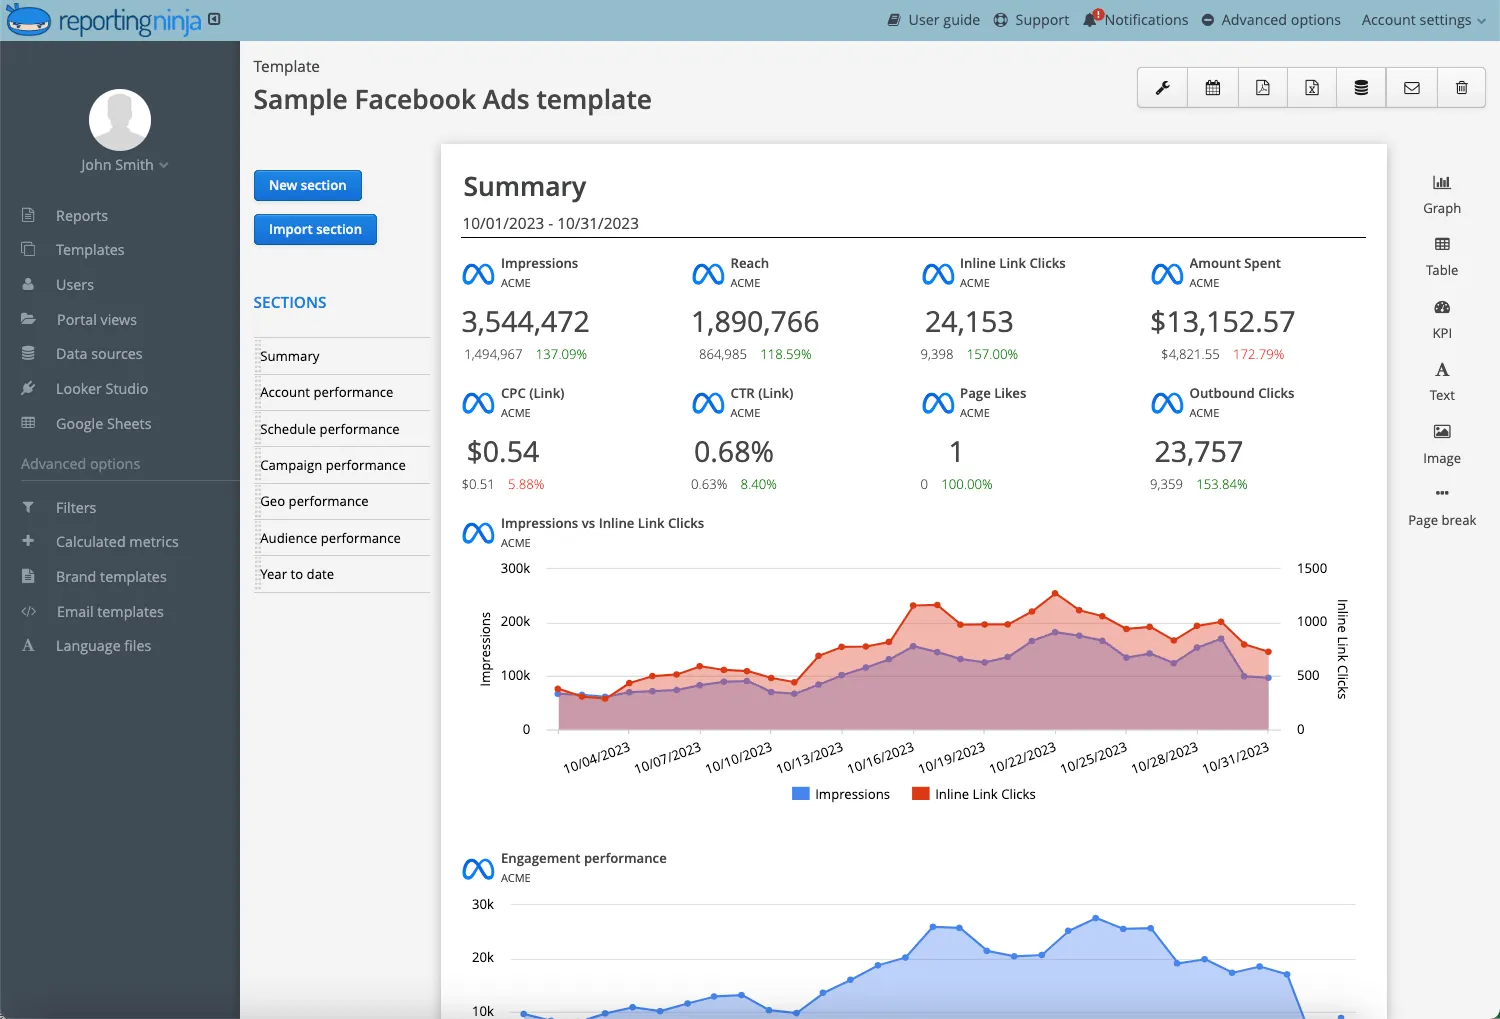
A content marketing metrics dashboard is a single view that shows how your content performs across channels. It brings together metrics like traffic, engagement, conversions, and ROI so you can see what’s working and what needs attention. Marketers use these dashboards to make faster decisions, compare content types, and identify the tactics that actually move results.
Different dashboards focus on specific parts of your content strategy. Each one gives you a clearer view of performance from a different angle, helping you understand what’s working and where to adjust your efforts.
SEO reporting shows how well your content attracts and retains organic traffic. It highlights which topics bring in qualified visitors, where rankings are shifting, and which pages need updating. Teams use it to find content gaps, monitor changes over time, and decide where to focus optimisation work.
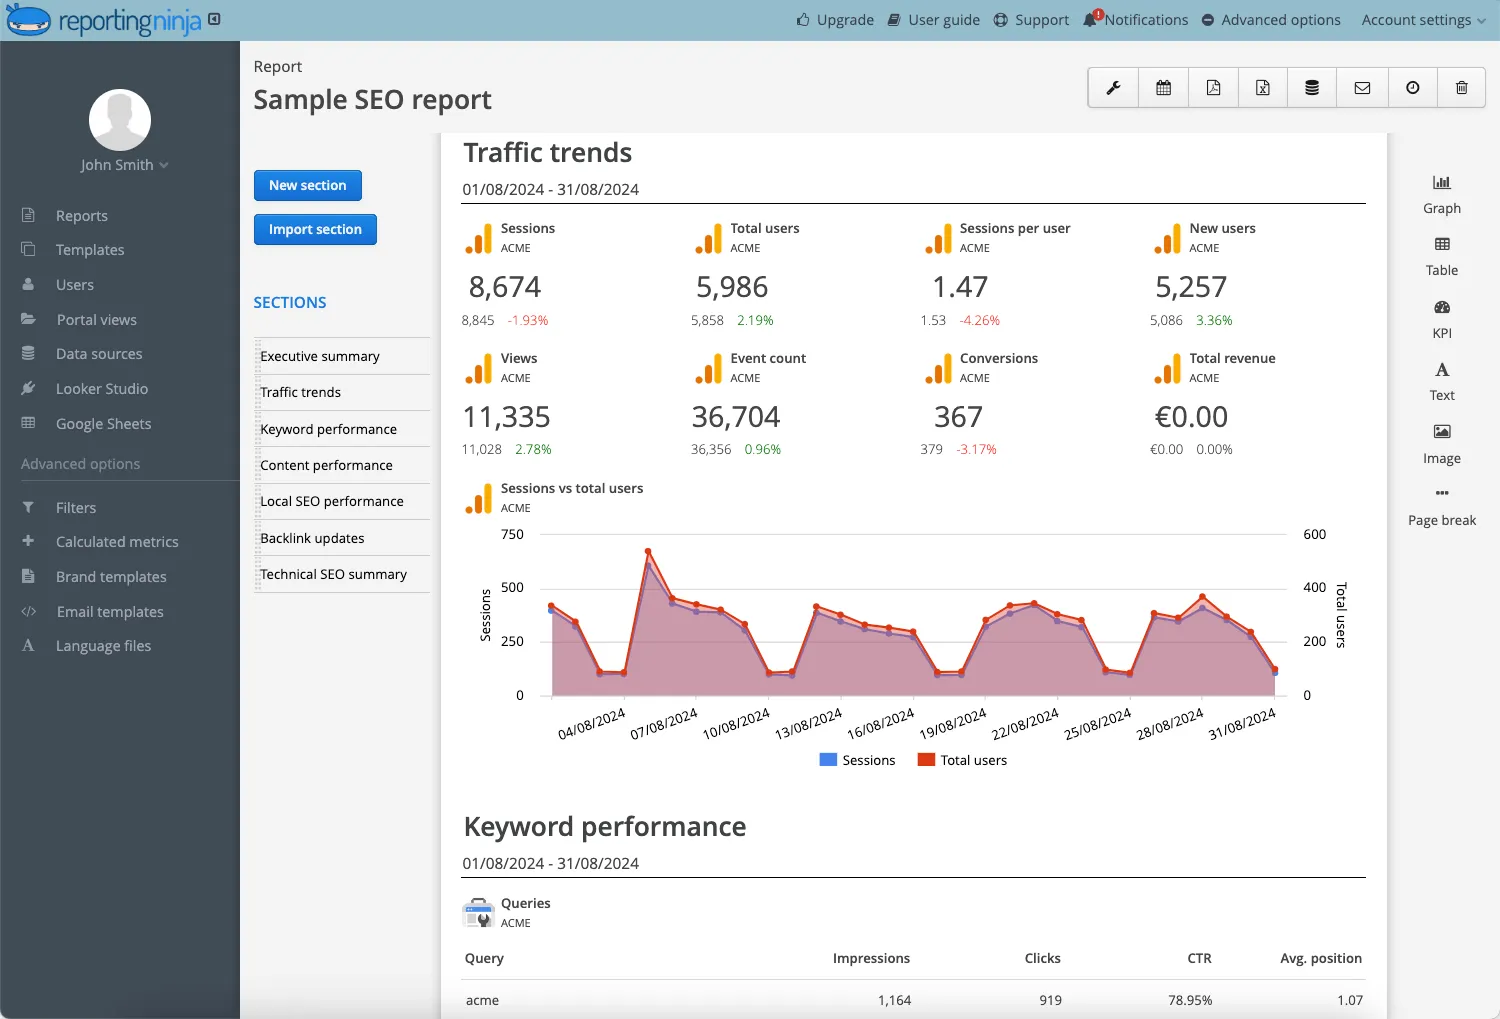
Organic traffic, keyword rankings, click-through rate, impressions, top landing pages, average position, and new vs. returning visitors.
Tracks how your email content drives engagement and conversions across campaigns. It helps you compare newsletter performance, test variables like subject lines, and understand how well each message supports your funnel.
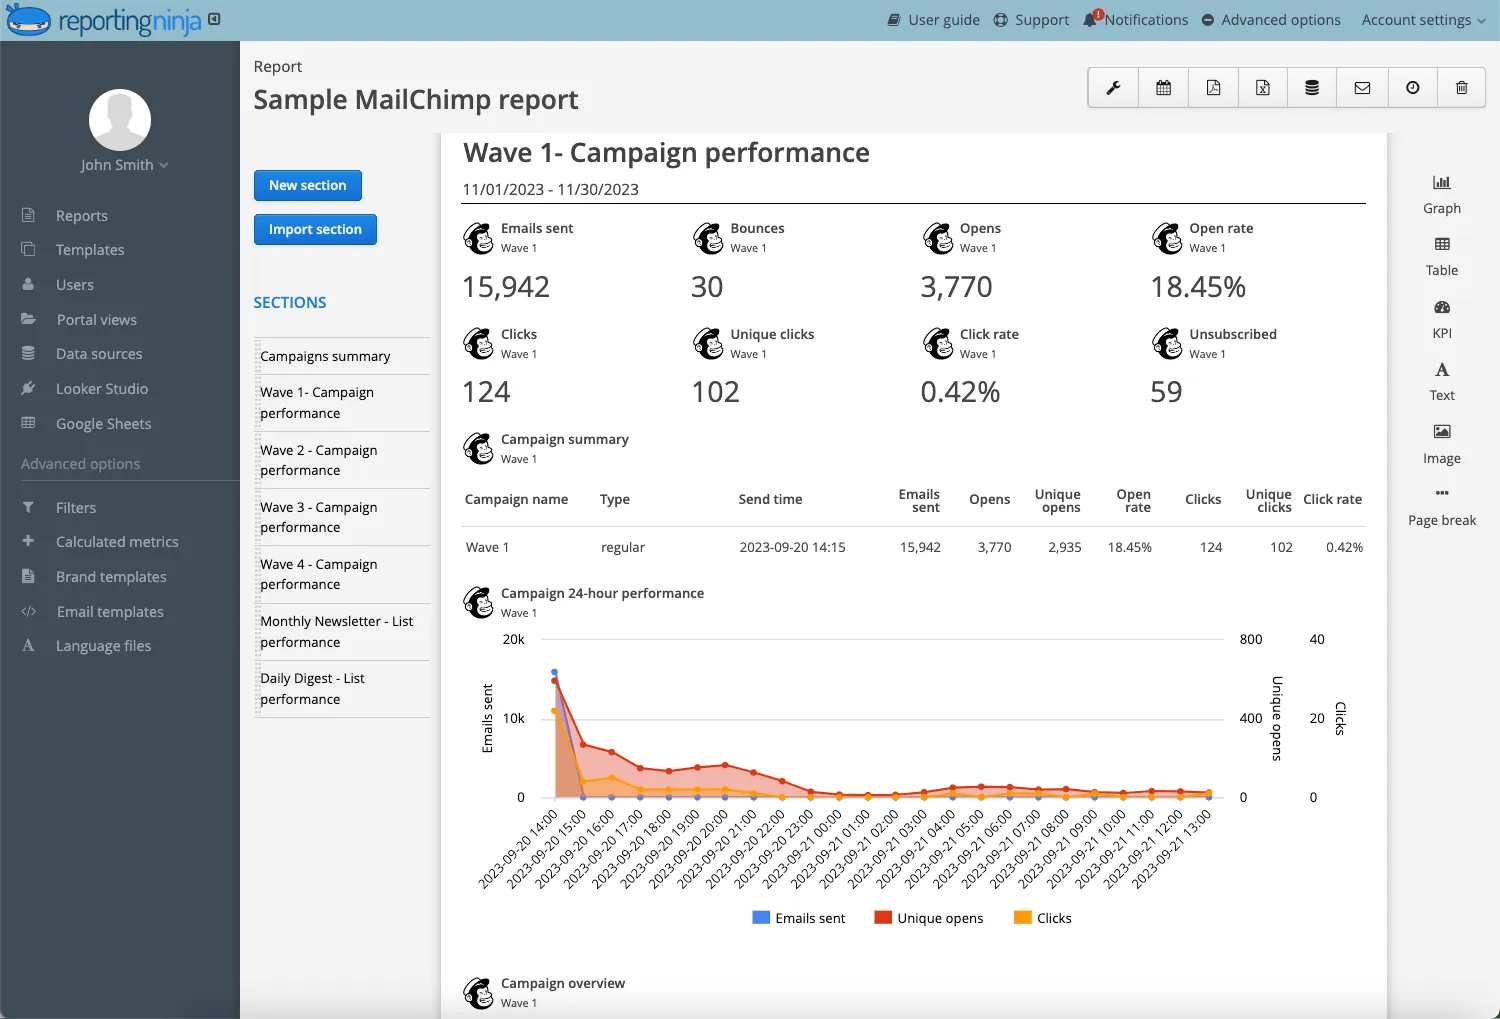
Open rate, click rate, unsubscribe rate, conversion rate, list growth, and audience segments.
Shows which pieces of content deliver real business value. It ties performance data back to revenue so you can prioritise formats and channels that make the biggest impact. This dashboard is often used in reporting to leadership and for planning new investments.
To understand how this fits into your broader strategy, you can read our foundational guide on marketing measurement for data-driven teams.
Cost per piece, leads generated, influenced revenue, customer acquisition cost, lifetime value, and deal velocity.
If you manage data across SEO, email, social media, and analytics tools, Reporting Ninja brings those metrics into one place. You can connect your sources once, automate updates, and create dashboards without relying on spreadsheets or manual exports. This gives teams a consistent, reliable view of performance and reduces the time spent maintaining reports.
Start your free 14-day trial today.
A dashboard helps you monitor performance across channels and make decisions based on clear, consistent data. It removes the friction of switching between tools and gives teams a single source of truth for content results.
A dashboard shows which pages and formats generate traffic, engagement, and conversions without digging through multiple platforms. You can quickly identify high-performing content, understand why it works, and spot pages that need refinement. This makes it easier to allocate resources to the formats and topics that move your metrics.
Dashboards reveal momentum changes early. Shifts in organic visibility, declining engagement, or changes in user behaviour become visible at a glance. Instead of waiting for month-end reports, teams can update, expand, or reposition content while it still has traction.
A dashboard connects content activity to business outcomes. By comparing performance and cost across formats, you can see where budget delivers the highest return and where results fall short. This helps justify priorities, report to stakeholders, and make more confident investment decisions.
When teams work from a single dashboard, they rely on the same numbers and the same interpretation of performance. This reduces guesswork, prevents siloed reporting, and supports better planning across SEO, content, email, and paid teams. Everyone understands what’s working and why.
Automating updates removes the need for weekly exports, spreadsheet fixes, or reconciling conflicting data from different tools. A dashboard keeps everything current so teams can spend more time analysing results and less time maintaining reports.
With the right metrics in one place, you can react faster, plan smarter, and build content that consistently supports your growth goals.
Too many teams jump into reporting without asking a simple question: what decisions should this dashboard help you make? The steps below help you build a setup that stays accurate, easy to read, and genuinely useful for day-to-day performance decisions.
Reporting Ninja connects your channels, updates your metrics automatically, and keeps your dashboard consistent without manual exports or spreadsheet maintenance.
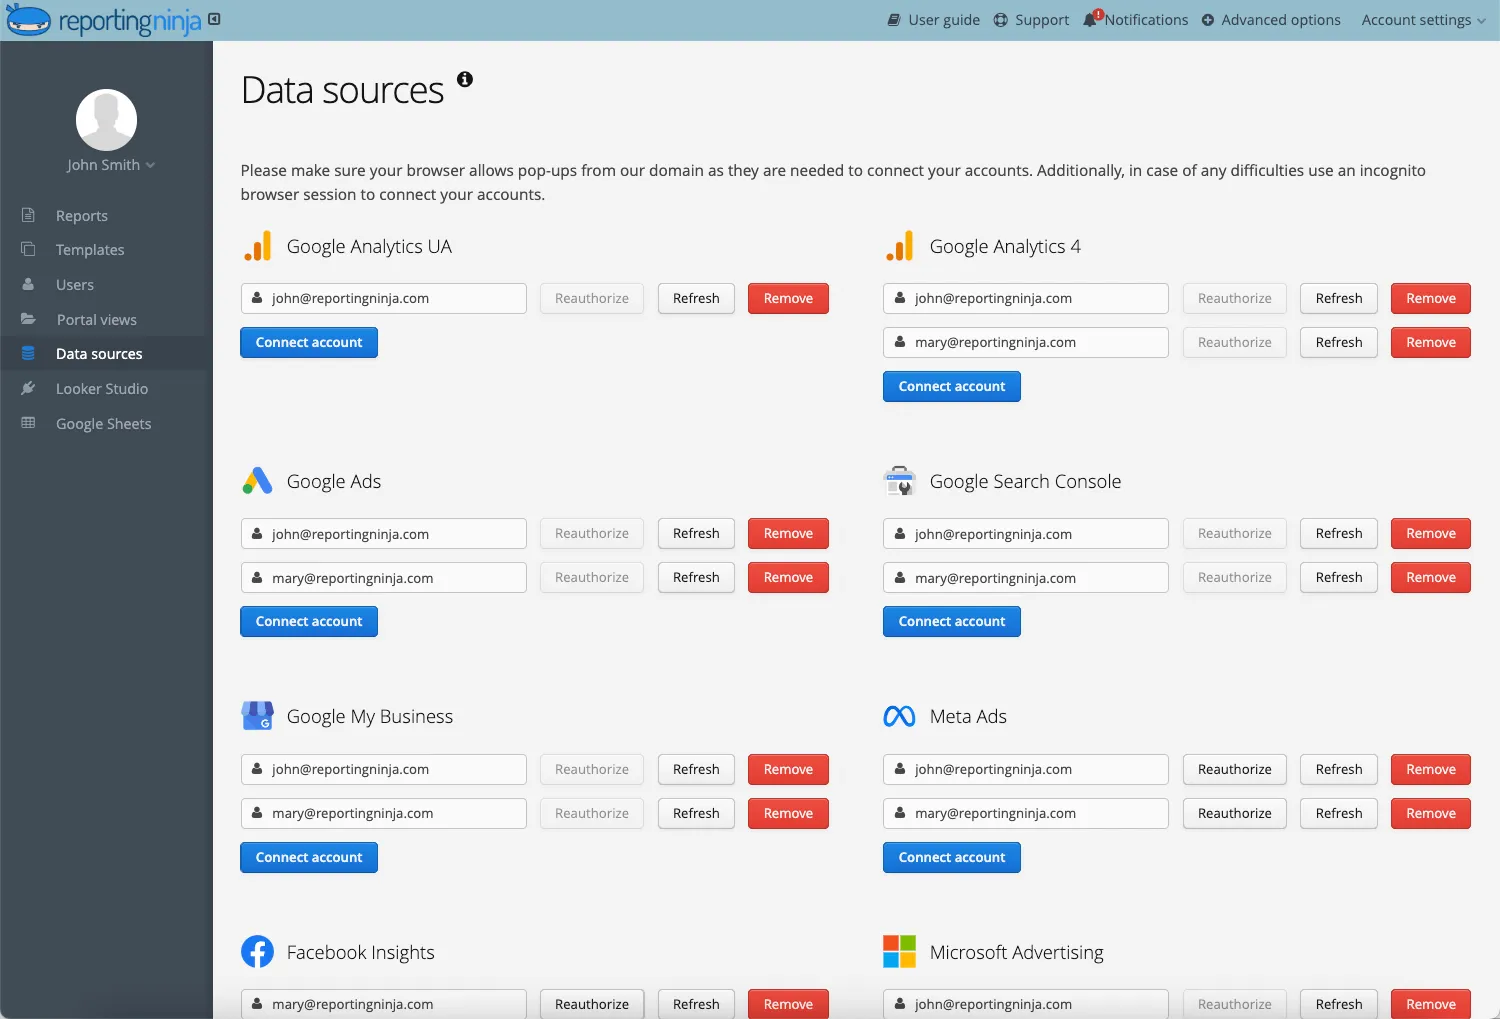
Identify the platforms you need to track, such as analytics tools, SEO platforms, email providers, and social channels. Connect them once in Reporting Ninja, so your dashboard can pull data automatically. This reduces the risk of mismatched numbers and removes the ongoing task of exporting and cleaning data.
Select metrics that reflect progress toward your goals rather than tracking everything available. Ask yourself: if a metric changes, would it affect a decision you make? Focus on indicators tied to traffic quality, engagement depth, conversions, or revenue. A focused metric set keeps dashboards clear and avoids distracting vanity numbers.
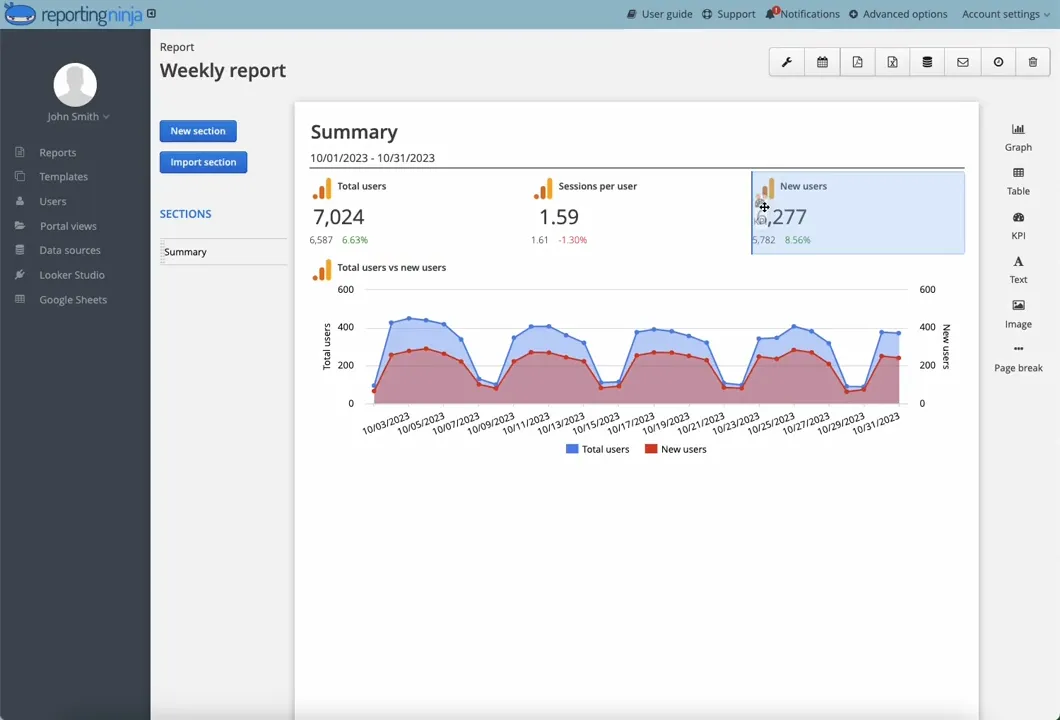
Organise your dashboard so trends are visible at a glance. Group related metrics together, such as SEO performance, email engagement, or funnel progression. Use simple visualisations and keep the layout clean so stakeholders can scan results quickly without needing explanation.
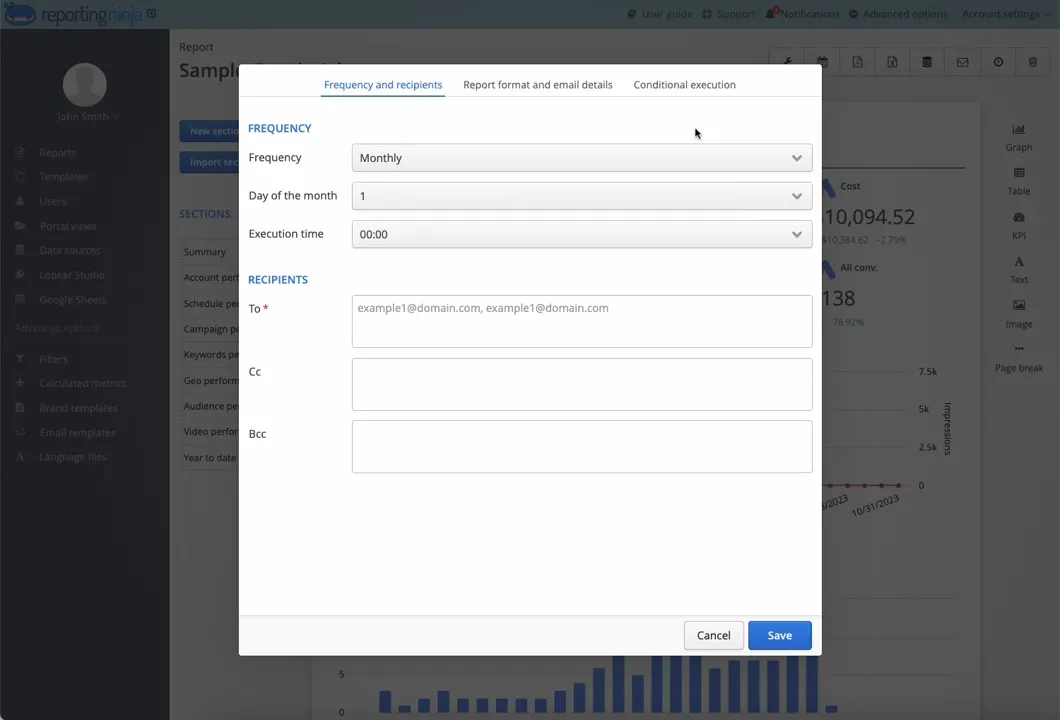
Schedule data refreshes and automated reports so teams receive updates without requesting them. Automated reporting creates a consistent cadence for performance reviews and eliminates the manual work of sending weekly status updates.
A well-structured dashboard gives you accurate, timely insight into how your content performs and helps teams make decisions with confidence. Once the core setup is in place, you can refine the layout and metrics as your strategy evolves.
{{cta-block-v1}}
Once your dashboard is live, Reporting Ninja keeps your data updated automatically so you can monitor performance across channels in real time. You can compare campaigns, track how content influences key metrics, and share clear reports with your team without managing spreadsheets or exporting files.
A strong metrics dashboard stays focused, clear, and aligned with your goals. These best practices help you build a setup that supports accurate reporting and faster decision-making.
Track metrics that influence strategy, not vanity numbers that look impressive but don’t guide action. Focus on indicators tied to traffic quality, engagement depth, conversions, and revenue. This keeps your dashboard relevant as priorities evolve and prevents decision fatigue caused by too much data.
“Less is more when it comes to Dashboard design. Aim for a single screen with no more than nine views. Limit the number of colors and use consistently sized graphs. With each graph, ask yourself, is it necessary to show all the historical data if the audience only needs Real-time data?” - Muhammad Suhail, Product and Content expert
Content programs change over time, and your dashboard should change with them. As new channels launch or priorities shift, revisit what you track and remove metrics that no longer support your goals. Regular reviews keep your dashboard aligned with your strategy rather than locked to outdated assumptions.
A well-maintained dashboard becomes a reliable guide for optimisation. When your metrics, layout, and structure stay focused, your team can spend more time acting on insights and less time interpreting data.
Building your own dashboard gives you full control, but it also requires ongoing maintenance and technical oversight. Using a tool streamlines the process by handling data connections, updates, and visualisation for you. Here’s how both approaches compare.
Creating a dashboard from scratch offers flexibility, but the setup takes time and often involves troubleshooting API limits, field mapping, and visualisation tools. As platforms change, you need to update your connections and fix errors to keep data accurate. This becomes an ongoing technical workload for teams that already manage multiple channels.
Spreadsheets can work for simple reporting, but they break easily as data volume grows or new channels are added. Formulas become harder to maintain, dashboards slow down, and small changes can cause inconsistencies. This makes them unreliable for long-term or multi-channel reporting.
Reporting Ninja manages your data connections, refreshes your metrics automatically, and keeps dashboards consistent without manual exports or spreadsheet fixes. It handles the operational side of reporting so teams don’t have to monitor sync issues or rebuild broken formulas. This frees you to spend more time analysing performance patterns and planning improvements across channels.
Using a dedicated tool like Reporting Ninja removes the friction of manual reporting and gives you a more dependable foundation for decision-making. Whether you’re comparing channels, planning campaigns, or sharing updates with stakeholders, automation helps your dashboard stay accurate and actionable.
Content teams don’t need more data. They need clearer signals. A dashboard turns scattered metrics into direction, helping you see what to scale, what to fix, and what to stop doing altogether.
Reporting Ninja gives you that clarity by keeping your data connected and current, without the manual work that slows momentum. When your reporting becomes frictionless, your decisions get sharper. And when your decisions get sharper, your content starts compounding.
The question is simple: if you had a clearer view of performance tomorrow, what would you change first?
You can explore that answer with a free 14-day Reporting Ninja trial and see how connected, automated reporting transforms your visibility.
Sign up for a 15 days free trial. No credit card required.

Build and automate amazing custom reports in a few clicks. Save time, be more productive, impress your clients.