Analytics
January 13, 2026
Whatagraph pricing plans: Full breakdown & features (2026 review)


If you’re looking up Whatagraph pricing plans, you’re probably trying to answer one simple question: what will this cost your team once you connect all your client accounts?
Here’s the short answer. Whatagraph’s paid plans start at 249€/month (monthly billing), scale to 624€/month, and then move to custom pricing at the top tier. The bigger factor being the number of credits (data sources), not users or report volume.
In this review, you’ll get the full plan breakdown, what each tier includes, and a practical way to translate “credits” into what you’ll actually pay.
Whatagraph has three paid tiers: Start, Boost, and Max. Pricing is listed in euros and varies based on billing frequency.
The main cost driver is source credits (connected data sources), not seats. All paid plans include unlimited users and unlimited reports, so you typically upgrade when you need more data sources or advanced integrations.
Reporting Ninja is a practical alternative for teams comparing Whatagraph alternatives, especially if credit-based pricing feels limiting as you scale.
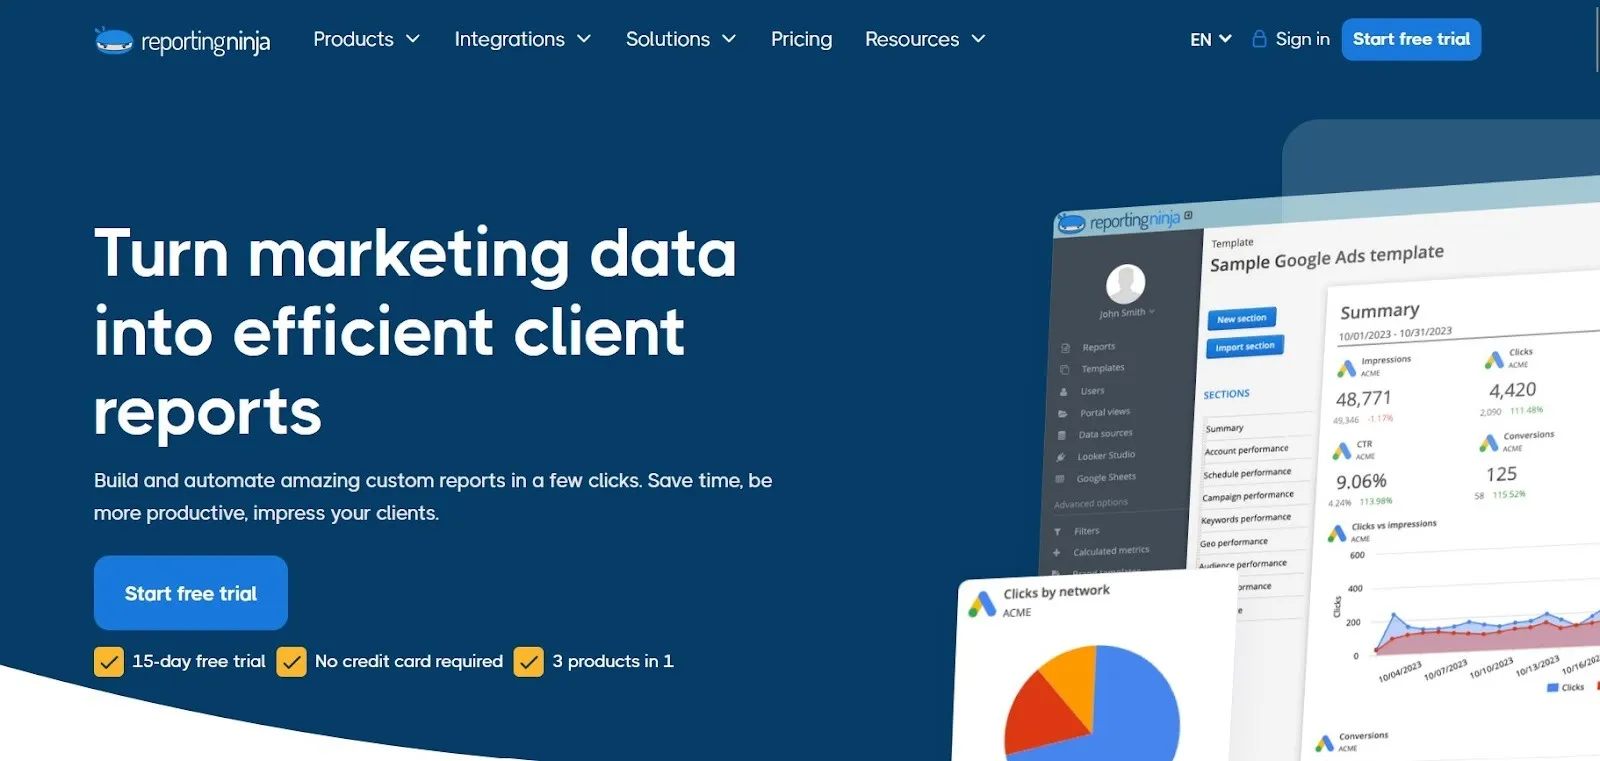
Instead of tying costs to abstract “source credits”, Reporting Ninja prices plans based on the number of connected accounts per platform type. This makes costs easier to forecast as you add clients or channels.
The platform is built for agencies and performance teams that need fast, repeatable marketing reports across multiple formats. Reporting Ninja is a 3-in-1 reporting setup:
What typically makes Reporting Ninja a better fit in comparison:
Reporting Ninja pricing
Start the free trial to see how Reporting Ninja builds client-ready reports across dashboards, Looker Studio, and Google Sheets in just a few steps.
{{cta-block-v1}}
Whatagraph’s pricing is mostly driven by how many data sources you need (credits). Each plan tier increases those limits and unlocks more advanced features for agencies managing multiple clients, more complex reporting setups, or higher-volume delivery.
The sections below break down the key pricing drivers so you can estimate the real cost before you commit.
Whatagraph pricing is built around source credits. In practice, this is the number of data sources you can connect across client accounts and platforms.
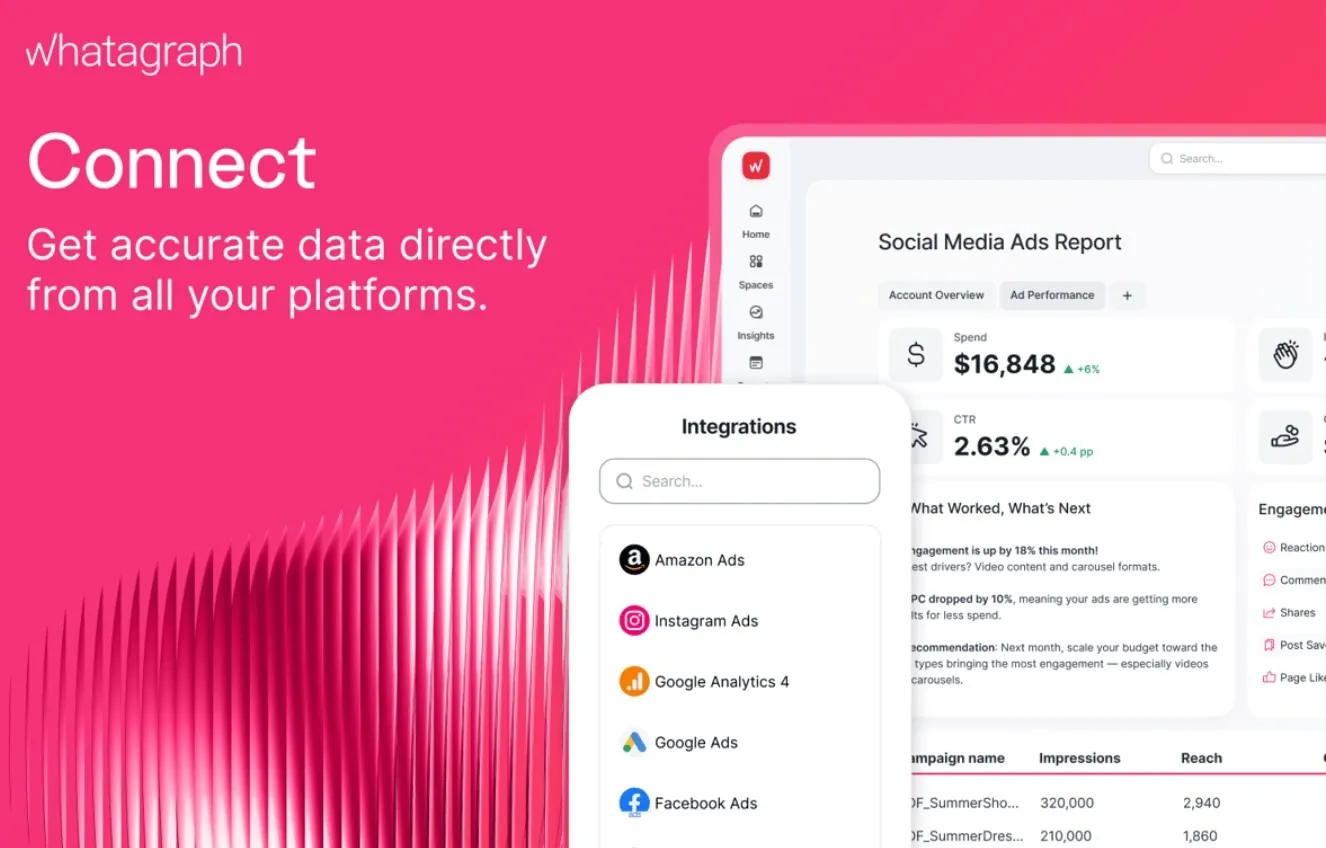
The Start plan includes 20 source credits, while Boost includes 60, and Max is custom. If you manage many clients or connect multiple ad accounts per client, you can hit these limits quickly, which is the most common reason teams move up a tier.
Example: what source credits look like for a typical agency
Start (20) won’t cover this; you’re pushed toward Boost (60). And, of course, if a few clients have multiple ad accounts (e.g., 2 Google Ads accounts, 2 Meta accounts), the total quickly moves up even further.
Whatagraph’s list price depends on how you pay.
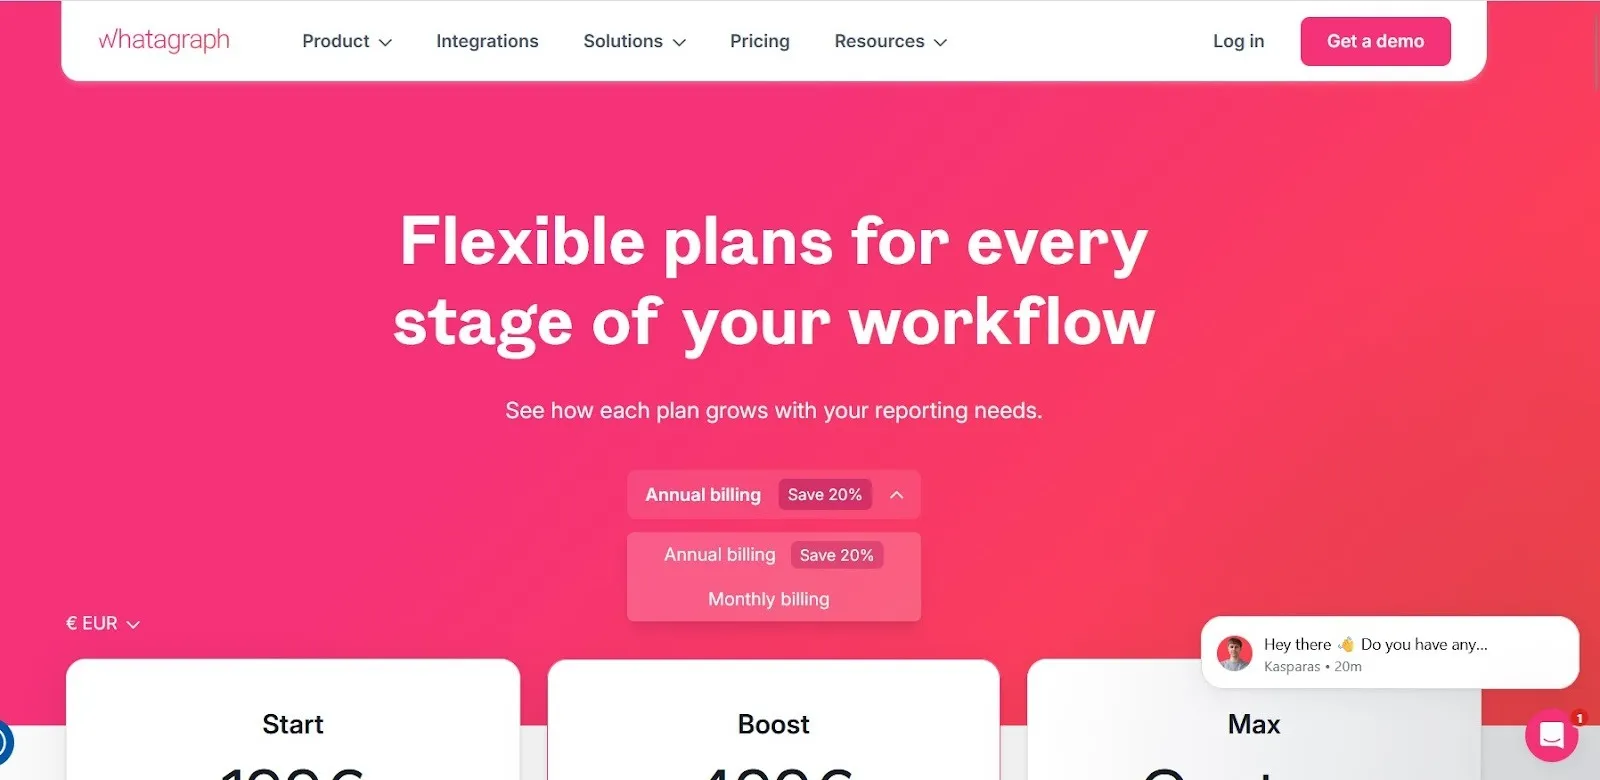
If you pay month-to-month, you pay significantly more for the same plan. This matters if you’re still validating the tool, because the “real” cost of trying it for a few months is closer to the monthly billing rate, not the discounted annual price.
Whatagraph plans don’t just increase your source credits. Higher tiers also unlock more advanced reporting features, stronger branding controls, and higher-touch support.
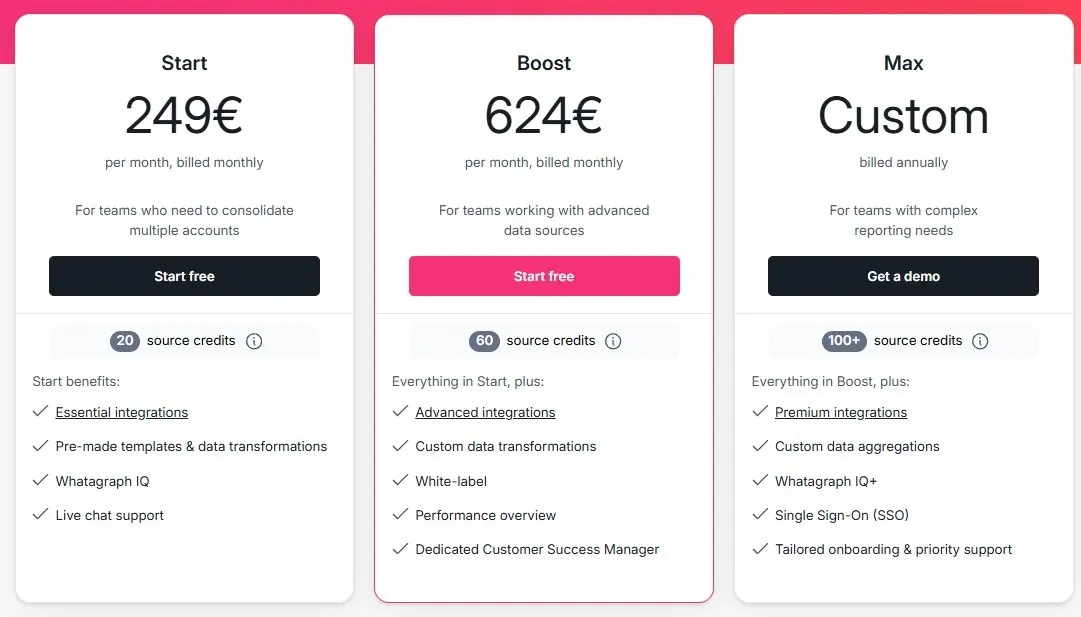
In practice, this means you may need Boost (or Max) even if your credit needs are modest, simply because a required feature is locked behind a higher plan. This is common for agencies that need more complex data transformations, client-facing branding, or more direct support.
Examples of what typically changes by tier:
Whatagraph’s Max tier isn’t a fixed price. It’s a custom plan, which typically means the cost depends on your reporting setup and the scale of what you’re trying to connect and automate.
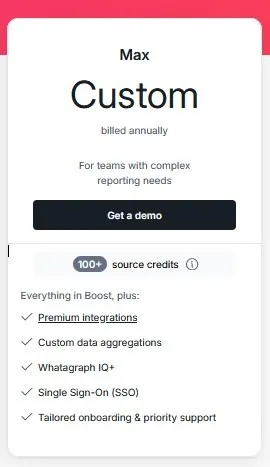
If you’re close to the Boost limits, or you need enterprise-level requirements (more sources, stricter permissions, higher support expectations), Max is where pricing becomes a negotiation rather than a published rate.
What changes when pricing becomes custom?
Whatagraph’s headline pricing is straightforward, but your total spend can rise depending on how you use the platform. The biggest “hidden” costs are usually tied to scaling and plan constraints rather than surprise fees.
Whatagraph is a polished reporting platform with clear strengths, but its pricing model can be a limiting factor as you scale.
If pricing predictability is a concern as your client base grows, explore how Reporting Ninja approaches reporting without credit-based limits. Start the free trial to see how its account-based pricing works in real reporting workflows.
Whatagraph is best suited to teams that manage recurring marketing reporting and rely heavily on automated reporting tools to deliver dashboards and reports at scale.
If your client roster is relatively steady and you know roughly how many ad accounts and analytics sources you’ll connect, Whatagraph can be a good fit. The unlimited users and reports help when multiple team members need access, while credits keep pricing tied to connected sources rather than seats.
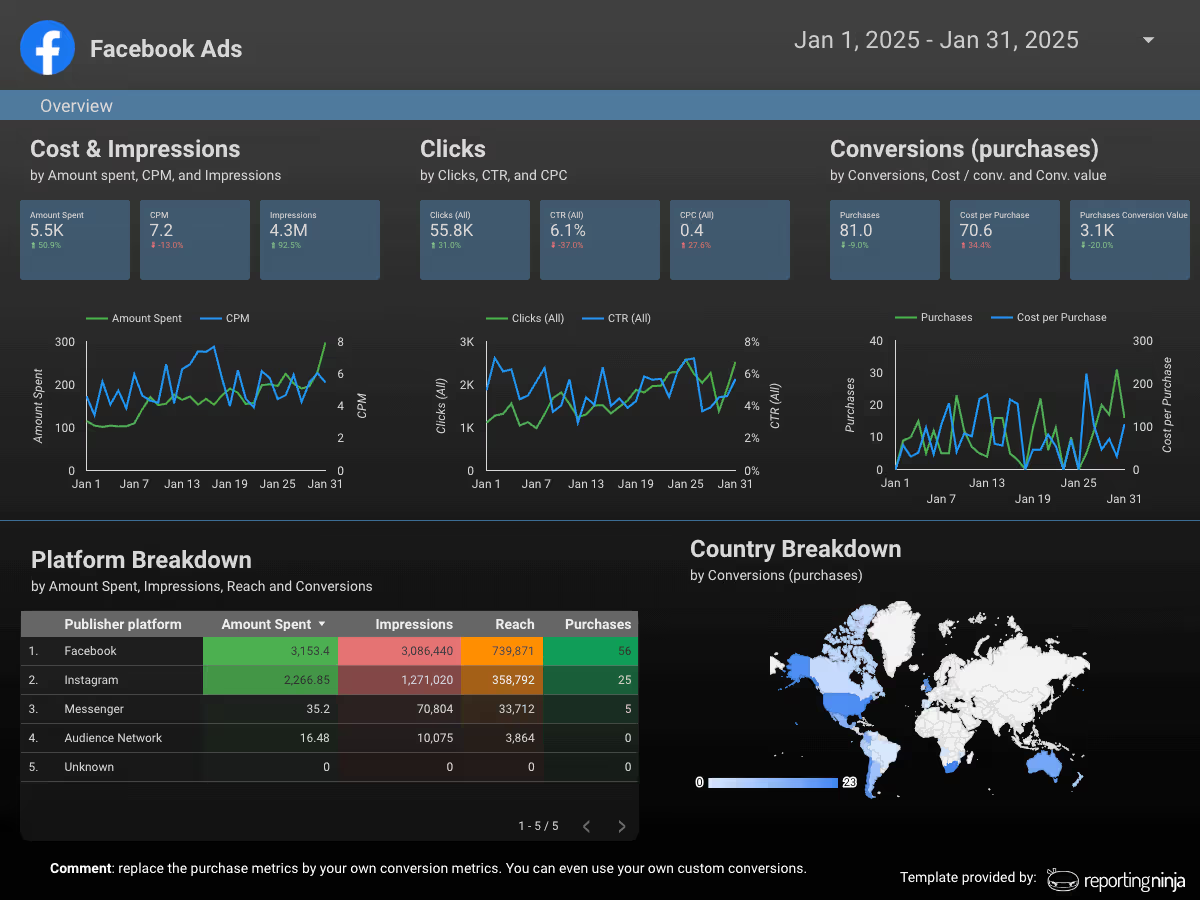
If you run reporting across several channels (Google Ads, Meta, GA4, etc.) and need consistent dashboards for leadership or stakeholders, Whatagraph’s tiered plans can work well. It’s most cost-effective when your source count stays within the included credit range.
If you operate at a higher scale and expect to exceed Boost limits, Max may be the right tier. This is typically for agencies that need custom source limits, more direct support, and enterprise-style requirements like stricter permissions.
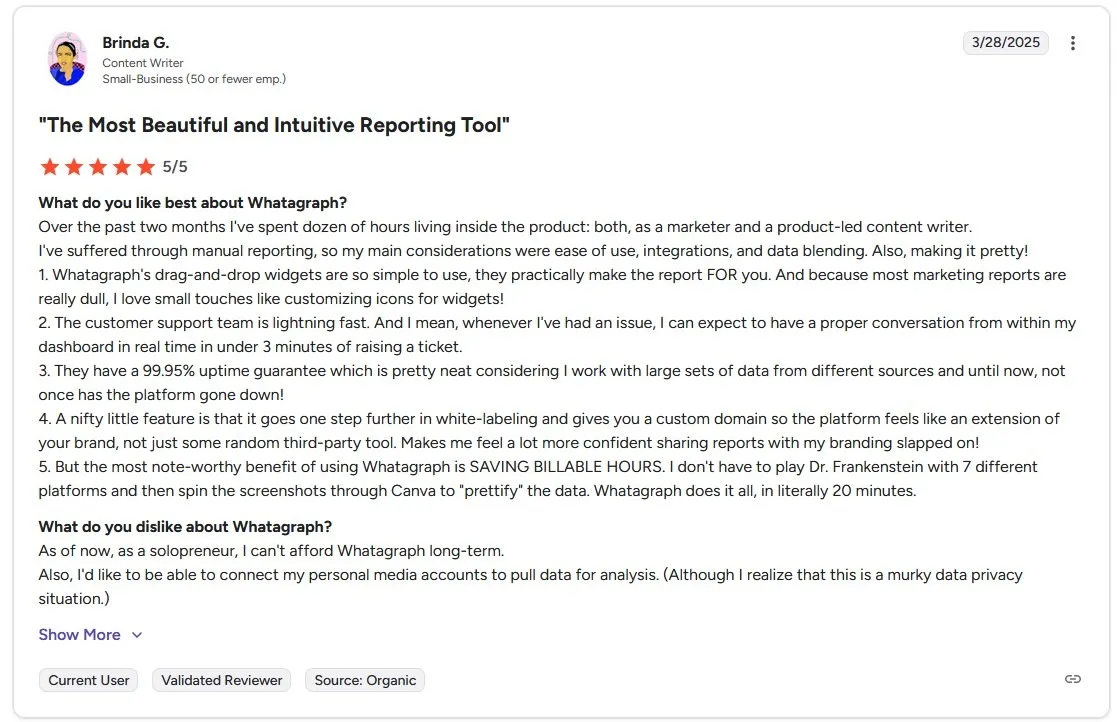
Across review platforms, Whatagraph is consistently praised for saving time on recurring client reporting and for responsive support.
The most common complaints are about pricing value at scale, occasional data connection friction, and gaps in coverage for certain ad platforms or advanced customization needs.
One G2 reviewer who tested the platform extensively over several months highlights Whatagraph’s drag-and-drop report builder as a major time-saver, noting how quickly client-ready dashboards can be created without manual formatting.
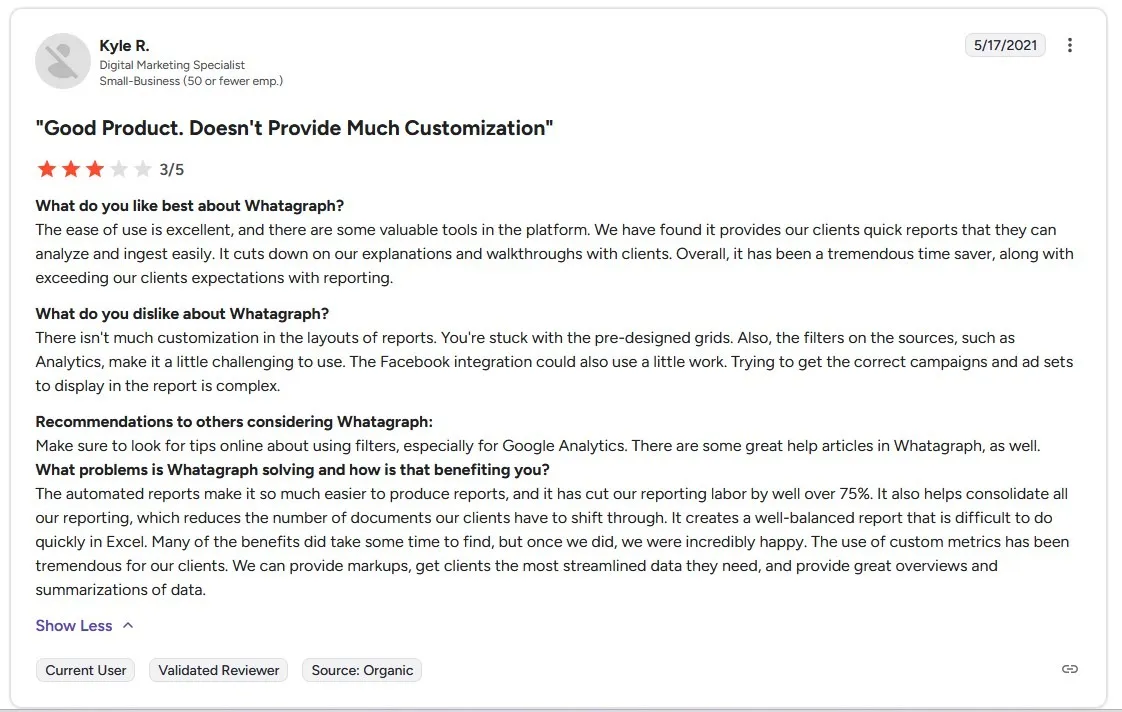
Negative feedback on G2 most often focuses on flexibility and setup complexity rather than core reporting value. One review points out that report layouts are constrained by pre-defined grids, which can limit customization for teams with specific formatting needs.
The same feedback mentions that source-level filtering, especially in Google Analytics, takes time to learn, and that configuring Facebook Ads data to show the right campaigns and ad sets can be more involved than expected.
If you want client-ready reporting without pricing tied to source credits, Reporting Ninja is a practical alternative. It’s designed for marketers and agencies that need repeatable reporting workflows, with clear pricing that starts lower and scales predictably as you add accounts.
What Reporting Ninja tends to do better for the price:
Reporting Ninja gives you connectors built specifically for Looker Studio. The key benefit is speed: you can build repeatable templates, connect the same platform types across clients, and keep delivery consistent without rebuilding reports every month.
If your team still uses Sheets for custom analysis, pacing dashboards, or internal QA, the Google Sheets add-on is a strong advantage. You can pull data into Sheets in a structured way, then use it for custom calculations, internal reporting, or sharing without forcing everything into a dashboard tool.
Reporting Ninja pricing starts at $20/month, and plans scale mainly by the number of connected accounts of each type (for example, Google Ads, Meta Ads, GA4).
Setup: 30 clients, each with Meta Ads + Google Ads (60 total sources/accounts), white labeling required.
Whatagraph can work if your source count stays stable. But if you scale by adding clients and channels, credits become the real cost driver and budgeting gets tougher—especially at Max. For more predictable scaling, Reporting Ninja is a practical alternative.
Start the free trial and test your real account mix end-to-end.
{{cta-block-v1}}
Sign up for a 15 days free trial. No credit card required.

Build and automate amazing custom reports in a few clicks. Save time, be more productive, impress your clients.