Analytics
March 17, 2026
How to analyze marketing data (step-by-step framework)


Struggling to turn dashboards into decisions?
How to analyze marketing data comes down to a clear framework: define the goal, clean the data, prioritize revenue metrics, and validate trends before acting.
In this guide, you’ll learn how to identify what’s actually driving revenue, where budget is being wasted, and how to make confident decisions without second-guessing your data.
When your data is structured and analyzed properly, the impact shows up quickly: in how you spend, optimize, and report on performance.
These gains compound over time. Better allocation improves efficiency, faster corrections reduce wasted spend, and clearer reporting makes future decisions easier.
{{cta-block-v1}}
Analyzing marketing data isn’t about more reports. It’s about following a process that connects metrics to revenue. Here’s the framework.
Start with a clear business objective. Not “How is Facebook performing?” but:
Your analysis should answer one primary question tied to revenue or growth.
Here’s a simple alignment table:
Before analyzing performance, validate the data itself.
Marketing decisions built on inconsistent tracking, duplicate leads, or broken UTMs will distort every conclusion. Start with a structured audit:
Missing or misconfigured tracking can make a channel look unprofitable when it isn’t — or profitable when it’s not.
Here’s a quick audit checklist:
Clean data is NOT just a ‘nice-to-have’. It determines whether optimization decisions increase revenue or just shift the budget blindly.
Once your data is reliable, you stop second-guessing your reports and start making decisions faster.
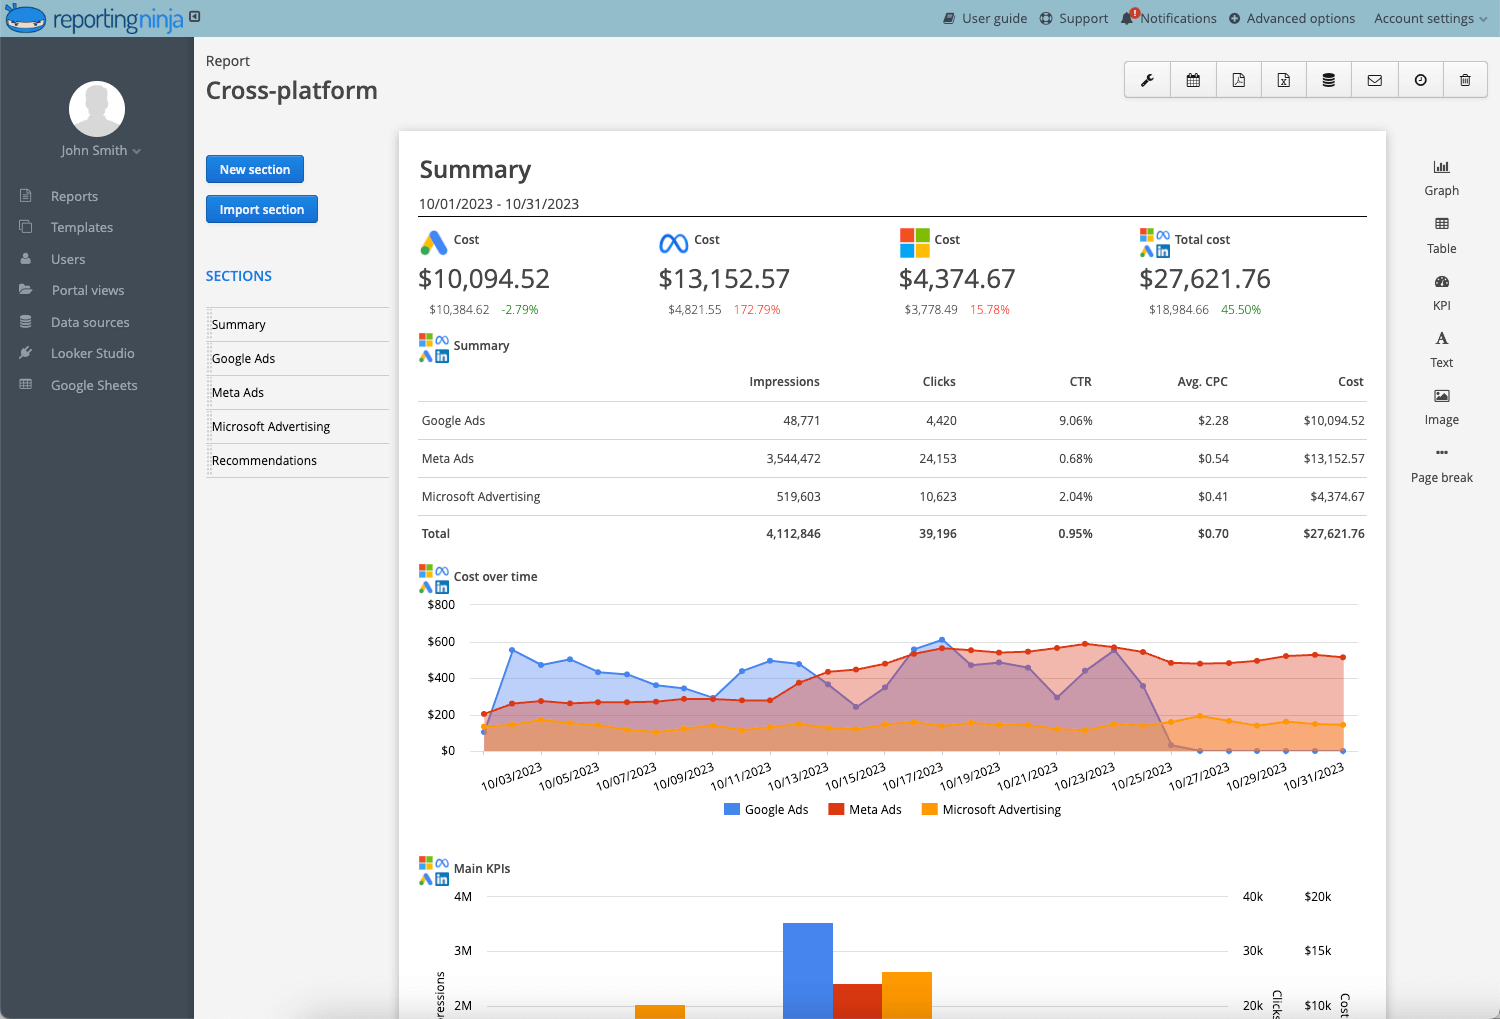
Channel dashboards don’t tell the full story. They show performance in isolation.
To analyze marketing data properly, you need one unified view that combines:
Without centralization, you risk double-counting conversions, misreading assisted channels, or optimizing toward platform-reported ROAS instead of actual revenue.
Here’s the difference:
Tools like Reporting Ninja consolidate your data into a single custom report, so you can analyze performance rather than build reports. Integrating specialized data visualization softwares helps bridge the gap between fragmented platform metrics and clean, actionable reports.
This isn’t theoretical. 41% of businesses already use AI-driven tools for data discovery, saving 5–10 hours per week by automating repetitive analysis tasks.
Explore how a metrics dashboard can cut hours of manual reporting in real workflows.
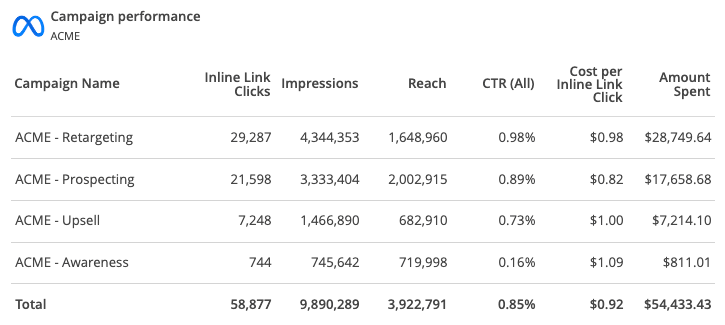
Top-line averages hide problems.
If your blended conversion rate drops, the issue could come from several places:
Break performance down before drawing conclusions.
Here’s a simple segmentation structure:
Comparing blended CAC across all segments can hide a profitable campaign inside an underperforming group. Segmented reporting prevents overcorrection. Instead of cutting the budget broadly, you isolate the underperforming variable and adjust precisely.
The goal isn’t more data; it’s cleaner comparisons.
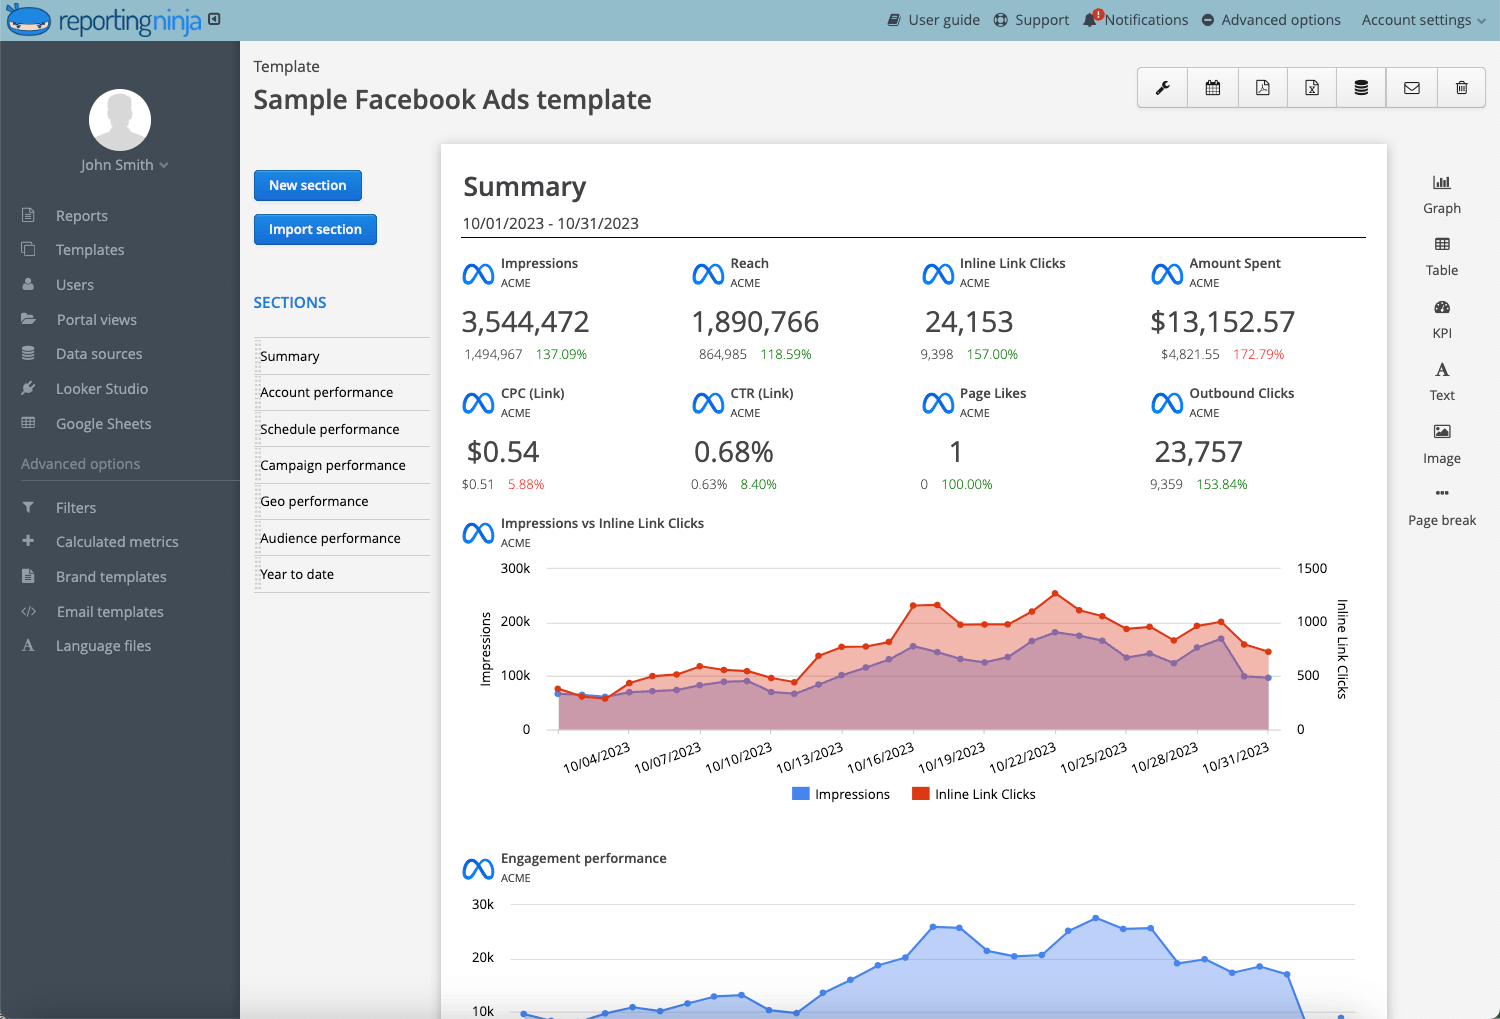
Not all metrics deserve equal weight. For example, in content marketing analytics, clicks and impressions can be misleading if they’re not tied to actual conversions or revenue.
Clicks, impressions, and engagement rates can signal activity, sure. But they don’t confirm the business impact. Your analysis should prioritize metrics tied to revenue, pipeline, or customer value.
Here’s a simple comparison:
For example, a campaign generating 2,000 leads at a low cost may look successful. But if only 2% convert to opportunities, your effective acquisition cost rises sharply.
Always evaluate metrics in the context of downstream performance. A high CTR with a low conversion rate usually points to landing page misalignment, not campaign success.
Impact-focused reporting leads to better decisions. Instead of scaling volume, you scale results.
A strong week doesn’t confirm scale. A weak day doesn’t justify cutting spend. Using data visualization to map week-over-week or month-over-month trends helps separate noise from signal and makes anomalies immediately visible.
Start with:
Here’s a simple example:
On the surface, Week 2 looks worse. But if it included a creative test or audience expansion, you need a longer window before drawing conclusions.
Short-term volatility is common in paid media. Decisions based on 3–5 day windows often lead to overcorrection.
Trend-based reporting ensures you optimize based on sustained performance, not short-term fluctuation.
Most platforms default to their own attribution models. Meta may use a 7-day click window. Google Ads may show data under a different conversion setting. Your CRM may report closed revenue under yet another model.
If you scale based on platform-reported ROAS alone, you risk over-crediting one channel.
Studies increasingly confirm this risk. According to DAC Group’s 2026 Marketing Trends Report, 15–30% of conversions are often over-attributed in last-click models, meaning platforms may claim revenue that would have happened even without that final interaction.
Start by checking:
Here’s a simplified comparison:
Channels that introduce demand often appear weaker in last-click reporting but drive long-term growth. This is where centralized reporting becomes critical. When ad data and CRM revenue live in one report, you can easily execute cross-channel marketing reporting to compare platform claims against actual pipeline contribution.
Only scale once attribution matches revenue reality.
Move from fragmented reports to structured analysis. Try Reporting Ninja and see your marketing performance in one place.
{{cta-block-v1}}
Even experienced teams misread performance. The issue isn’t access to data; it’s how it’s interpreted.
Here are the most common analysis mistakes:
Avoiding these mistakes doesn’t require more data. It requires disciplined interpretation.
Manual reporting slows analysis. When data sits across ad platforms, analytics tools, and your CRM, teams spend more time compiling reports than interpreting results.
Reporting Ninja brings your cross-channel data into one structured report so you can track CAC, ROAS, revenue, and pipeline in a single view while eliminating manual exports and spreadsheets.
Focus on insights, not admin. Start your free trial of Reporting Ninja today.
{{cta-block-v1}}
Start with a clear business question. Define the decision you need to make and the revenue metric tied to it before opening any dashboard
It depends. Review high-level trends weekly, but evaluate performance decisions using rolling 30–90 day windows to avoid reacting to short-term volatility
Revenue-linked metrics matter most. Focus on CAC, ROAS, customer lifetime value, conversion rate, and pipeline contribution (not just clicks or impressions).
Because attribution determines credit. Different models assign value to different touchpoints, which can change which channels appear profitable
No. Analyze channel performance individually, but always validate results in a cross-channel view to avoid miscrediting assisted conversions.
Sign up for a 15 days free trial. No credit card required.

Build and automate amazing custom reports in a few clicks. Save time, be more productive, impress your clients.