Analytics
March 10, 2026
2026 Automated marketing reports: save time & impress clients


Still building marketing reports in spreadsheets at midnight?
Automated marketing reports fix that by pulling data from multiple platforms and sending structured dashboards on schedule. Instead of exporting numbers every week, you connect your channels once and let reports update automatically.
This guide covers the benefits of reporting automation, common workflow gaps, and how to build reports clients actually read.
Marketing teams are under pressure to prove ROI quickly. Automated reporting helps you do that without spending hours compiling spreadsheets.
HubSpot reports that 76% of organizations prioritize data-driven decision-making. Yet many marketing teams still rely on manual reporting workflows. That gap slows execution and increases the risk of errors.
Automated marketing reports close that gap.
Key advantages include:
Automation improves both efficiency and client experience.
Most reporting delays are not caused by strategy problems. They come from inefficient processes.
Disconnected tools, manual exports, and inconsistent metrics slow teams down and introduce avoidable errors.
Common marketing reporting gaps
As agencies grow, these issues compound. More clients mean more spreadsheets and more time spent rebuilding the same reports.
Tired of rebuilding your reports every month?
Reporting Ninja centralizes your data, standardizes templates, and sends reports on schedule so your reporting runs without manual work.
Start automating your marketing reports today. Try Reporting Ninja free.
{{cta-block-v1}}
Marketing reporting automation usually combines several layers of automation. Understanding these types helps teams build more efficient reporting workflows.
For deeper insights, see our guide to SEO automated reporting, discover the core principles of cross-channel marketing reporting, or learn how PPC tools simplify paid campaign analysis and performance tracking.
Luckily, setting up automated marketing reports doesn’t require complex data engineering.
Most agencies follow a straightforward workflow.
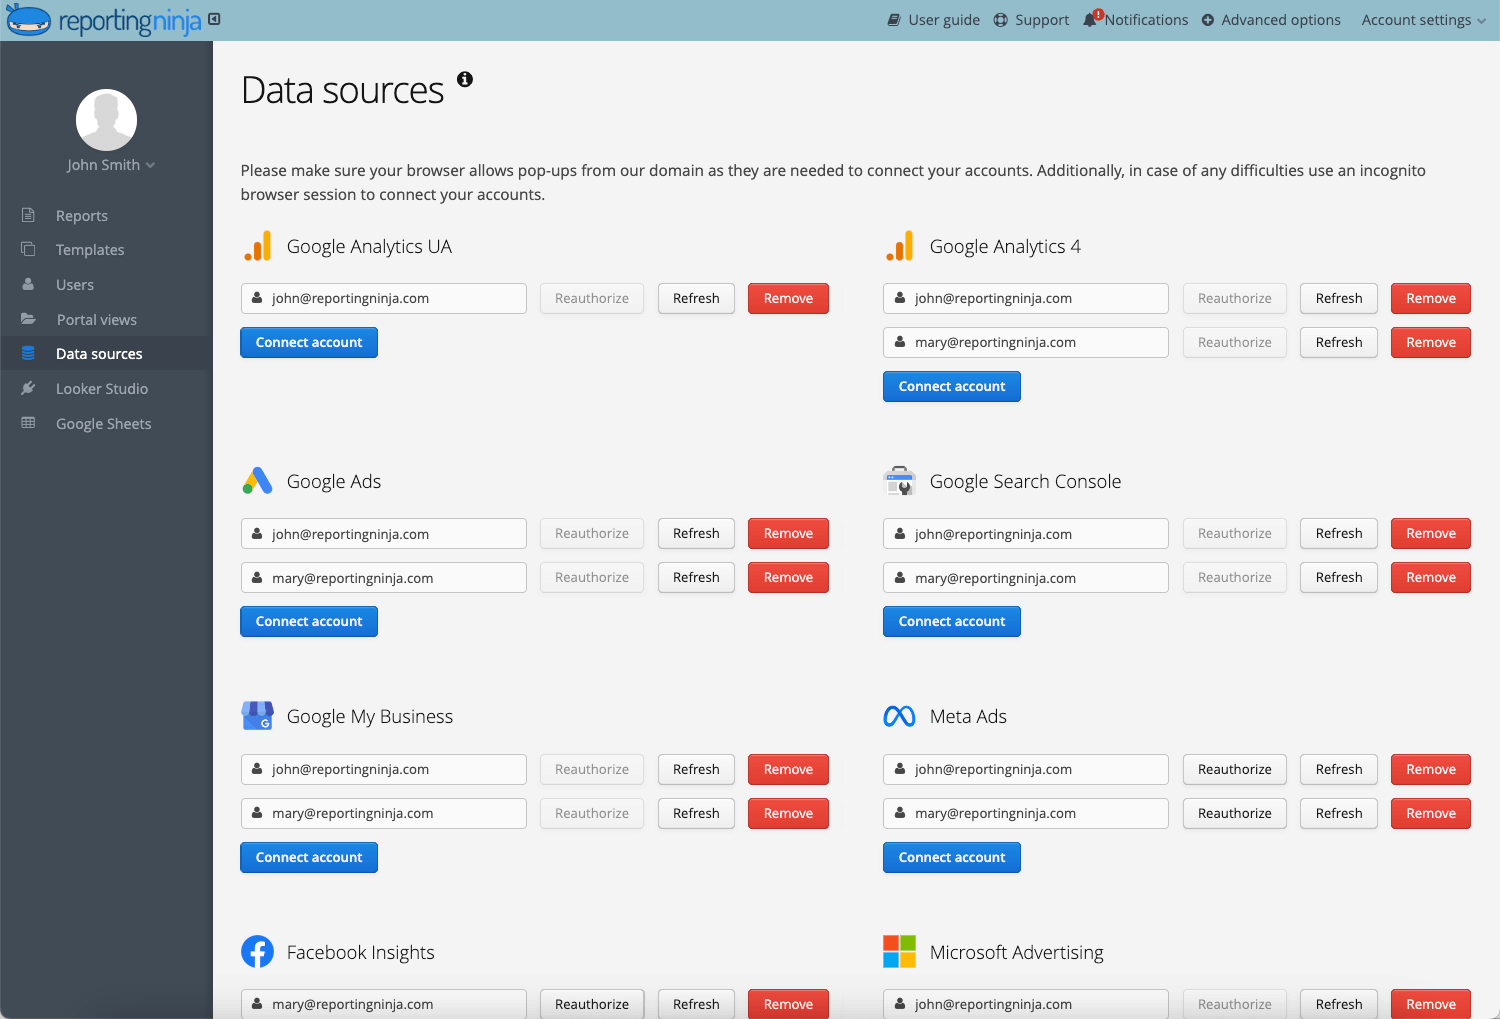
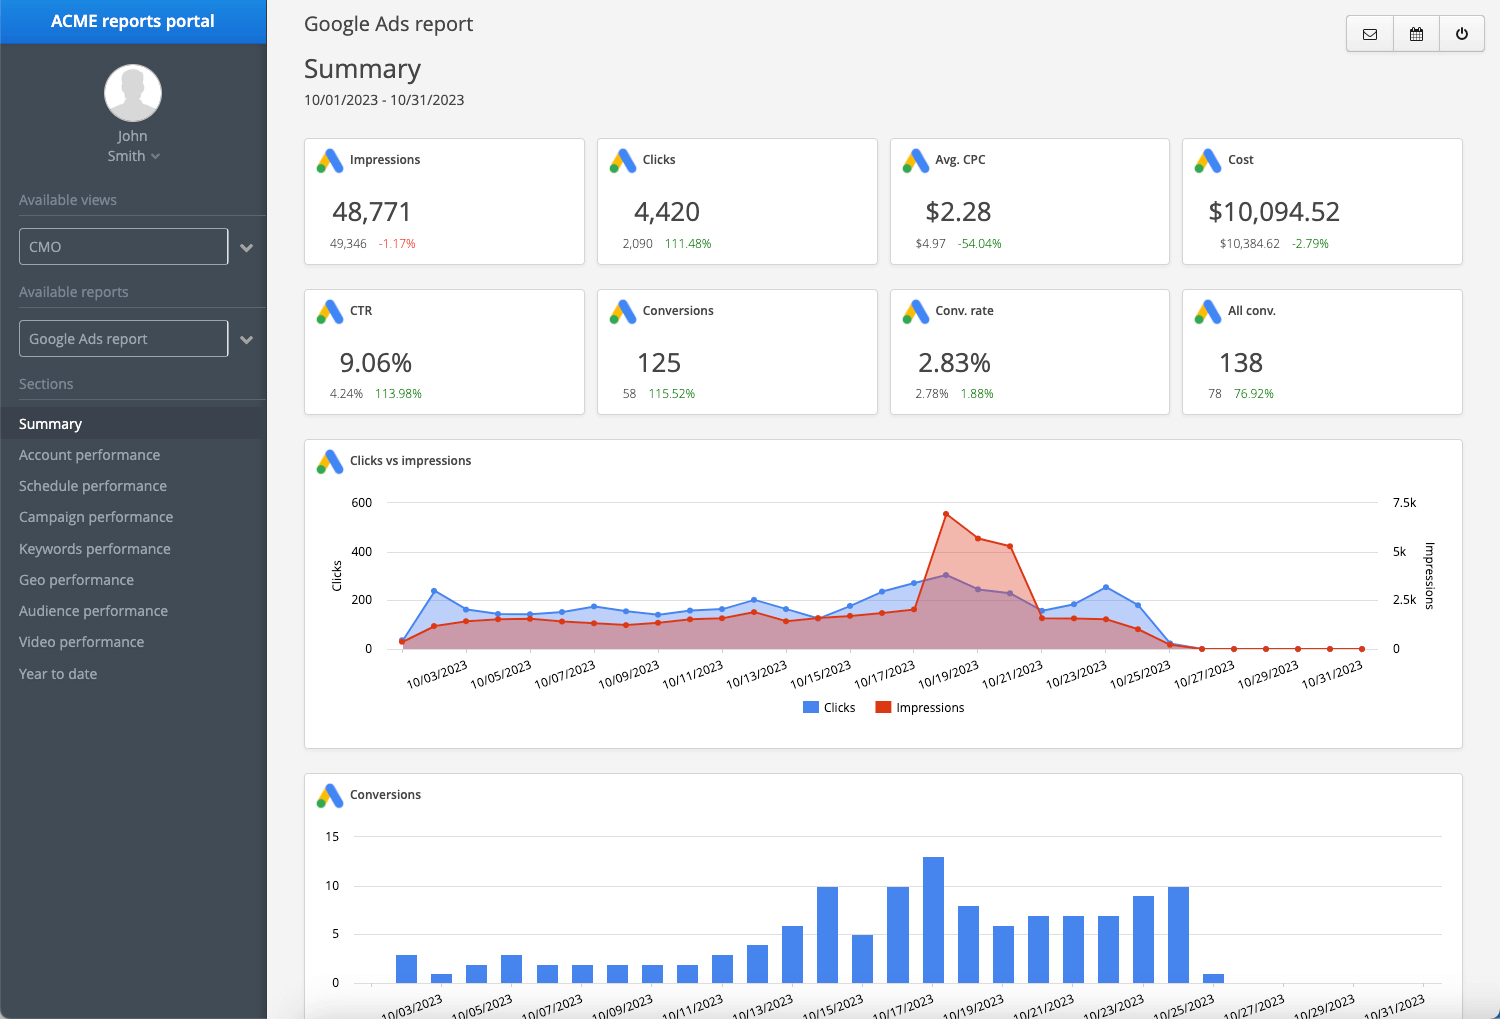
Start by connecting your marketing platforms such as Google Ads, Meta Ads, LinkedIn Ads, GA4, and email marketing tools.
In Reporting Ninja, these integrations authenticate directly and begin syncing data automatically.
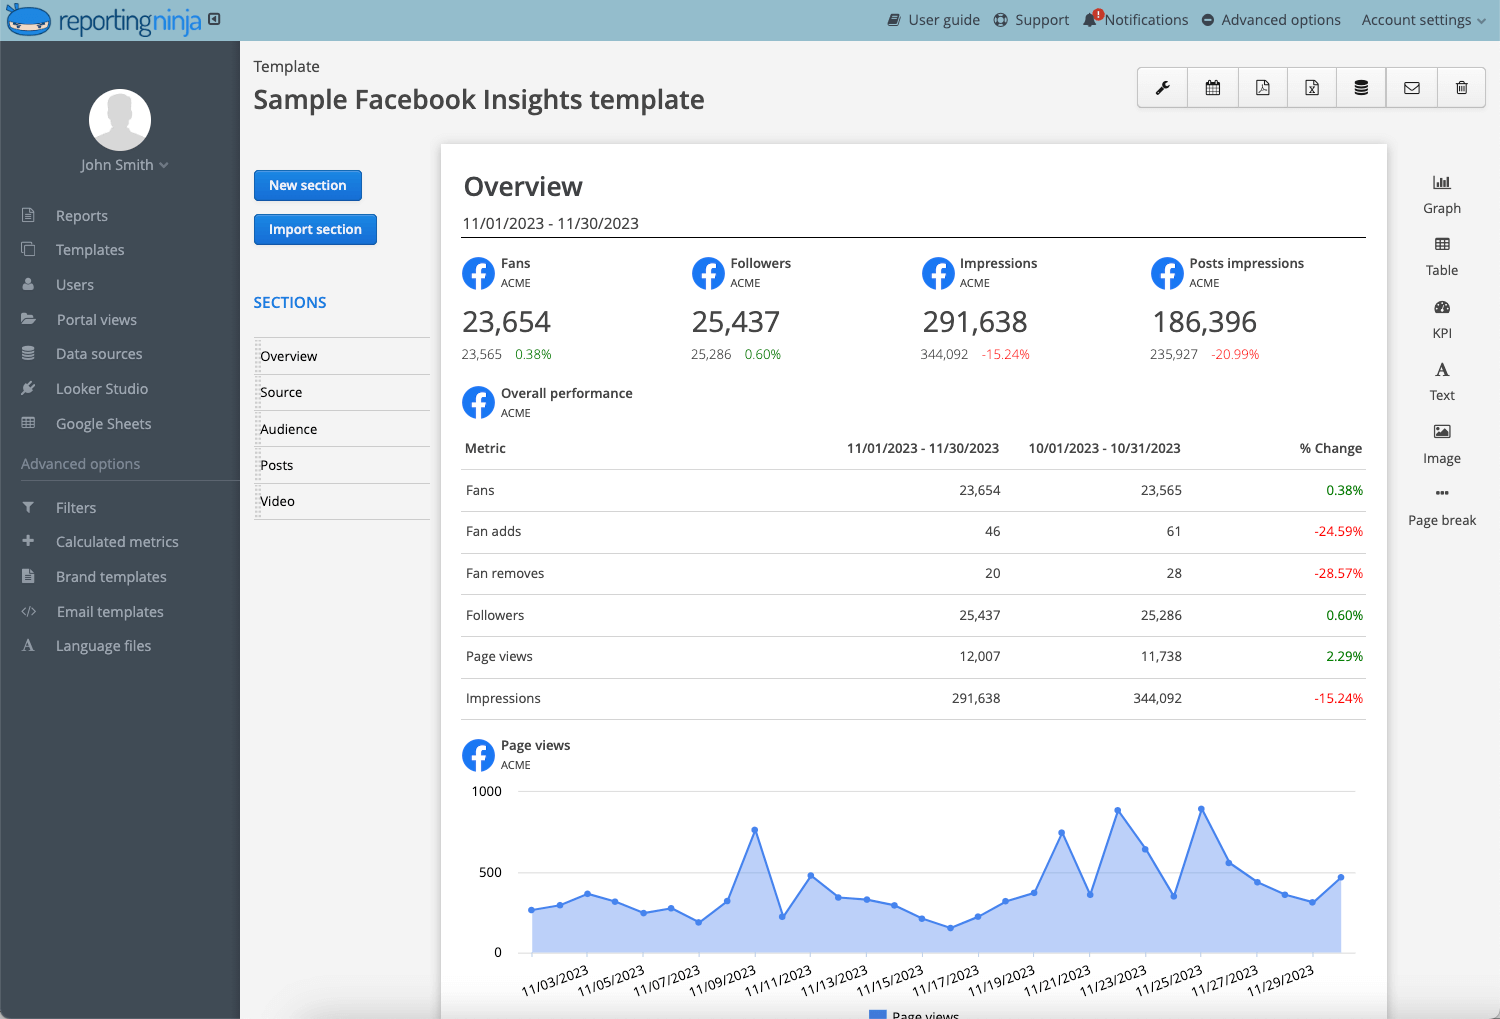
Templates ensure consistent reporting across clients.
Most agencies create templates based on campaign type, such as:
Templates automatically populate metrics when new accounts are connected.
Before automating reports, confirm that KPI definitions match across platforms.
For example:
Standardized KPIs prevent confusion during client reporting calls.
Finally, schedule automated report delivery.
Most agencies send:
Reporting Ninja automatically refreshes the data and sends reports according to the selected schedule. Start using automated, white-labeled dashboards that update and send automatically. Try Reporting Ninja free.
Automation saves time. Poor setup creates new problems.
Avinash Kaushik, former Digital Marketing Evangelist at Google, has warned that many dashboards become “data pukes” instead of decision tools.
That’s the core issue. Reports that show numbers without context don’t help anyone make decisions.
Here are the most common mistakes marketing teams make:
Focus on clarity over volume. The best reports highlight what matters and why it changed.
The right tool determines whether reporting actually saves time or just shifts the workload.
Here’s how common marketing reporting tools compare:
Popular automated reporting tools
For a broader comparison, see the guide to best automated reporting tools software or explore white-label marketing tools used by agencies.
Reporting Ninja is designed for agencies that want automated multi-channel reporting without spreadsheet workflows.
Key capabilities include:
It is a strong fit for agencies and marketing teams that want reporting automation without enterprise-level complexity.
Automate reporting using Reporting Ninja and deliver client-ready dashboards without rebuilding reports each month. Try Reporting Ninja free.
Looker Studio is a flexible dashboard builder widely used by marketing teams.
It integrates marketing data easily with Google products but requires manual setup and maintenance.
It’s often used by in-house teams that want customizable dashboards and are comfortable managing connectors.
Supermetrics focuses on data connectors that move marketing data into spreadsheets or BI tools.
It works well for complex data pipelines, but Supermetric’s pricing increases as additional connectors are added.
Many data teams use it for advanced reporting environments.
No single tool fits every workflow. The right choice depends on how much automation you need versus how much customization you’re willing to manage.
For most agencies, tools that combine multi-channel data, scheduling, and white-label reporting reduce manual work the fastest.
{{cta-block-v1}}
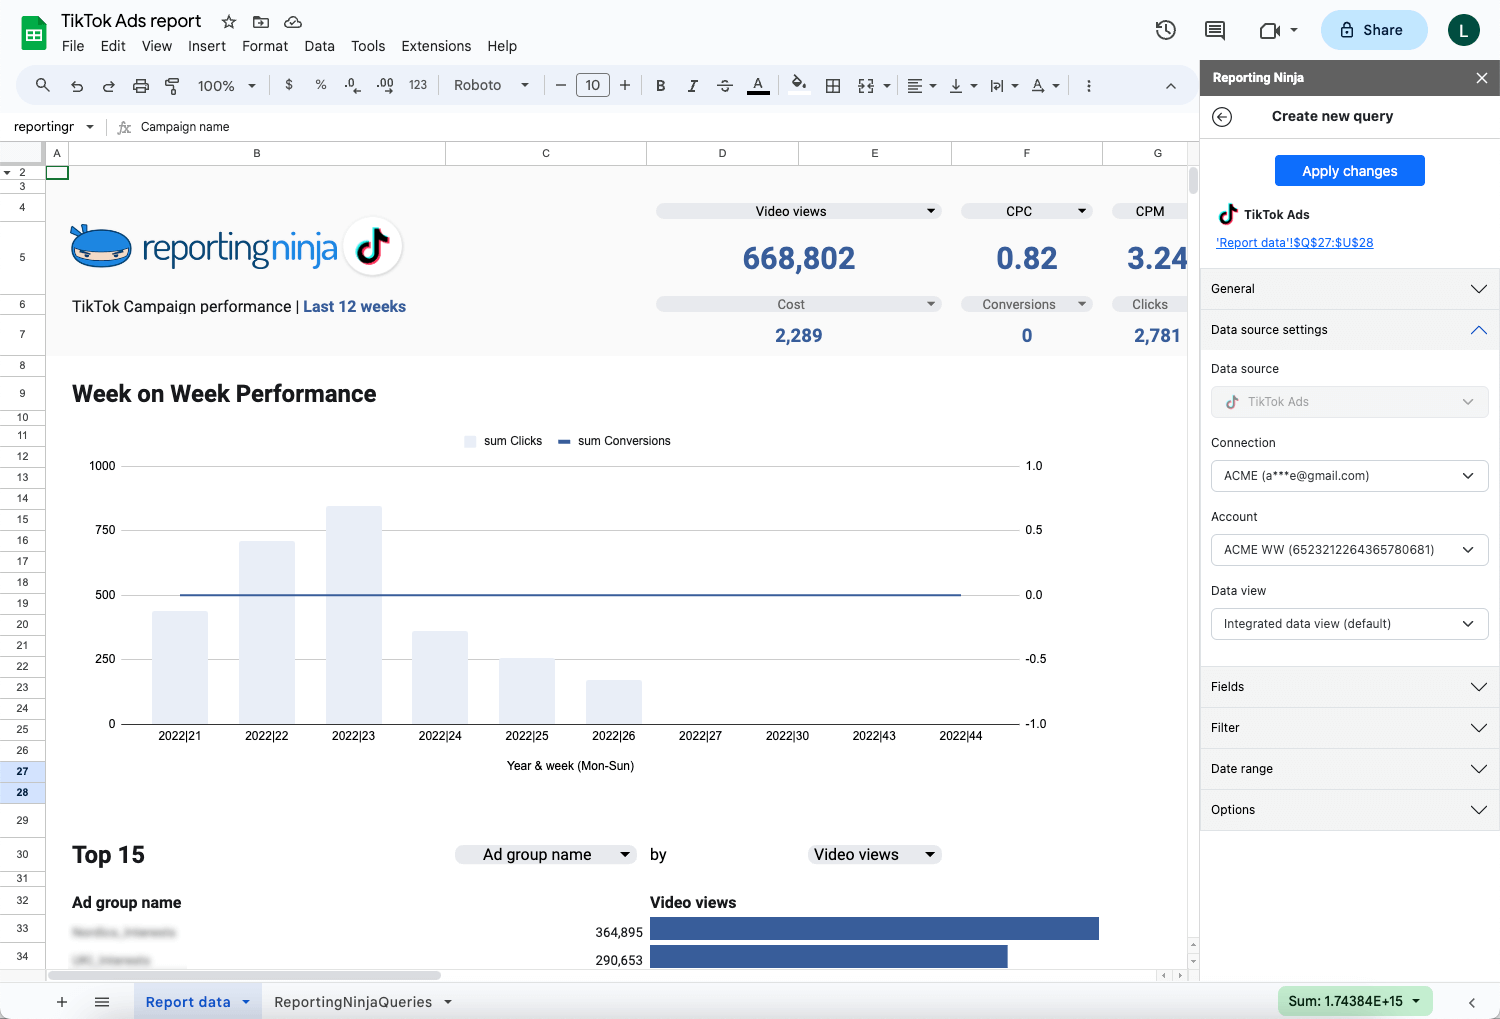
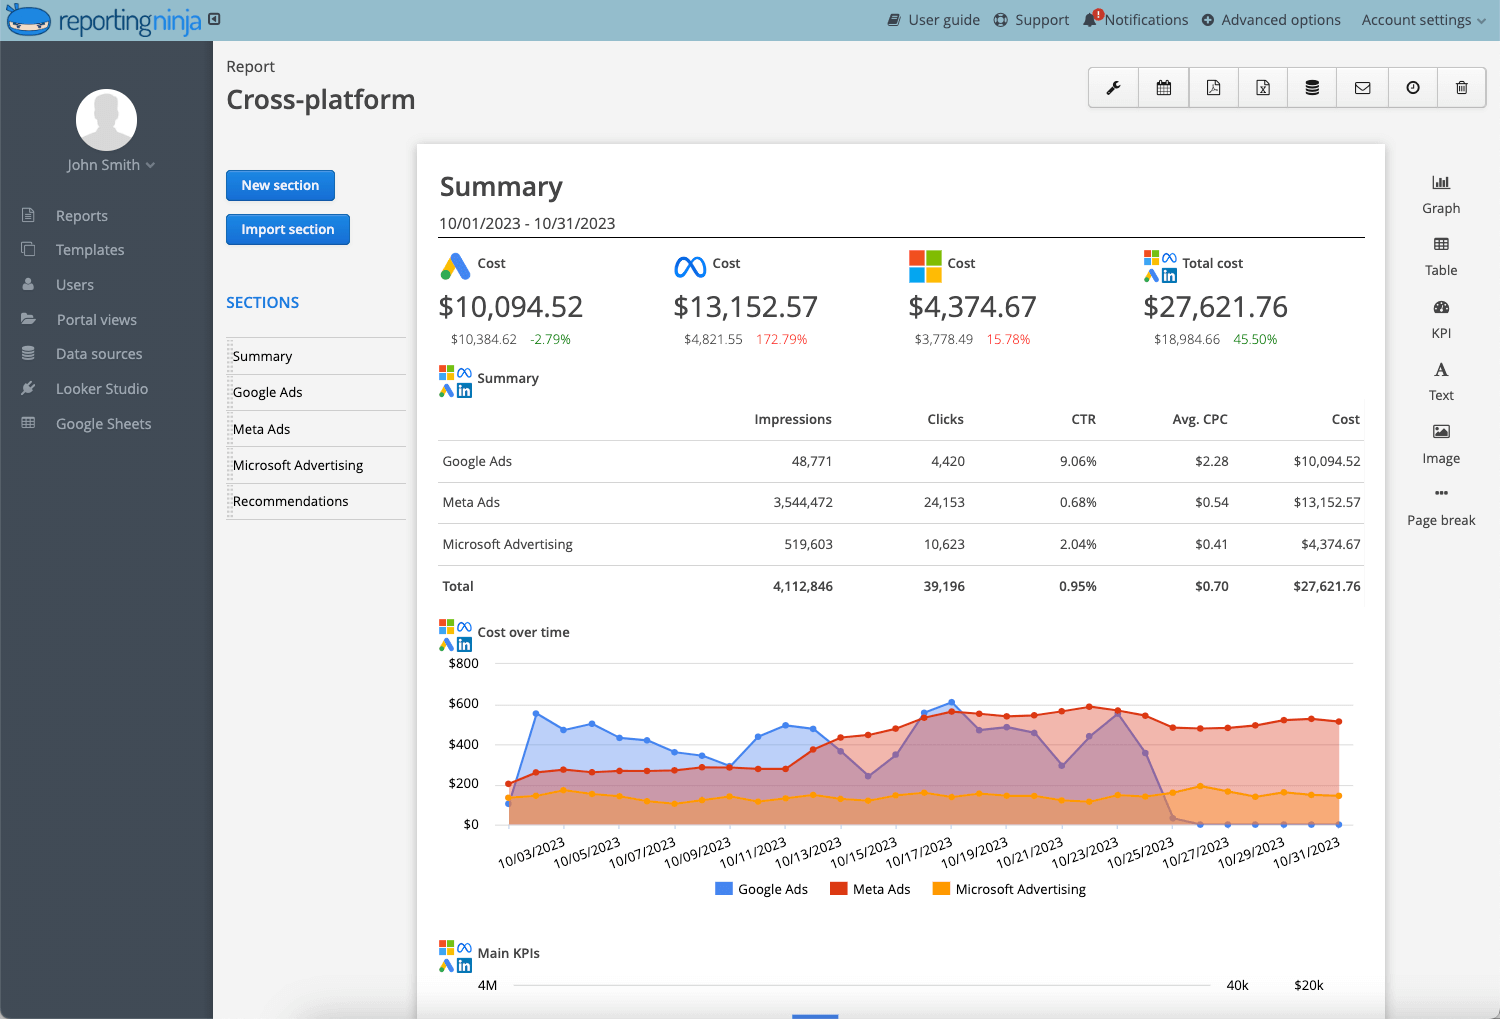
Manual reporting creates fragmented, inconsistent outputs. Automation replaces that with structured, repeatable dashboards.
Here’s what that looks like in practice:
Before:
Manual Google Ads exports copied into spreadsheets. Static charts. Sent as PDF attachments after several hours of cleanup.
After:
Live dashboard pulling spend, conversions, CPA, and ROAS automatically. Scheduled monthly delivery with branded formatting. Data refreshes before each send.
Before:
Separate reports for Meta, Google Ads, and LinkedIn. Metrics manually reconciled during client meetings.
After:
Unified dashboard combining paid social, search, and analytics data in one view. Consistent KPI definitions across channels. Scheduled weekly email delivery.
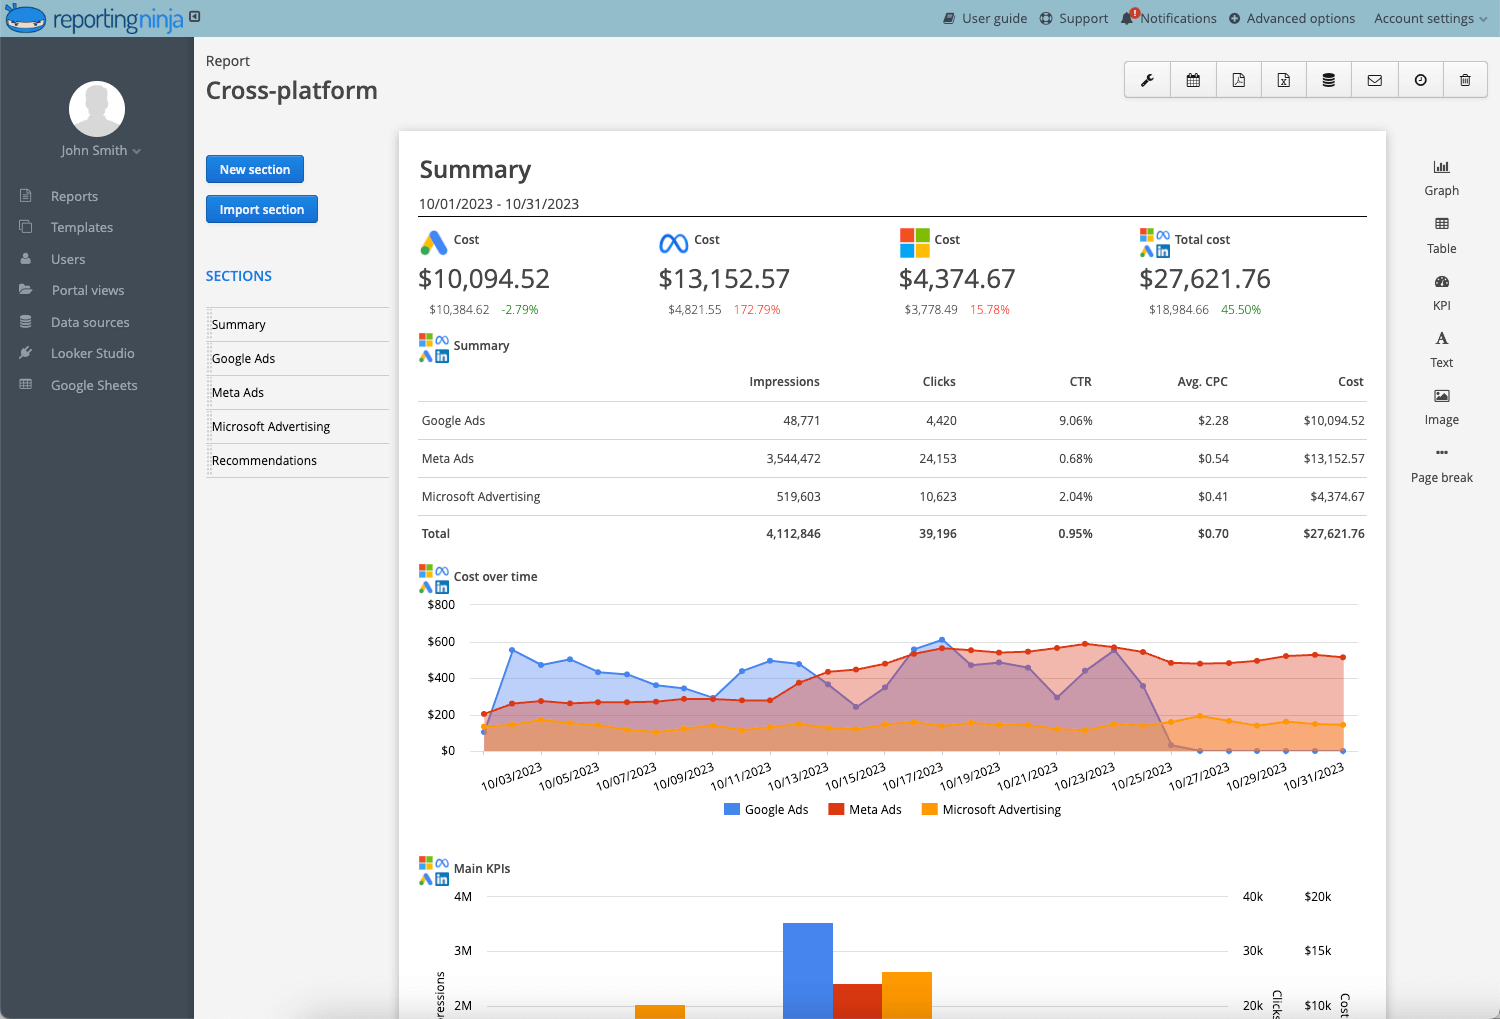
Before:
SEO rankings from one tool. Paid data from another. No standardized template across clients.
After:
Template-based dashboard automatically populated per client account. Organic traffic, keyword rankings, conversions, and paid metrics displayed together.
Automated reporting replaces scattered exports with structured dashboards clients can review without extra explanation.
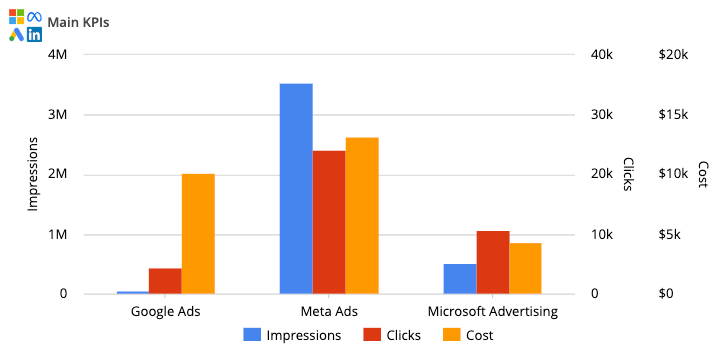
Tracking everything creates noise. Tracking the right KPIs drives decisions.
As Jim Lecinski puts it, “Modern marketers start by saying the end has to be revenue, profit, or share growth.”
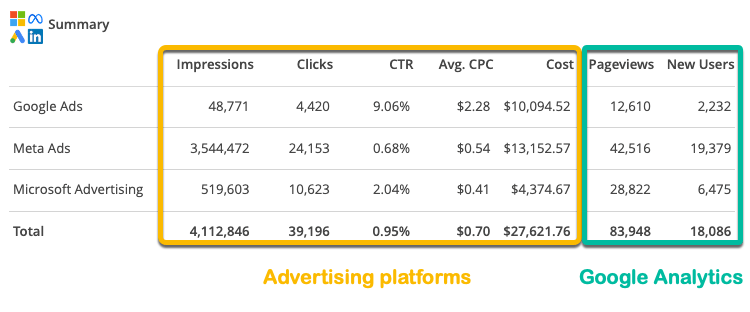
Marketing metrics should connect directly to business outcomes. Automated reporting makes that easier by combining campaign data, conversions, and revenue in one dashboard.
Here’s how to structure the most important KPIs in your reports:
Key principles to follow:
Automated reports work best when they show what’s changing and why, not just activity.
You don’t need another dashboard builder. You need reports that run on schedule.
Reporting Ninja connects your marketing channels, standardizes templates, and handles delivery so data updates and sends without manual exports.
Instead of rebuilding spreadsheets each month, you can:
The result is consistent, client-ready reports with predictable pricing.
Stop managing spreadsheets and start scaling your reporting.
Try Reporting Ninja free.
Report automation in marketing is the process of automatically collecting, updating, and delivering performance data from multiple channels into scheduled dashboards without manual exports.
Weekly or monthly. Most agencies automate weekly performance summaries and monthly strategic reports to balance visibility with clarity.
No. Automation replaces data collection, not interpretation. You still need to review trends and explain performance drivers to clients.
Tools like Reporting Ninja, Looker Studio, and Supermetrics are commonly used. The right choice depends on whether you prioritize automation, custom reports, or advanced data pipelines.
Sometimes. On-time, consistent reporting builds trust. However, retention depends on results and communication, not reporting alone.
Sign up for a 15 days free trial. No credit card required.

Build and automate amazing custom reports in a few clicks. Save time, be more productive, impress your clients.