Analytics
July 9, 2026
Marketing data management: 2026 best practices



You've got last week's campaign numbers spread across Google Ads, Meta, GA4, and three spreadsheets, and none of them agree.
Marketing data management is how you fix that. It's the practice of collecting, connecting, and standardizing data from every channel so your reports are accurate and your decisions aren't guesswork. Done well, it turns hours of manual exporting into a system that mostly runs itself.
This guide covers the core components, a step-by-step framework for setting it up, the challenges you'll run into, and the tools that make it easier.
For freelancers and small agencies juggling several clients, disorganized data wastes time, causes reporting errors, delays insights, and undermines trust in reports. Good data management prevents all four problems. Here’s how:
Google Ads, Meta, and GA4 rarely agree on what counts as a conversion. Without agreed definitions, those figures can't simply be added together because each platform measures success differently. Marketing data management pulls every source into one view and standardizes those metrics before they're reported.
A PHD survey of 1,721 senior marketers found that time spent on reporting has increased 57% over the past decade, with 88% of marketers now spending most of their time tracking performance, creating reports, and generating audience insights. As reporting demands grow, marketers estimate they spend only 18% of their time on creative thinking and new ideas.
A huge chunk of this process, from collecting and cleaning to presenting marketing data can be automated. Every manual export and pivot table is time you’re not spending on actual work, and when multiplied across several client accounts, the hours add up fast.
You can't shift budget from an underperforming channel to a strong one if you're not looking at both in the same place, at the same time. Clean, connected marketing data lets you compare paid social against paid search against organic in a single report, not three separate ones you have to reconcile by hand.
Clients quickly lose confidence when reports contain inconsistent figures or arrive later than expected. A well-managed data system reduces manual errors, keeps reporting consistent, and ensures stakeholders can rely on the numbers they're seeing.
Most teams treat marketing data management as one big task. Meanwhile, it's actually four connected ones, and missing any single piece creates a bottleneck downstream.
Data collection is where marketing performance data enters your reporting workflow, from ad platforms and GA4 to your CRM, email tools, and other systems your team relies on. The goal isn't to collect every available metric, but to capture the data needed to measure your business goals consistently across every relevant source.
A reliable data collection process typically includes:
Collected data is useless if it stays siloed in each platform's own dashboard. Integration means connecting those sources so they can be viewed and compared together, whether through native connectors, an API, or a reporting layer that sits on top of everything.
Many teams assume integration is primarily a technical challenge, but the bigger obstacle is consistency. Different platforms often define customers, campaigns, and conversions differently.
Unless those definitions are aligned, integration simply combines inconsistent data faster instead of producing reliable reports. Getting this right is one part of multichannel campaign management, which also covers how segmentation, personalization, and measurement fit together across channels.
See how marketing API connections work behind automated client reporting dashboards.
Raw, integrated data is still messy. Different platforms name the same metric differently (Meta's "conversions" isn't always GA4's "conversions"), use different date ranges, and format numbers inconsistently.
Structuring means standardizing naming, units, and definitions so a "conversion" means the same thing everywhere in your report. Without this step, reports may appear accurate while masking inconsistencies that lead to misleading comparisons and poor decisions. For example:
Think of data structuring as creating a shared language for your marketing stack. Without it, every platform tells the truth, but each tells it in a different dialect.
Data activation is where structured data turns into the things people actually use, including live dashboards, scheduled client reports, budget alerts, and the numbers you talk through on strategy calls.
92% of marketers in a Capterra survey agreed they could make better decisions if marketing data were presented well. So, the format follows the audience: a client might get a branded PDF every Monday, while your internal team works off a live dashboard they check daily.
Automation matters most here. Once collection, integration, and structuring are solid, reports can go out on a schedule instead of being rebuilt by a person each cycle. That turns a client review or a mid-month budget check into a few minutes of work instead of an afternoon.
A setup that works for two clients often breaks at ten or more. As new clients, campaigns, platforms, and team members are added, manual processes that once felt manageable quickly become bottlenecks.
The five-step framework below is designed to help you build a reporting workflow that scales without requiring more spreadsheets or more administrative work.
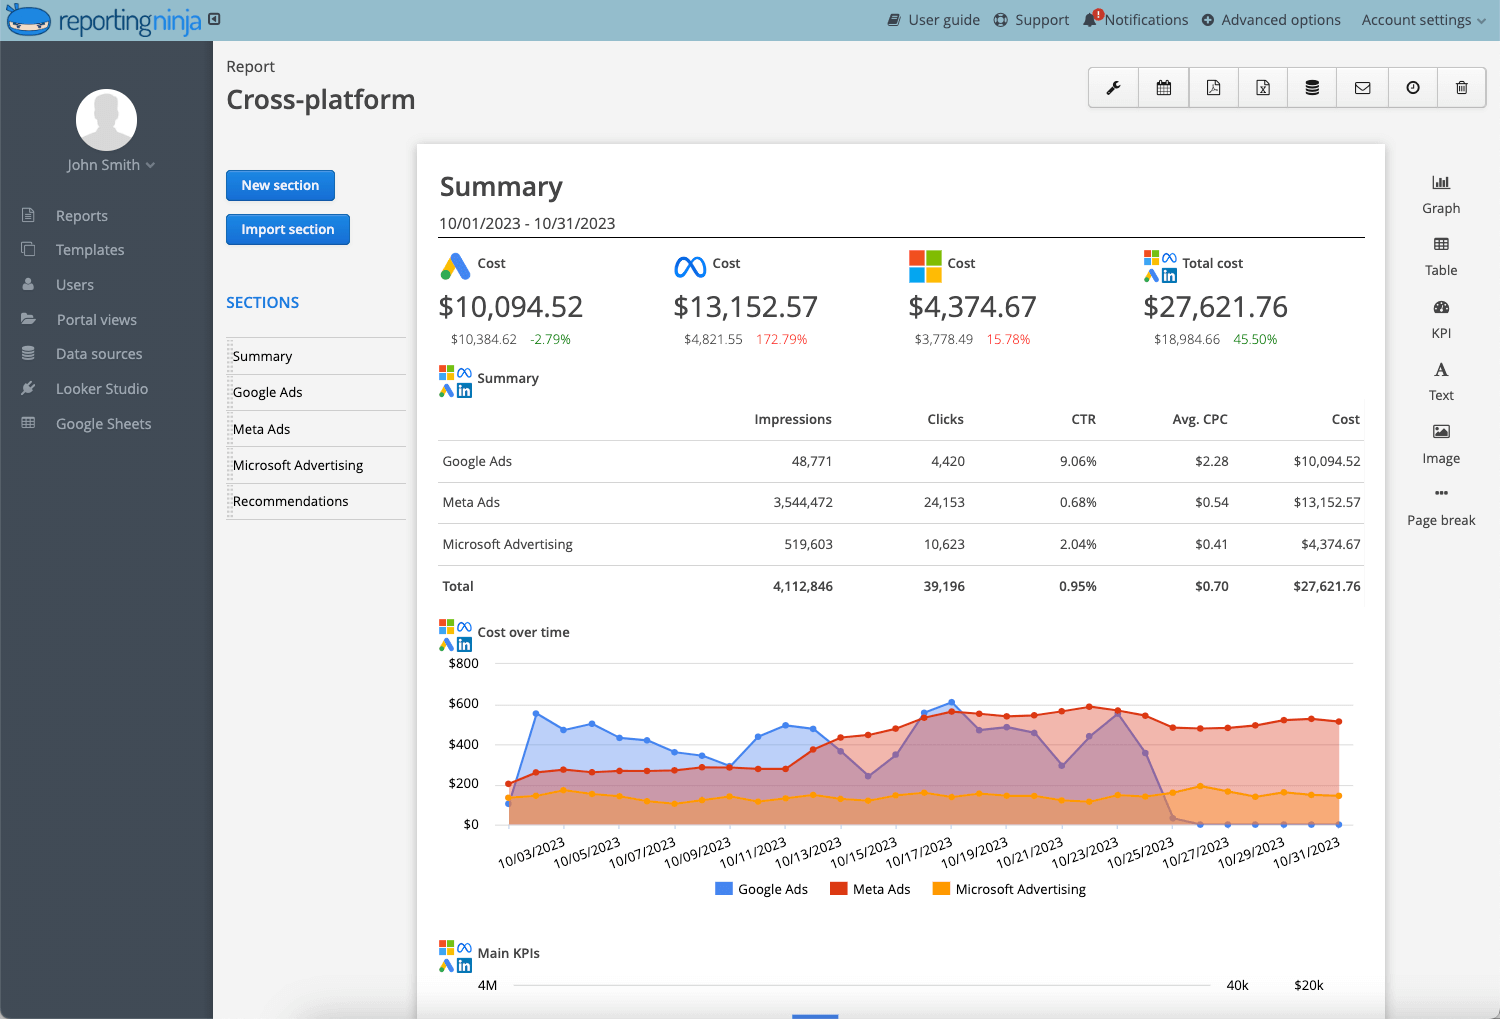
Before you fix anything, you need a full inventory of where your data lives. List every platform that generates marketing data, including the ones people forget, like ad accounts, GA4, your CRM, email tools, landing page builders, call-tracking software, and any review sites.
For each source, write down what data it holds, what you currently export by hand, and how long that export takes. Knowing which content marketing metrics actually matter helps you decide what's worth pulling from each one.
Don't change anything yet. The point of this step is to see the whole picture before you touch a single connection.
Connected tools are useless if they each define a metric differently. Before you link anything, agree on what each metric means and write those definitions somewhere your whole team can reach.
A shared glossary lets everyone read KPIs the same way, even when a new hire joins or a client asks for a custom view of the numbers. Without it, two people pull the same dataset and still argue over the headline figure. For example:
Settle these definitions now, and every later step inherits clean, consistent inputs instead of the same disagreement at a bigger scale.
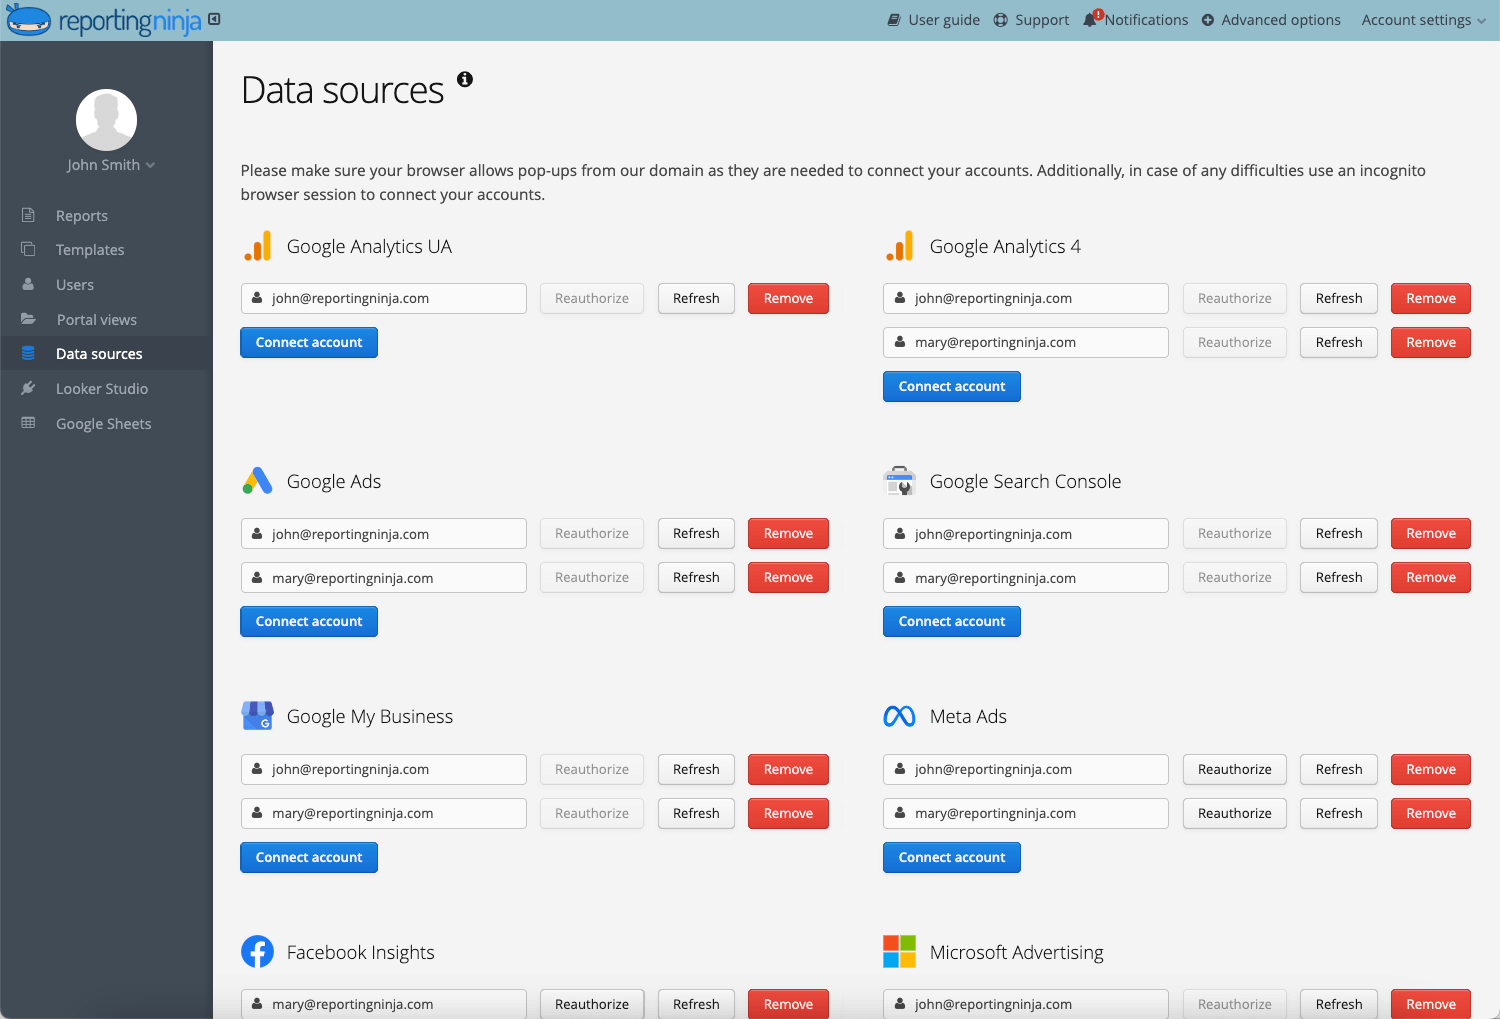
With definitions agreed, connect your sources so their data sits in one place. Pick the method that fits your stack, such as native platform connectors, a Google Sheets add-on, or a Looker Studio connector.
Resist connecting every platform on day one. Start with the channels that carry the most spend or trigger the most client questions, then add secondary sources once the core is stable and accurate.
The order matters because each new connection is something you have to validate and maintain. Get two or three high-value sources reporting cleanly, confirm the figures match the native platforms, then expand from that working base.
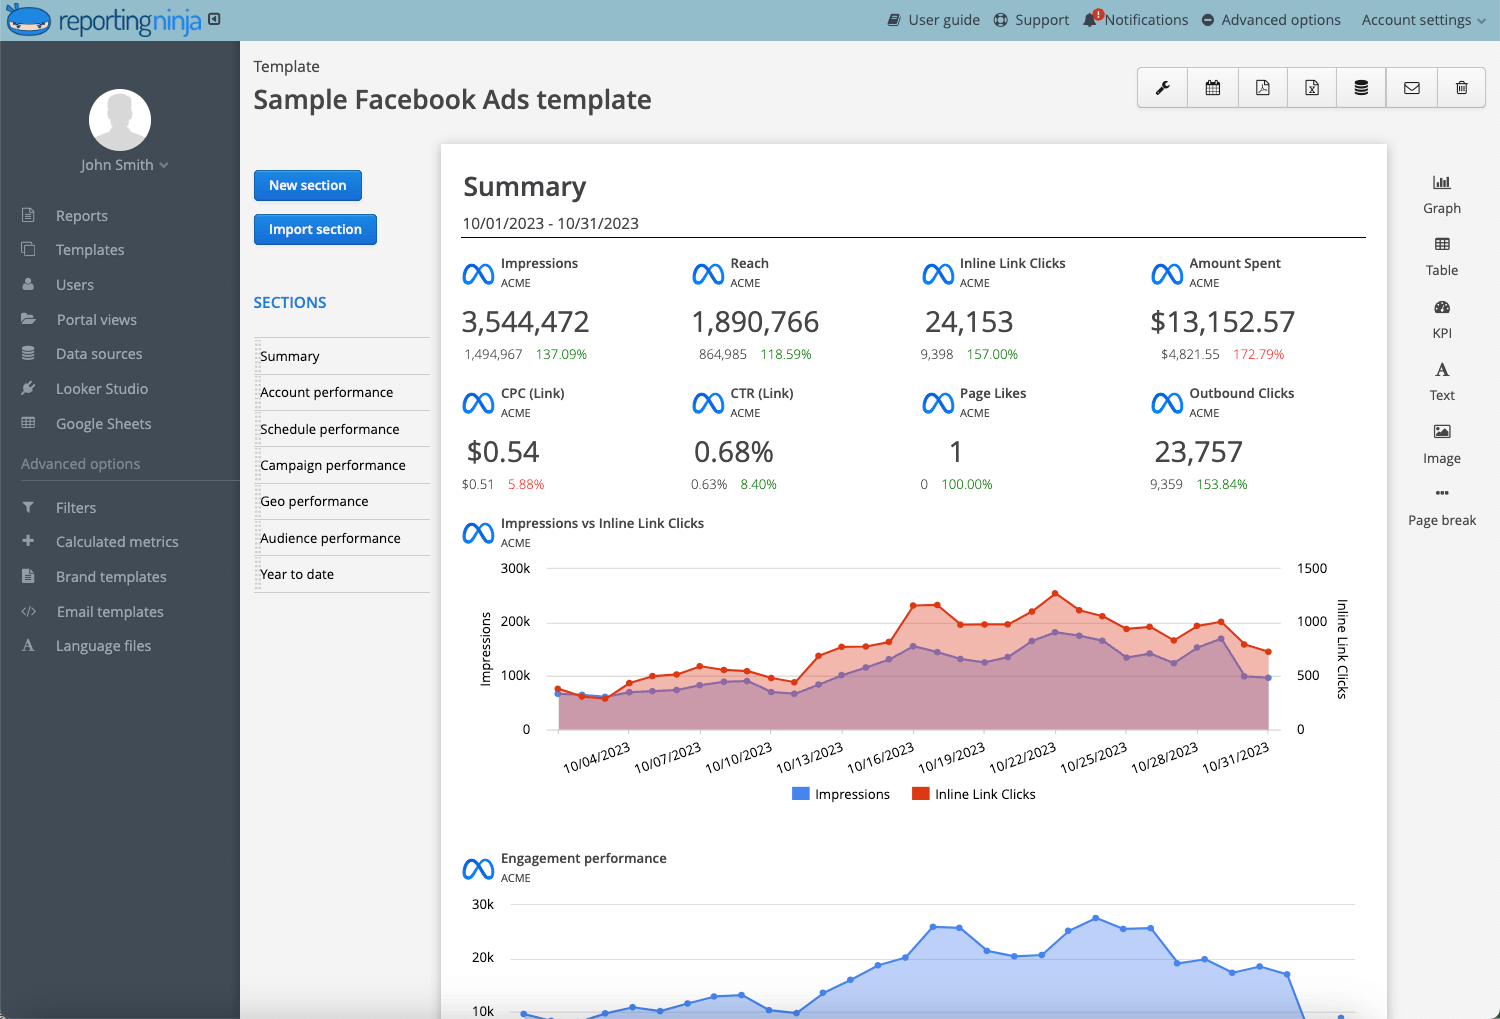
Once your sources feed one system, decide how the data gets presented. Build a dashboard template once and reuse it across clients instead of rebuilding a report from scratch every cycle.
Templates reduce errors and speed up onboarding, since the reporting structure already exists when a new client or teammate arrives. Getting this right depends on how you visualize marketing data, so a useful dashboard answers four questions at a glance:
If those answers take more than a few seconds to find, the dashboard is showing too many metrics. Its job is to shorten the time it takes to make a decision, not to display everything you can measure.
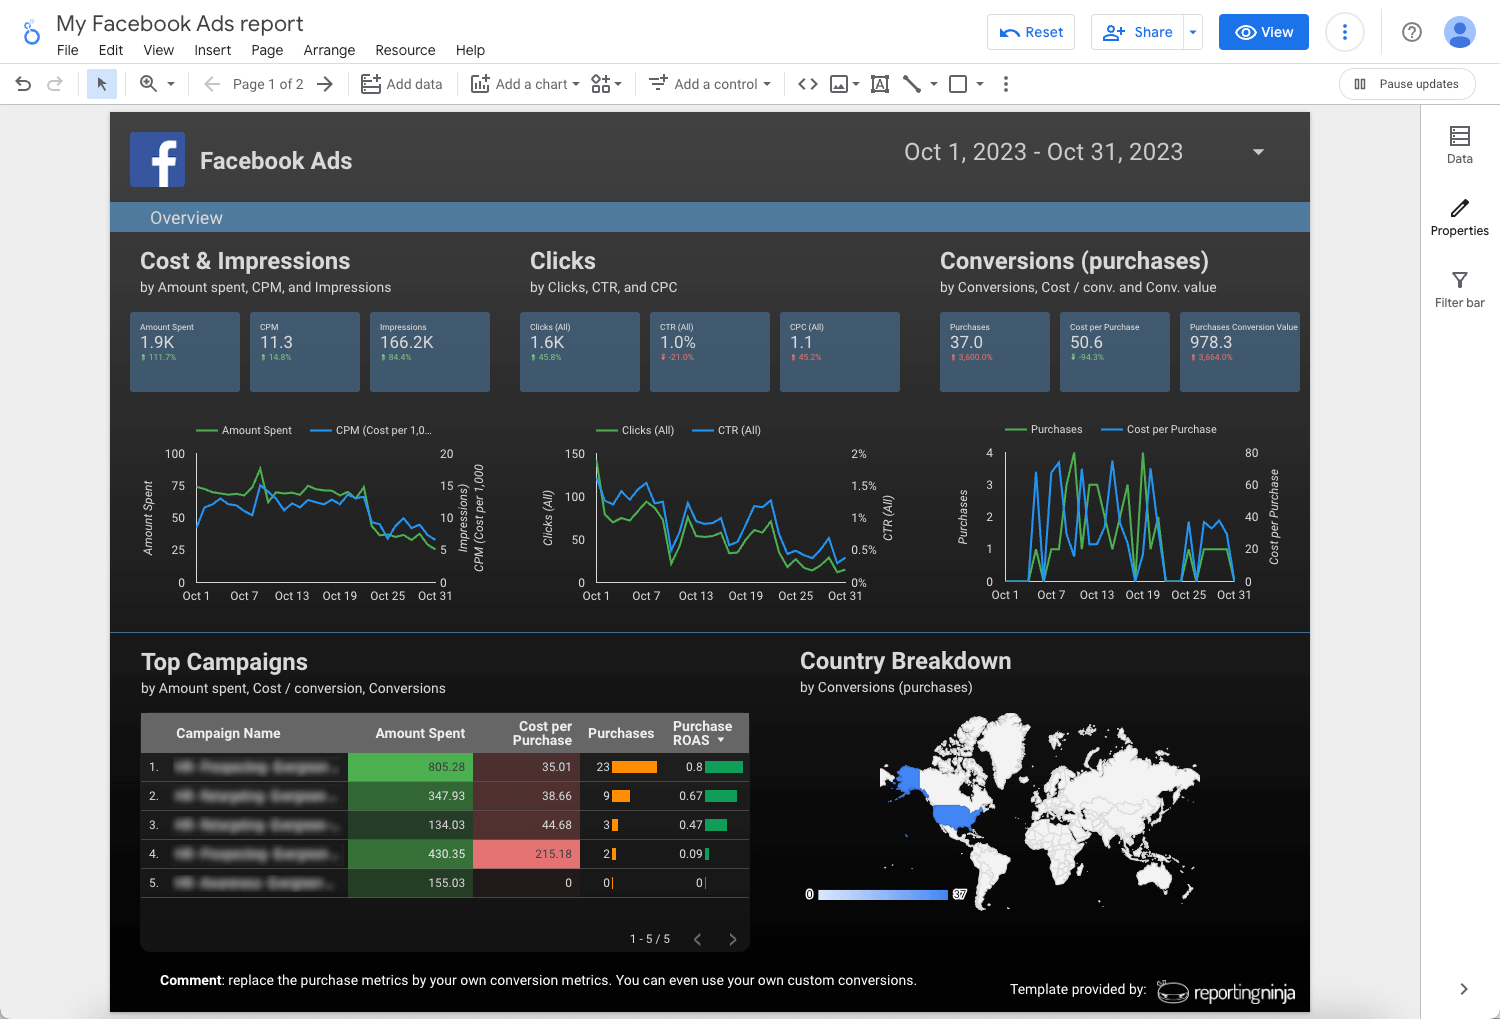
With data collected, integrated, and structured, the reporting itself should run without you. Pulling numbers into a report by hand every week doesn't scale past a handful of clients, and each manual step adds another chance for error.
AI reporting tools like Reporting Ninja connects to your ad platforms, GA4, and other sources, then builds and sends client-ready reports on a schedule. Every plan includes all integrations and all five formats, the built-in reports platform, Looker Studio connectors, a Google Sheets add-on, a REST API, and an MCP server, so you're never locked into one format per client.
If you still spend most of your week pulling numbers and formatting reports by hand, start a free trial of Reporting Ninja and let the reports build and send themselves while you focus on the client work that actually needs you.
{{cta-block-v1}}
These three terms get used interchangeably, but they're distinct stages of the same pipeline. Data management is the foundation, analytics interprets it, and reporting communicates it.
Here’s how the three stages play out in a monthly client review.
Even teams that understand the framework above run into the same recurring obstacles. Most aren't about effort or skill. They come from the tools themselves, which count things differently and rarely agree out of the box.
The challenges below show up most often as you add clients and channels. Knowing them in advance makes each one easier to plan around.
Marketing teams today rarely rely on a single platform. A typical reporting workflow might involve Google Ads, Meta Ads, GA4, a CRM, email marketing software, and call-tracking tools. Each of these platforms stores data in its own format. The challenge is ensuring they describe campaigns, customers, and conversions consistently enough to produce reliable reports.
Metrics and KPIs aren’t the same thing. When "engagement" means one thing in your CRM and another in your ad platform, comparisons across channels stop being reliable. The main problem with these platforms is that they measure different behaviors for different purposes.
Apart from time consumption, manual reporting also creates hidden quality-control work. Every copy-and-paste step, spreadsheet formula, or manually updated pivot table introduces another opportunity for human error. As the number of campaigns or clients grows, those risks multiply.
Delayed reporting often means delayed decisions. If campaign performance isn't visible until the following week, opportunities to reallocate budget, pause underperforming ads, or respond to sudden changes may already have been missed.
Without a connected view, it's hard to tell which channel actually drove a conversion versus which one just happened to be the last touchpoint tracked. Looking only at the last interaction can undervalue the channels that introduced or nurtured the customer earlier in the journey.
Reported performance shifts significantly depending on whether you use first-click, last-click, linear, or data-driven attribution. Applying one model consistently across reports usually matters more than picking the "perfect" one.
Teams that standardize definitions, assign ownership, validate data regularly, and keep reporting formats flexible spend less time fixing reports and more time improving marketing performance.
Automating a messy, inconsistent process just makes the mess move faster. Agree on metric definitions, naming conventions, and reporting cadence before you connect tools. Teams that automate first and standardize later usually end up redoing the work twice.
Someone on your team, even if it's just you, should own checking that connections are live and numbers look right each reporting cycle. Without a named owner, data quality issues tend to sit unnoticed, because everyone assumes someone else is monitoring it.
Set a recurring calendar reminder, monthly is usually enough, to spot-check your dashboards against the raw platform numbers. Run a monthly audit to verify key metrics, attribution settings, naming conventions, integrations, and report delivery. Most reporting errors stem from missing or duplicated data, and catching this early saves you from presenting wrong numbers in a client meeting.
Not every client wants the same deliverable. Some want a live dashboard link, others want a PDF, and some still want the numbers in a spreadsheet they can work on themselves. Building your data management setup around one rigid output format limits who you can serve well.
For context, 89% of respondents in the Capterra survey said their managers prefer reports with data visualizations. And 82% said decision-makers prefer interactive over static formats.
Before evaluating software, identify where your reporting process actually breaks down. Choosing a tool based on the problem you're solving, and not necessarily based on the feature list, usually leads to better results.
Match the tool to your biggest bottleneck: automated client reporting points to Reporting Ninja, an existing Looker Studio habit points to a connector, a spreadsheet-first workflow points to a Google Sheets add-on, and enterprise-scale analytics points to Power BI or Tableau.
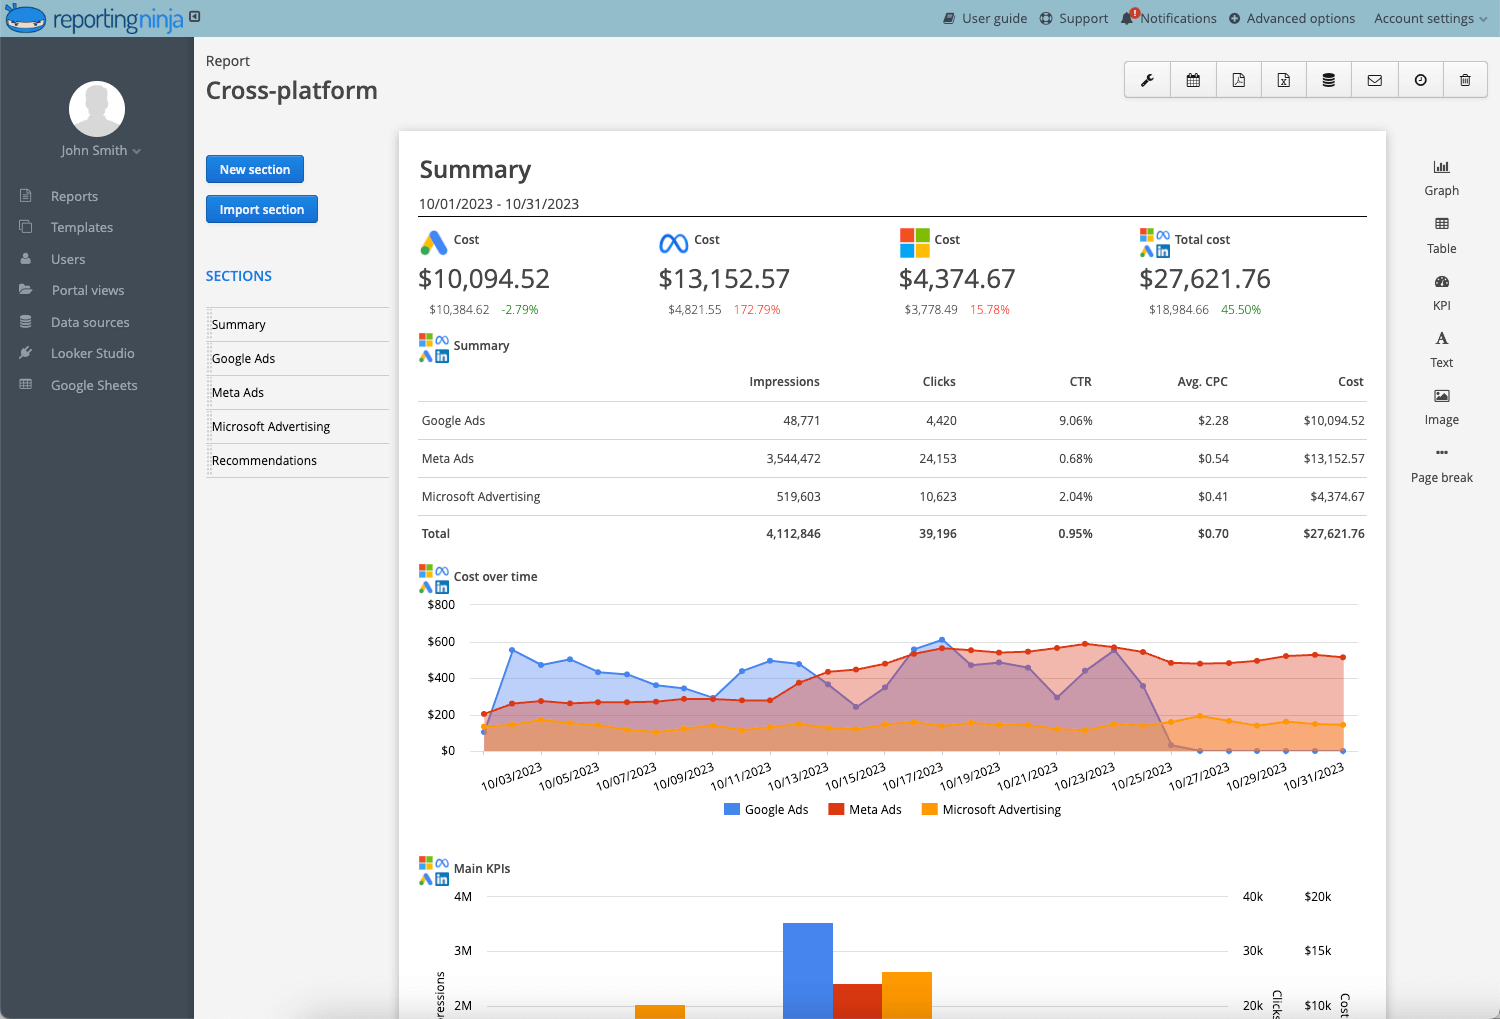
Reporting Ninja is built specifically for freelancers, small agencies, and lean in-house marketing teams who need client-ready reports without paying for an enterprise BI platform. Every paid plan, starting at $20/month billed annually, includes every integration and all five reporting formats: the built-in custom reports platform, Looker Studio connectors, a Google Sheets add-on, a REST API, and an MCP server.
There's no tier where features get locked behind a higher price. You connect your sources, set your schedule, and reports go out automatically, whether that's a branded PDF for a client or a live dashboard link. It's self-serve, so you can be reporting the same day without a demo or an onboarding call.
If manually stitching together spreadsheets and dashboards is still where most of your week goes, this is the exact gap Reporting Ninja closes. Start your free trial with Reporting Ninja.
{{cta-block-v1}}
Looker Studio is often the default choice for marketers because it's free and highly customizable. However, it focuses on data visualization rather than data management. Most teams rely on third-party connectors to automate data collection while still building and maintaining their own dashboards.
The connector eliminates manual CSV imports by syncing data automatically, but you're still responsible for designing, updating, and troubleshooting the dashboard itself.
These tend to fit once an agency is managing dozens of client accounts with different reporting requirements. They typically offer deep, agency-specific features like white-label branding, client portals, and automated scheduling. That depth is real, but it comes at a higher subscription cost, so it's worth weighing against what a smaller team actually needs.
If your main challenge is unifying customer identities across marketing, sales, and service rather than reporting campaign performance, a CDP fits better than a reporting platform. CDPs build unified customer profiles, whereas reporting tools consolidate and present marketing performance data. They solve different problems.
Not sure whether your current platforms already connect to a single reporting system? See Reporting Ninja’s list of integrations.
If your team spends more time preparing reports than discussing campaign performance, it's probably time to automate the reporting workflow rather than adding another spreadsheet.
Marketing data management exists to give your team more time to use AI marketing analytics to analyze performance and make better decisions. Reporting Ninja helps you connect your marketing data, automate client reporting, and deliver reports in the format your client prefers, starting at $20/month billed annually with everything included.
Ready to spend less time building reports and more time acting on what they show you? Start your free 15-day trial.
Marketing data management is the process of collecting, integrating, structuring, and activating data from every marketing channel so teams can report on performance accurately and make faster decisions.
Generally, by connecting each platform, ad account, CRM, analytics, and email into one system, standardizing how metrics are defined across them, and automating the reporting layer so numbers update without manual exports.
A CDP (customer data platform) consolidates customer data from multiple sources into one unified profile. A CRM (customer relationship management) tool tracks and manages individual interactions and relationships with those customers. They often work together but serve different purposes.
No. Freelancers and agencies usually feel the impact first, since they're managing multiple clients with limited time for manual data work. In-house teams face the same challenges as reporting expands across channels or departments. Either way, a lean, automated setup scales far better than adding more manual work.
{{cta-block-v1}}
Sign up for a 15 days free trial. No credit card required.

Build and automate amazing custom reports in a few clicks. Save time, be more productive, impress your clients.