Analytics
July 21, 2026
How to connect marketing data using API connectors (2026)


Most marketing teams measure campaign performance across multiple sources, including advertising platforms, web analytics tools, CRM systems, email marketing platforms, and social media dashboards. Bringing those numbers together manually is time-consuming and increases the risk of reporting errors.
Marketing API connectors solve this problem by automatically pulling data from your advertising platforms, analytics tools, and CRMs into one destination, eliminating most manual exports and copy-and-paste work.
In this guide, you'll learn what marketing API connectors are, the types available, how they compare with ETL and reporting tools, and the practical steps for implementing them.
Connecting your marketing data via API does more than eliminate manual reporting work. It gives teams faster visibility into performance, more reliable reporting, broader cross-channel insights, and a scalable workflow.
Bitly's 2026 Marketing Visibility Report found that 73% of marketers admit they realize a campaign is underperforming only after it’s too late.
Instead of waiting until the end of the week to review campaign performance, an API connection refreshes your reporting data on a schedule you control, whether that's hourly, daily, or weekly. That means you can spot a stalled campaign or an unexpected spike in ad spend before it affects overall performance.
This faster feedback loop is very valuable for agencies managing paid, organic, and social channels side by side, where small issues can quickly affect multiple client accounts.
Manual reporting is slow and gets unreliable with scale. Every manual export is a chance for a typo, a mismatched date range, or a forgotten refresh. When your data moves automatically, that risk mostly disappears. You're not reconciling different CSV files with different column headers before a report goes out since the connector standardizes the format for you every time it runs.
Manual exports also create version-control problems. Two people can export the same report minutes apart using different date ranges or attribution settings, leading to conflicting numbers in stakeholder meetings.
If you're managing reporting for 10 or 20 clients, checking each dashboard individually isn’t sustainable. API connectors let you pull data from every connected account into a single report or spreadsheet, so you can compare performance across accounts using the same reporting framework.
Also, when managing paid search across several accounts, pairing marketing API connectors with a dedicated SEM reporting setup makes it easier to spot which campaigns are actually driving results, rather than just which ones are spending the most.
Most platforms track more than the handful of default metrics like clicks and impressions shown in their dashboard. On the other hand, APIs expose custom conversions, UTM parameters, CRM lifecycle stages, or platform-specific audience segments. A direct API connection expands your reporting capabilities beyond the platform defaults.
That flexibility makes it easier to tailor reports to different stakeholders, whether they're interested in lead quality, revenue attribution, or campaign engagement.
Manual reporting processes tend to break down as you grow to 5 or more clients. With API connectors, adding another account usually just involves authentication rather than rebuilding reports or duplicating workflows.
Besides the ease of adding more accounts, API connectors ensure that scaling survives updates, authentication renewals, and schema changes without rebuilding reports every few months.
Marketing API connectors typically pull data from four broad categories of tools: advertising platforms, analytics tools, CRM or email systems, and local or review platforms. The exact mix depends on your stack, but most reporting workflows touch some combination of them.
Paid advertising is often the first thing teams connect, because spend and conversions live across several accounts, and reconciling them by hand takes the most time. Google Ads and Meta Ads are the common starting point, with Microsoft Advertising and LinkedIn Ads added as the channel mix grows.
Analytics and owned channels come next. GA4 and Search Console cover website and search performance, while Instagram Insights, Facebook Insights, and YouTube Analytics fill in content and audience data. Together they show what happens after the click, not just the ad spend that drove it.
CRM and email connections show marketing's contribution to revenue. Pulling HubSpot, Mailchimp, or Salesforce data alongside ad performance links campaigns to qualified leads and closed deals rather than stopping at clicks.
Local and review platforms matter most for multi-location businesses. Google Business Profile, Yelp, and Trustpilot combine reach and engagement with actions like reviews, calls, and direction requests, which are often the metrics a local client cares about most.
Marketing API connectors come in different forms, each suited to different reporting needs and technical requirements.
These are the raw APIs provided by platforms like Google Ads or Meta Marketing. They give you the most control over your marketing data, but you (or a developer) have to build and maintain the connection yourself. This includes authentication, rate limits, and any changes the platform makes to its API over time.
Prebuilt connectors are pre-configured integrations that a reporting or data visualization tool maintains for you. You authenticate your account, and the connector handles the ongoing sync, field mapping, authentication, and API updates. For example, instead of building directly against the Google Ads API, a platform like Reporting Ninja maintains the integration for you.
See how Reporting Ninja’s Looker Studio connectors work.
Extract, transform, and load (ETL) tools grew out of data warehousing, where teams needed to combine data from many systems into one clean structure before analyzing it. ETL and iPaaS (integration platform as a service) tools do the marketing-data version of that job of moving data between systems while letting you standardize, enrich, or combine it before it reaches a destination like a warehouse.
They're commonly used when marketing data needs to sit alongside finance, ERP, or product analytics data rather than just feeding a client report.
Some organizations build custom integrations when prebuilt connectors can't support proprietary systems, internal destinations, or specialized data models. While this offers a lot of flexibility, it also means your team is responsible for maintaining the integration whenever a platform changes its API.
These categories aren't mutually exclusive. A marketing team might use API connectors to collect campaign data, an ETL platform to standardize and combine that data with CRM or finance systems, and a reporting platform to present the final insights through dashboards or scheduled reports.
Reporting Ninja combines API connections, custom reporting, Looker Studio connectors, and a Google Sheets add-on in one subscription, so you don't have to manage multiple tools for data extraction and client reporting. Start your free trial to see how they work together.
{{cta-block-v1}}
Setting one up properly takes more than just authenticating an account. Here's the process you should follow:
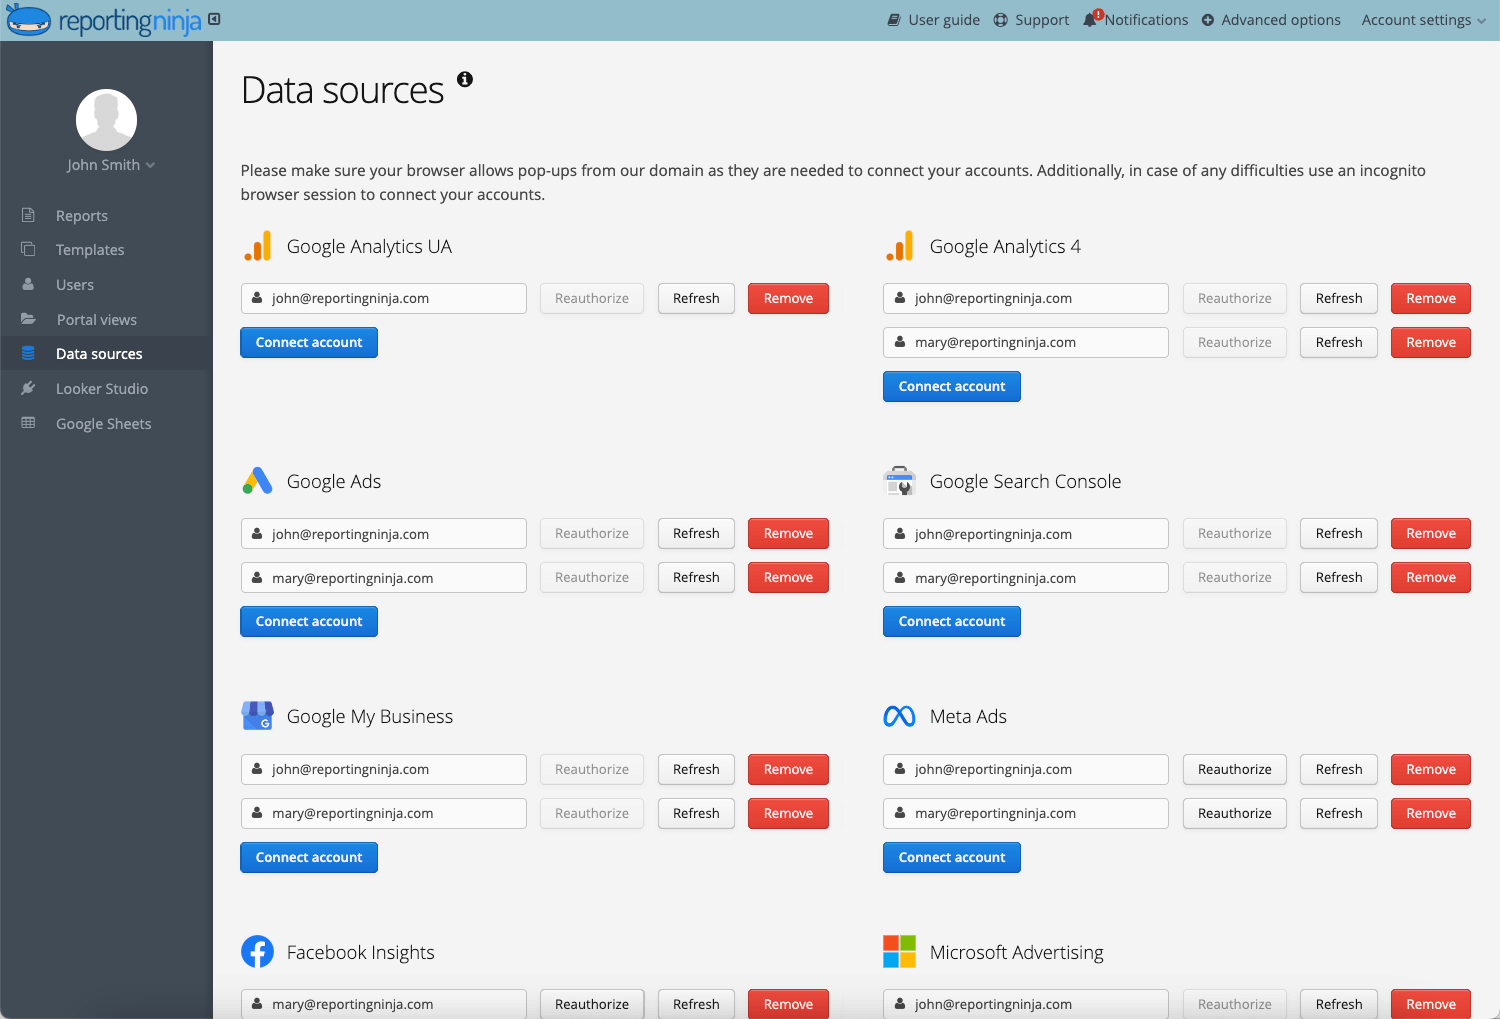
Before connecting anything, list every platform you currently pull data from, how often you use it, and who relies on that data. Then identify which platforms have native APIs, which require a third-party connector, and which still rely on manual exports.
If you're managing multiple clients, this audit also highlights inconsistencies, which you'll need to account for when standardizing reports across different platforms.
Use the findings from your audit to choose the marketing data integration that best matches your reporting needs and technical resources. Many organizations combine connectors, ETL tools, and reporting platforms depending on how their data is collected, transformed, and shared.
The goal is to choose the simplest setup that supports your reporting requirements today while leaving room to scale.
If you want automated client reporting rather than custom integrations, a managed platform like Reporting Ninja provides access to marketing data across multiple platforms without requiring you to maintain the underlying API connections.
Explore Reporting Ninja’s custom reports platform.
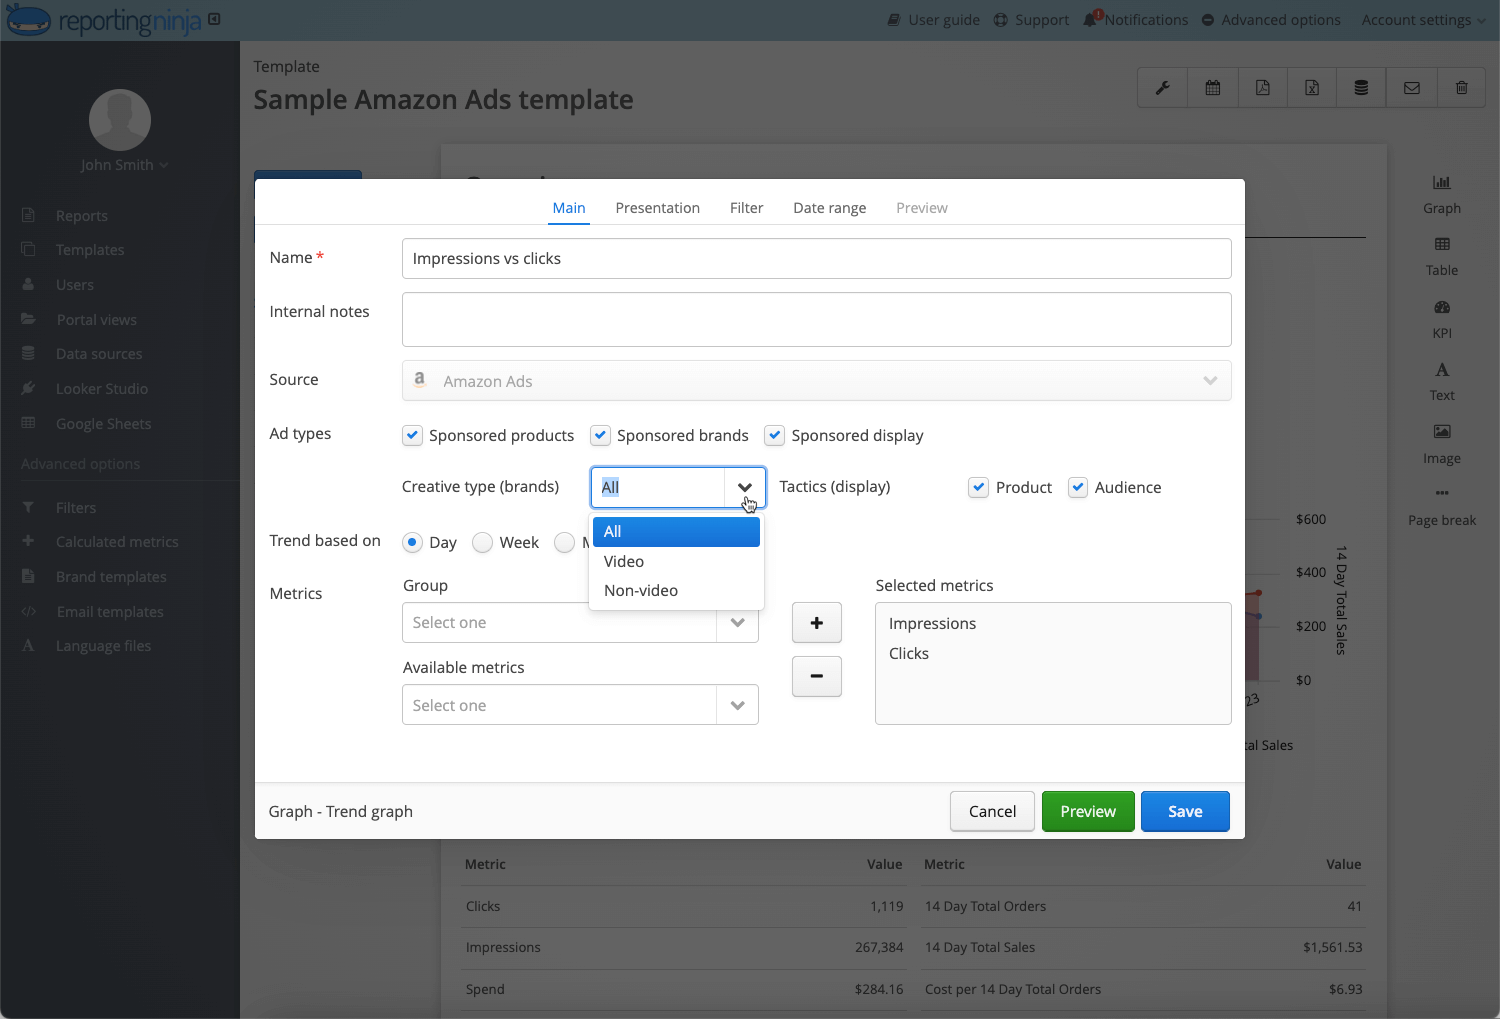
Once you've chosen a method, connect each account and verify that the data coming through matches what you expect. Pay particular attention to custom metrics and dimensions, such as custom conversions or UTM-based segments, to ensure they're mapped correctly rather than dropped or grouped incorrectly.
Field mapping means making sure equivalent metrics from different platforms represent the same business concept.
For example, Google Ads "Conversions" may not be directly comparable to Facebook Ads "Purchases" unless you've aligned attribution windows and conversion definitions beforehand.
See how a Facebook connector fits into an automated reporting workflow.
Decide how often the data needs to update. A daily internal dashboard might need hourly refreshes, while a monthly client report might only need to sync once a day, or even once before the report is generated.
Setting refresh frequency higher than you actually need adds unnecessary API load and can bump you against rate limits on some platforms, so match the schedule to how the data is actually used.
Before sending a connected report out, spot-check the numbers against the original platform for at least one date range. Confirm totals reconcile, filters are applied correctly, and custom fields show what you expect. This is easy to skip once a connector has run smoothly for a while, but it's worth revisiting any time you add a new account or a platform pushes an API update.
Reporting Ninja handles field mapping and refresh scheduling automatically, so the data stays clean without a manual check every cycle. Go from connected data to your first API call in minutes with Reporting Ninja’s REST API.
Avoid these common implementation mistakes
Once you've decided how you'll connect your marketing data, the next question is whether you need separate tools for integration, transformation, visualization, and reporting, or a platform that combines several of those capabilities. The right choice depends on your reporting goals, technical resources, and how much maintenance you're willing to take on.
If your team has development resources, you can work directly with each platform's API using standard HTTP clients or SDKs. This gives you the most control over exactly what data you pull and how you structure it, but it also means your team is responsible for authentication, pagination, rate limits, and keeping up with changes to the platform’s endpoints.
A development team might use the Google Ads API together with Python or Node.js to automatically pull campaign data into an internal analytics platform every morning.
Native platform APIs are best suited to SaaS companies, internal engineering teams, and organizations with proprietary systems or custom workflows. They are generally less suitable for agencies, small marketing teams, or organizations without the developer resources to build and maintain integrations.
ETL and iPaaS platforms specialize in moving data between systems, often including marketing data alongside other business data. These are worth it once your end destination is a warehouse rather than a report, or once you need to combine marketing metrics with sales or product usage data.
Use ETL if multiple departments share the data, marketing data needs to join finance data, you're building warehouse-first architecture, or you need it for predictive analytics.
Skip ETL if all you actually need is client reporting.
Business intelligence (BI) tools like Looker Studio and Power BI focus on visualizing data once it's been connected. Some include native connectors to marketing platforms, while others rely on dedicated connectors or ETL tools to bring data in first.
They're well suited to highly customized internal dashboards but generally assume the underlying data pipeline is already in place.
Reporting Ninja’s marketing API works differently by combining the connection layer and the reporting layer in one place. Instead of choosing between a raw API, a separate ETL tool, and a separate BI tool, you connect your accounts once.
This same connection feeds a custom reports platform, Looker Studio connectors, a Google Sheets add-on, and a REST API, all included on every plan rather than gated behind add-on fees.
The REST API in particular ships with a full OpenAPI specification, which means you (or an AI assistant) can query any connected integration in plain language without writing custom authentication logic from scratch.
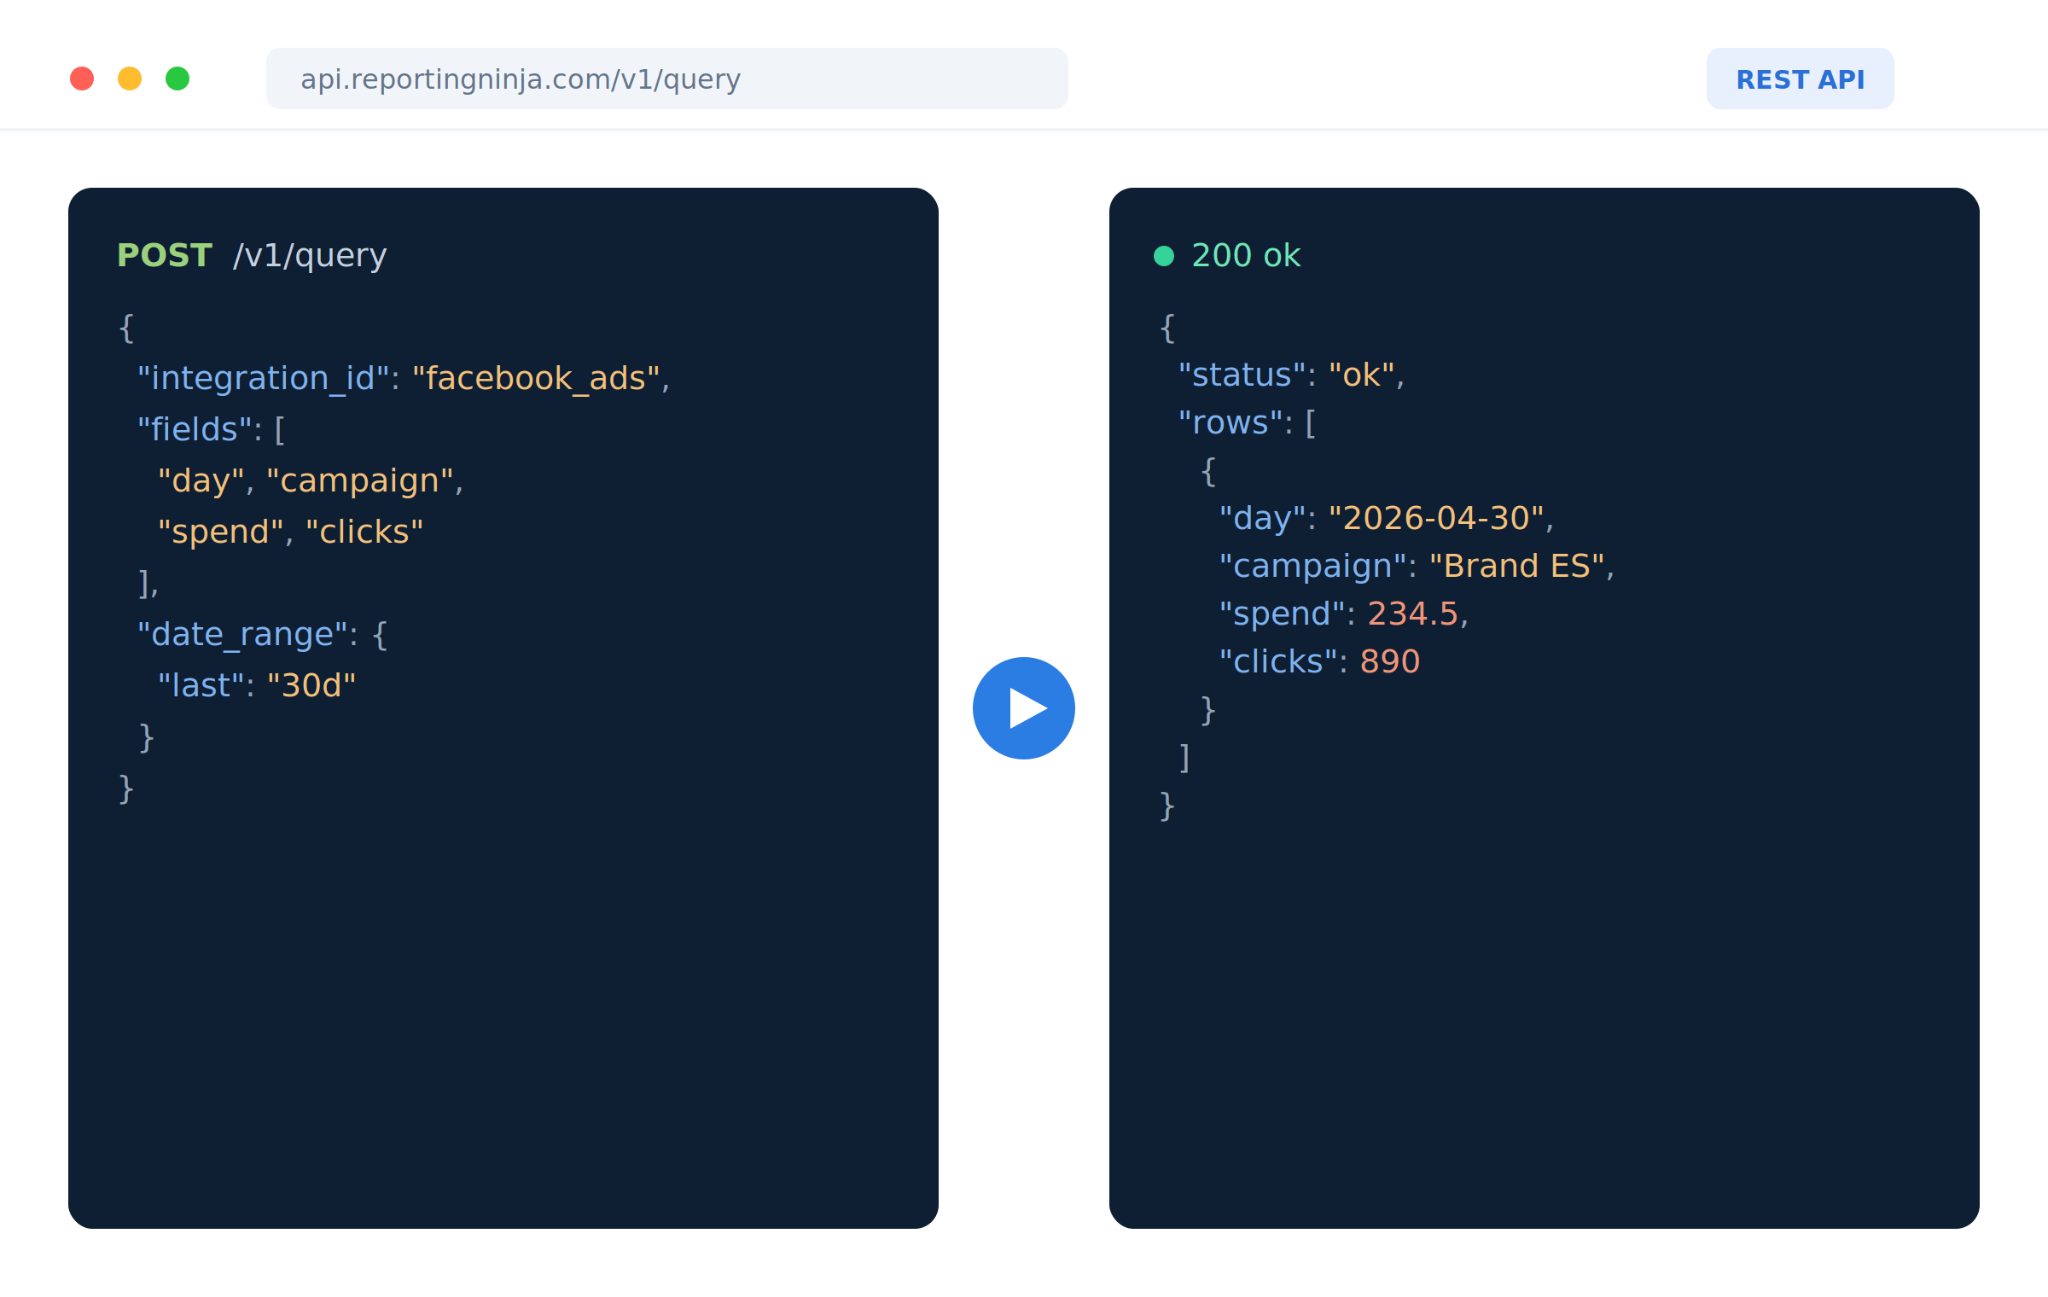
When you need to feed data into your own product for analysis, automate a reporting workflow, or build something completely custom, the API gives you the same clean, unified data that powers your reports, on your terms and in your own stack.
In practice, that consolidation matters most once you're managing more than two or three accounts and don't want to own connector maintenance yourself. Below that, a single native API or prebuilt connector inside whatever BI tool you already use may be enough.
Reporting Ninja bundles API access, dashboards, and white-label reports into every plan, starting at $20/month billed annually. Start your free trial and connect your data sources today.
The value of connected data becomes clearer with real setups. Here's how agencies, e-commerce brands, and in-house teams put marketing API integrations to work day to day.
A 15-person in-house marketing team at a B2B software company tracks paid media performance in Google Ads and LinkedIn Ads, while revenue and deal stages live in HubSpot. As a result, leadership can see clicks and ad spend but has no easy way to determine which channels are actually driving closed deals without manually reconciling spreadsheets.
The team decides to connect all three platforms through Reporting Ninja, then maps ad spend and lead source directly to HubSpot's deal stages, without writing any custom integration code.
Instead of reporting on cost-per-click, they now report on cost-per-opportunity and cost-per-closed-deal by channel. The monthly reporting cycle that used to take a day of manual reconciliation drops to about 20 minutes of review before the report goes out.
A freelance digital marketing consultant managing Google Ads for 18 local service businesses, plumbers, electricians, and dentists spends most of Friday logging into each client's Google Ads and Google Business Profile account separately to build a monthly PDF.
Clients paying for reporting as part of the retainer rarely open the reports, since they arrive late and look inconsistent from month to month.
The freelancer connects every client's accounts through Reporting Ninja and schedules automatic, white-label PDF delivery on the first of each month. Friday reporting work drops to about an hour of spot-checking before reports are sent.
A regional manager at a 40-location retail chain notices a Meta Ads campaign at a single store has been running with the wrong audience targeting for nearly three weeks, quietly burning through budget with almost nothing to show for it. Nobody had caught it sooner because performance reviews only happened once a month, and by then the damage was already done.
The chain has been running paid social and Google Business Profile independently at each location, with regional managers checking in only when they had time.
After connecting Meta Ads, Google Ads, and Google Business Profile for all 40 locations through Reporting Ninja and setting the dashboard to refresh daily, a similar targeting issue at a different location surfaces within three days instead of a month.
The team pauses it, fixes the targeting, and moves the remaining budget to locations that were actually converting.
Each of these teams replaced a manual reporting habit with a connection that runs on its own. Try Reporting Ninja for free to connect your own accounts and see the same shift on your reports.
Connecting your data sources is the hard part, and you've now seen how teams turn those connections into reports that build and send themselves. The payoff comes at the reporting stage. Instead of rebuilding the same report every cycle, Reporting Ninja pulls your connected data straight into scheduled, white-label reports that go out on their own.
That frees up the hours you'd normally lose to manual reporting for the analysis and strategy work clients actually pay for. If you want to see how connectors, field mapping, and refresh scheduling fit together in one place, the guide to marketing data integration walks through the full workflow.
Ready to put your own reporting on autopilot? Start your free trial and build your first automated report today, with no credit card required.
Marketing API connectors authenticate with a platform's API, request specific data fields on a set schedule, and deliver that data to wherever you've configured it to go, whether that's a reporting tool, a warehouse, or a custom app.
Not always. Small accounts with one or two data sources can sometimes manage with manual exports. Once you're managing multiple channels or client accounts, connectors remove most of the manual work and reduce reporting errors.
An API connector focuses on pulling data from a specific platform. An ETL tool focuses on moving and transforming data between multiple systems, which may include several API connections as part of a larger pipeline.
Sometimes. If your only goal is pulling platform data into a report, a connector alone is usually enough. Once you need to transform, enrich, or combine that data with systems outside marketing, like finance or product analytics, you'll typically still need an ETL layer alongside it.
{{cta-block-v1}}
Sign up for a 15 days free trial. No credit card required.

Build and automate amazing custom reports in a few clicks. Save time, be more productive, impress your clients.