Analytics
June 18, 2026
Marketing performance insights: analyze, optimize & prove ROI



You're not short on marketing data, but you're short on time to turn it into something you can act on. Any team can pull a report showing traffic up 20%, but knowing what caused it and what to do next is where the real challenge lies.
That gap is exactly what marketing performance insights close. They're the interpretation layer that sits on top of your metrics, showing what happened, why it happened, and what to do about it.
This guide walks through the types of insights that drive decisions, a step-by-step framework for generating them consistently, the mistakes that keep teams stuck at the metric layer, and the tools that make the whole process faster.
Marketing performance insights and analysis tools help you move beyond reporting numbers and start making better decisions. Every meaningful insight should answer a question and point toward a decision.
The table below maps the most common metric signals to the insights they generate and the actions they should trigger.
Audience insights reveal who engages with your marketing, how they behave, and which segments generate the highest value. Some teams focus heavily on campaign metrics while overlooking audience patterns. But some of the biggest performance improvements come from understanding which customer groups are most likely to convert.
For example, you might find that LinkedIn campaigns generate fewer leads than Meta Ads, but LinkedIn leads convert to paying customers at a much higher rate, resulting in lower customer acquisition costs. Without audience analysis, LinkedIn looks like an underperforming channel. But with the right insight, it becomes a growth opportunity.
Key audience metrics to track include:
Channel insights help you identify which marketing channels contribute most effectively to your goals. The challenge is that customer journeys rarely happen within a single platform. Someone may discover your brand through social, return via organic search, and convert through a paid search campaign.
That's why channel analysis should focus on contribution rather than isolation. According to the 2025 Nielsen marketing report, only 32% of marketers measure their marketing spend holistically. That means more than two-thirds of marketing teams may be making budget decisions on a partial picture.
Campaign insights focus on what specific ads, offers, creatives, keywords, or messages are driving performance. This is often where the quickest wins hide.
Examples include:
These answer the question every stakeholder eventually asks: Is this actually making money?
According to HubSpot's State of Marketing research, proving ROI is consistently one of the top three challenges marketers report. It points to a measurement gap rather than a results gap.
Financial insights include finding out your ROAS, CAC, CPL, LTV, and the relationships between them. If CAC rose 20% last quarter, the insight isn't "CAC is up." The insight is that “at this CAC, we need an LTV above X to stay profitable, and we're currently sitting at Y.” That's what drives decisions.
For freelancers and small agencies, operational insights are often the most immediately valuable category because they directly affect profitability.
Operational insights answer questions like:
Every hour spent compiling reports is an hour not spent optimizing campaigns or serving clients. That's why smaller teams prioritize understanding their reporting efficiency as a performance variable in its own right, not just a background administrative cost.
{{cta-block-v1}}
Generating reliable performance marketing insights is a repeatable process. Here's how to build one that works whether you're managing one client or twenty.
Before opening a dashboard, define the business outcome you're trying to influence. Many reporting problems crop up because teams track dozens of metrics without agreeing on what success looks like.
When metrics aren't tied to business goals, reporting becomes a collection of disconnected numbers. Consider the difference between these two reports:
The former is only showing numbers, while the latter is providing immediate context and a clear direction.
One of the biggest barriers to meaningful insights is inconsistent measurement. Different teams often define the same metric differently. Marketing might define a qualified lead one way while Sales uses another. Paid media teams may report conversions differently than analytics teams.
Without standardized marketing KPIs, insights become unreliable regardless of how good your data is.
Most marketing insights are hidden between platforms. When you look at each channel's data in isolation, they can each tell a completely different story. For example:
When these platforms are viewed separately, these metrics might point in different directions. Combined, the insight becomes clear that top-of-funnel campaigns are generating more traffic but lead quality is deteriorating. The action should be to refine targeting and optimize landing pages, not necessarily increase budget.
This is where most teams lose significant time every month. Data lives across platforms, requiring manual exports and spreadsheet updates before analysis can even begin. For teams managing recurring data, integrating data sources into a single platform makes timely insight delivery possible.
A good number of performance reports skip this step. They stop at the metric layer and never reach the insight or action layer, which means stakeholders have to draw their own conclusions from numbers that were never interpreted for them.
A useful reporting process moves through four layers:
If your weekly reports summarize what happened but never explain why or recommend what to do next, you're basically generating data and providing no insights. Aim for at least one recommendation for every major insight uncovered in your report.
If your team spends days collecting data, updating spreadsheets, and formatting dashboards, opportunities can disappear before decisions are made.
Consider a freelancer managing ten client accounts, with manual reporting taking up three hours per client each month. That's 30 hours a month spent on data collection and formatting before analysis even begins. Automated marketing reports remove that overhead.
A platform like Reporting Ninja is built specifically for this. You connect your data sources once, build your report template once, and our platform handles generation and delivery on schedule, whether that's weekly to a client or daily to an internal team.
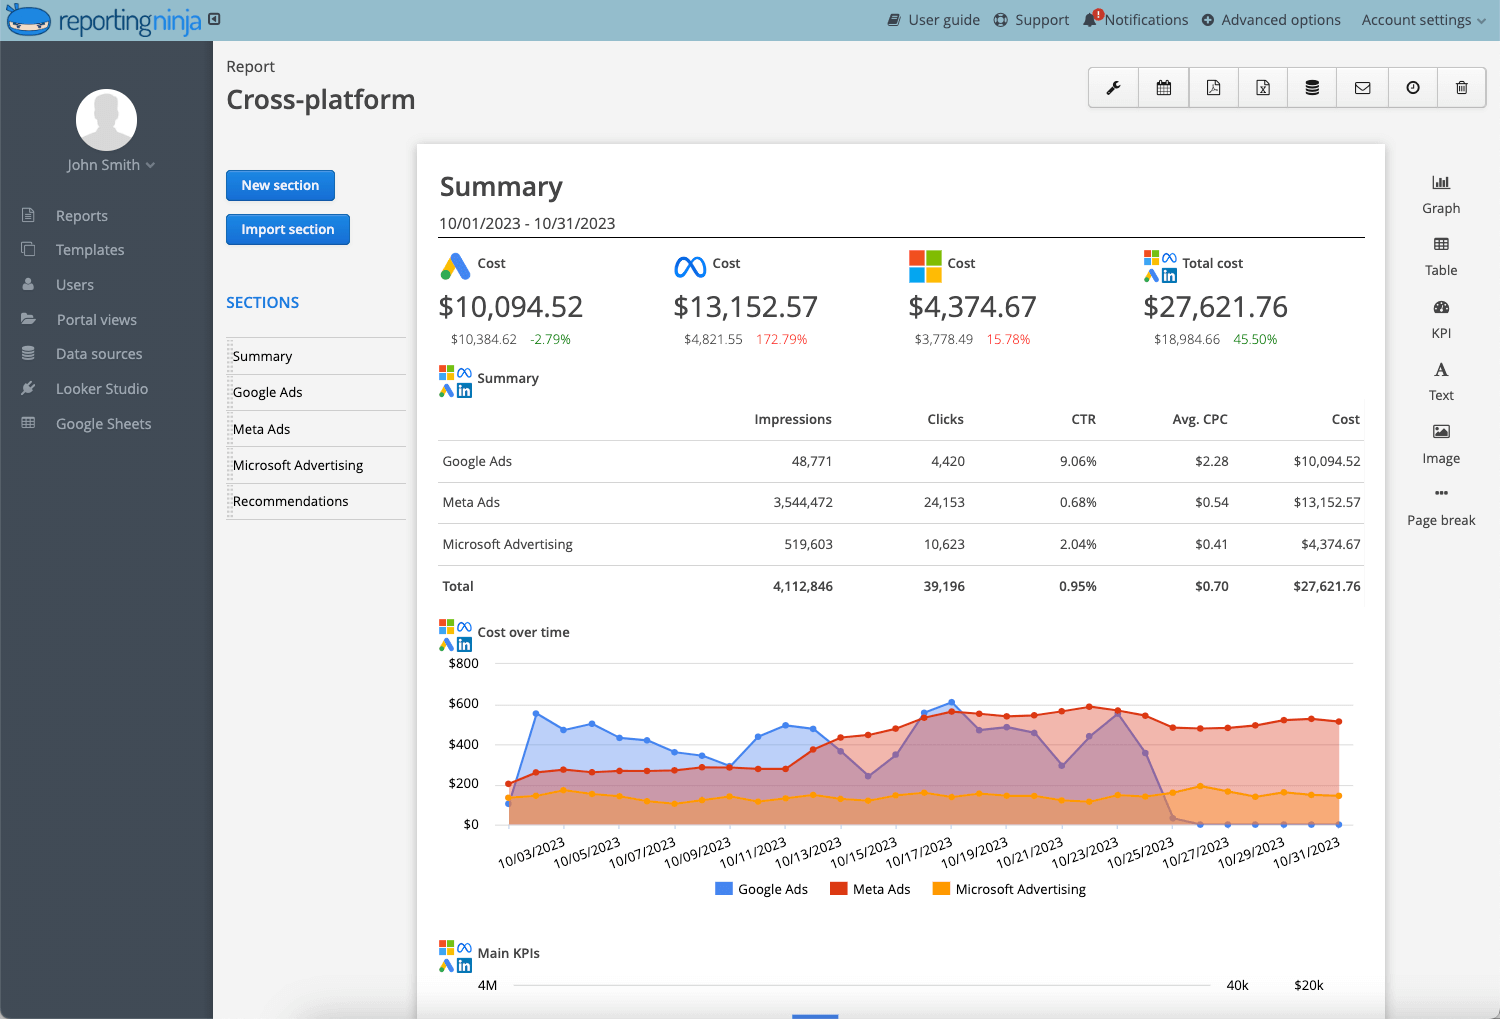
What that means in practice:
Reporting Ninja supports automated reports across paid search, paid social, SEO, analytics, and more. You can deliver them through our built-in custom reports platform, through Looker Studio connectors, or through the Google Sheets add-on, depending on what each client or stakeholder prefers.
Start your free 15-day trial for Reporting Ninja to see it in action.
Treating metrics as the final deliverable is the most common reporting mistake. 25% higher traffic, 18% more clicks, and 12% lower CPC tell you nothing about whether the business improved.
Reports need to answer what happened, why, and what to do next. Without all three, stakeholders are left to draw their own conclusions.
Many metrics dashboards become cluttered with information overload. A lead-generation campaign may only need five metrics: qualified leads, conversion rate, cost per lead, CAC, and revenue generated. Everything else is supporting context that can live in a secondary view.
If you evaluate performance using only the final touchpoint, you miss most of the story. Instead of asking which channel generated the conversion, ask which channels influenced it. Looking at performance across all marketing data integrations creates a more accurate understanding of what's actually working.
Monthly reporting cycles let campaigns waste budget before problems surface. Automated reporting ensures stakeholders receive updated data on a predictable schedule. The faster insights reach decision-makers, the faster improvements get implemented.
Getting insights at scale requires the right infrastructure. Here's a comparison of the main tool types, their strengths, and where they fall short.
No single tool does everything. The most effective reporting stacks combine analytics, visualization, and automated reporting.
Below, we cover three of the most popular ones:
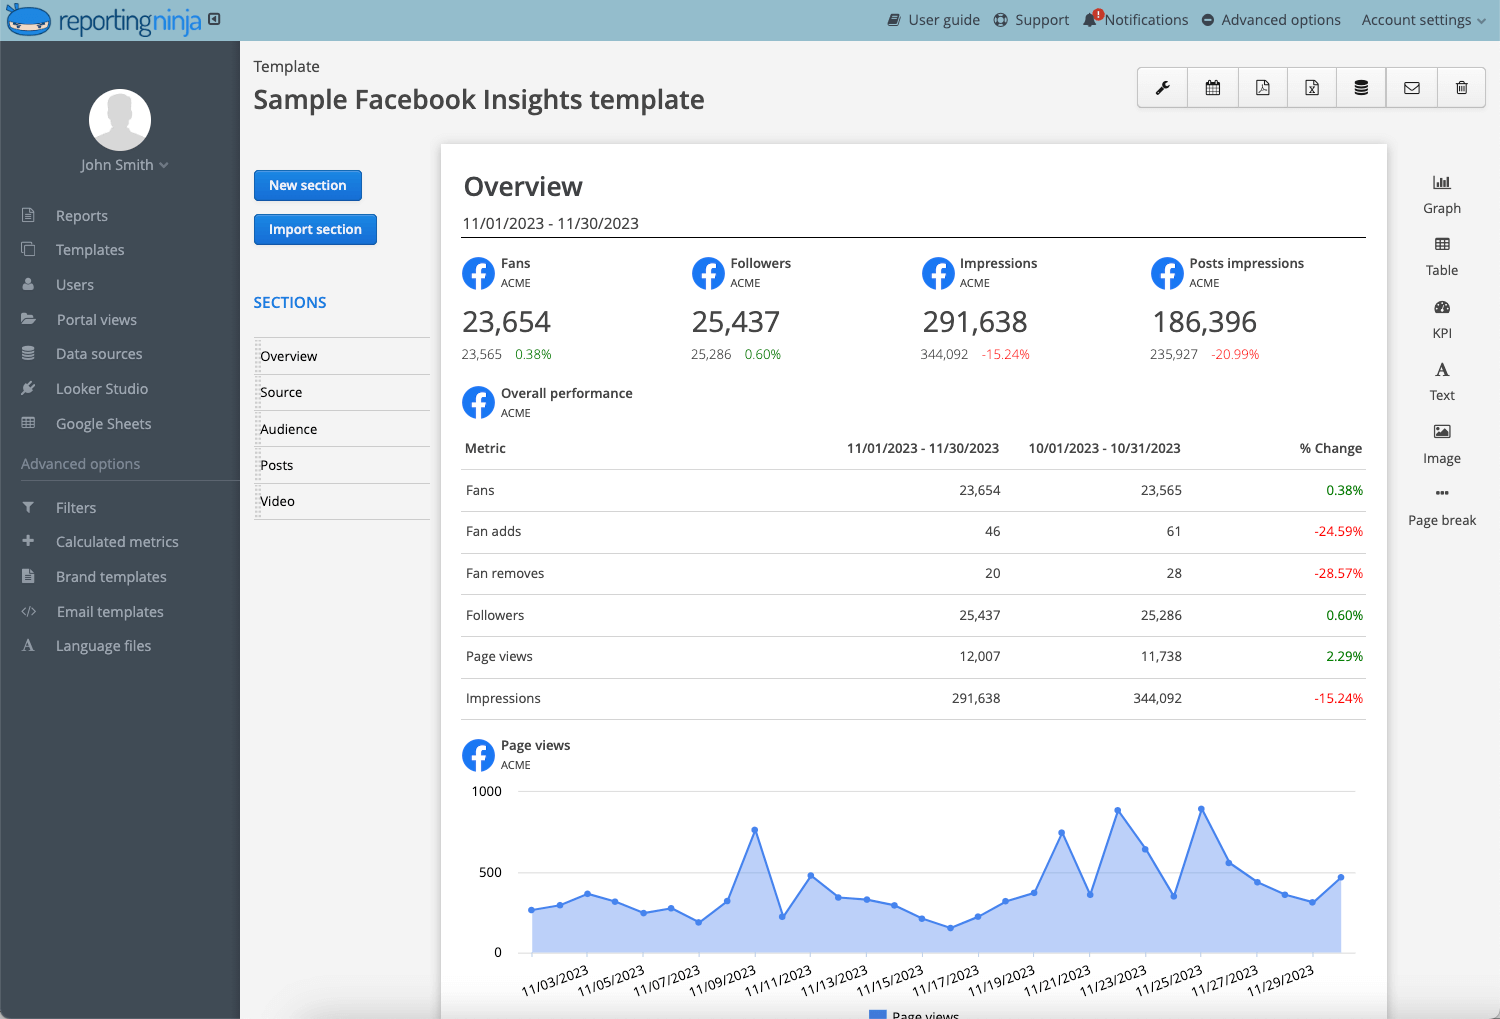
Reporting Ninja is built for freelancers, small agencies, and lean marketing teams who need reliable, client-ready reports without the overhead of a full BI stack or the repetitive effort of manual reporting.
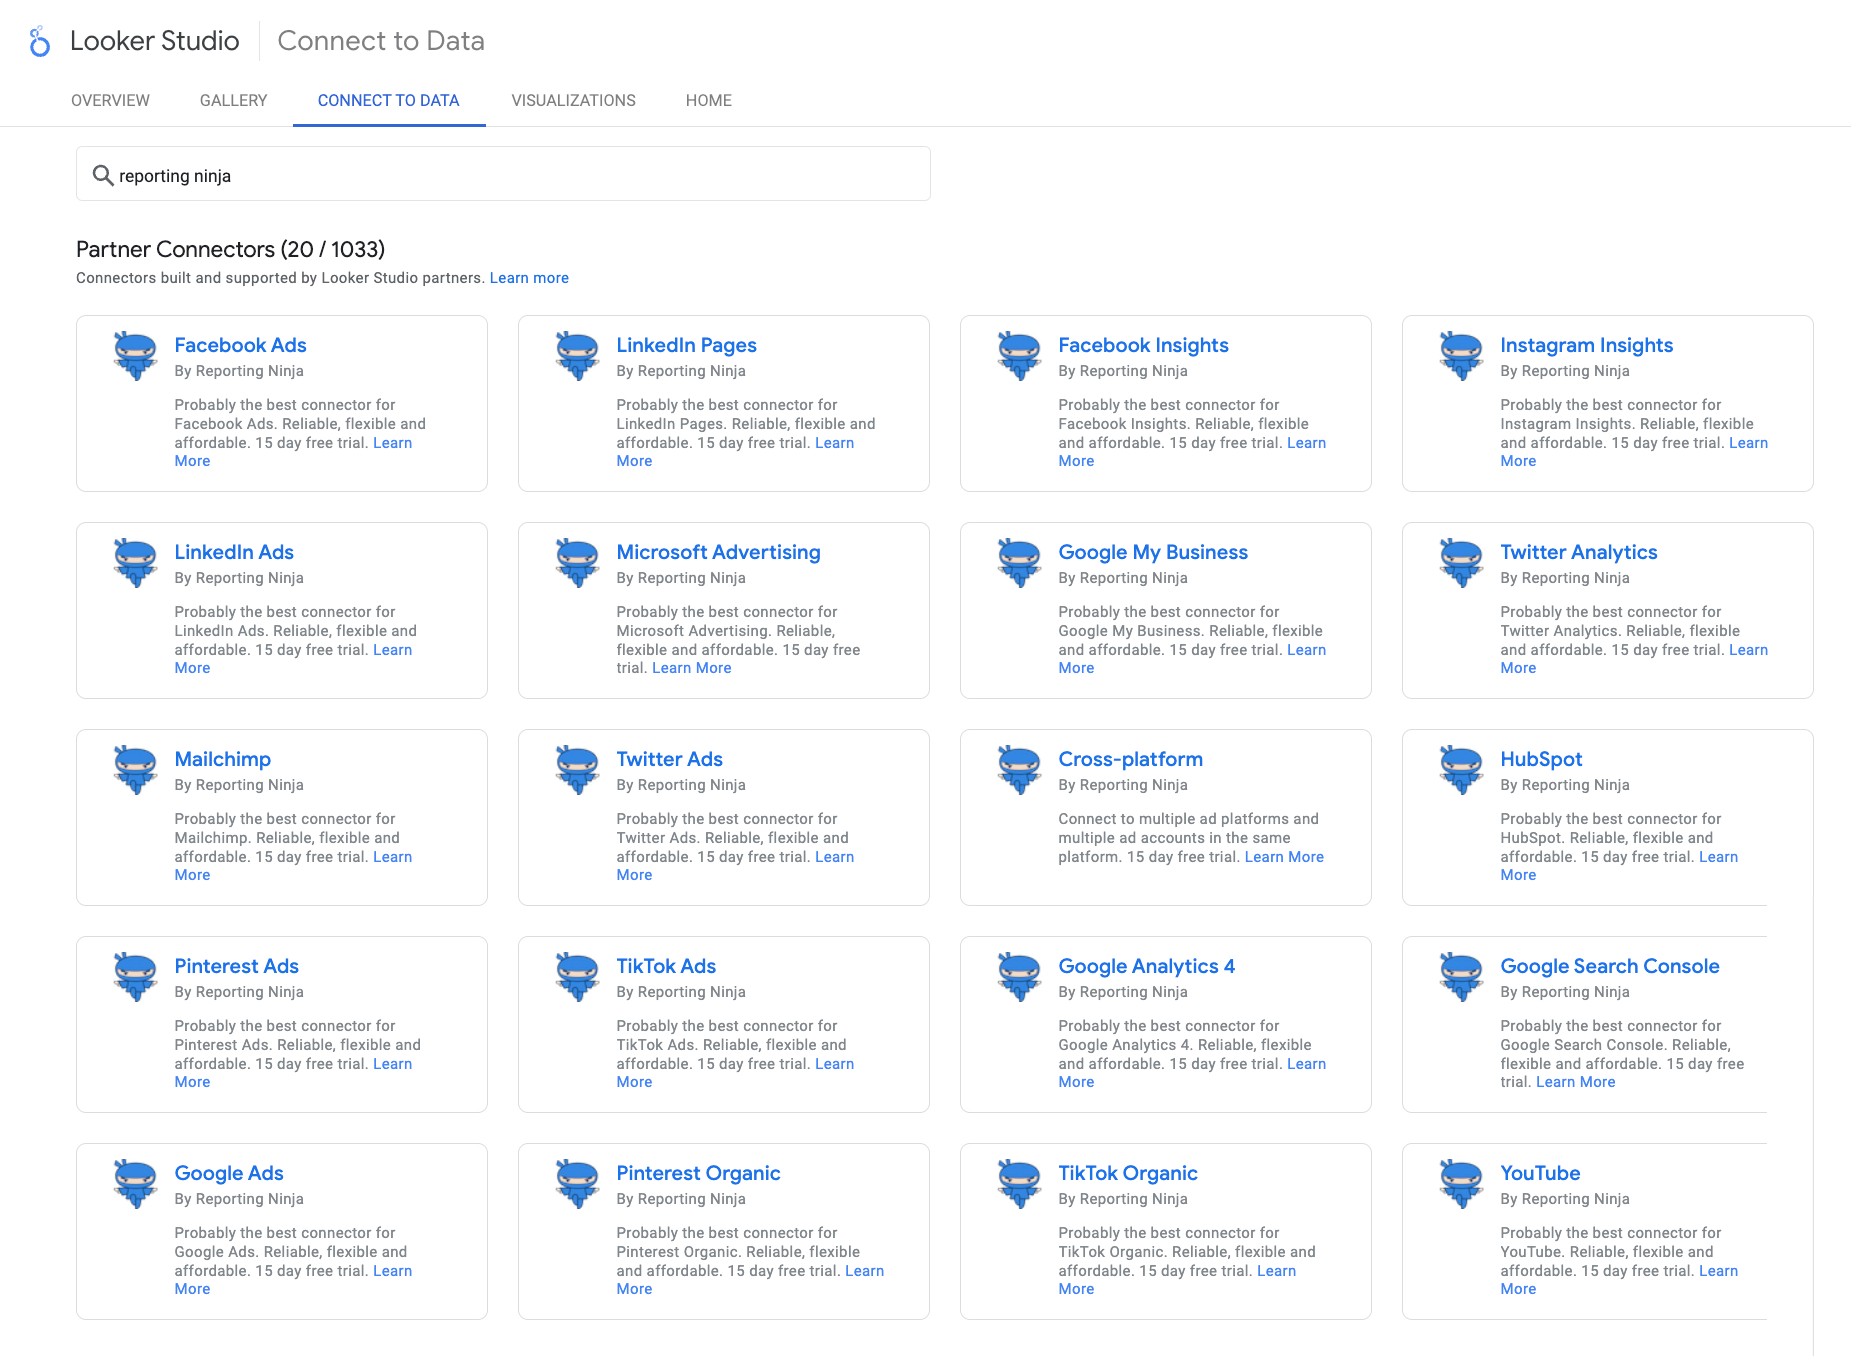
The platform supports three reporting approaches:
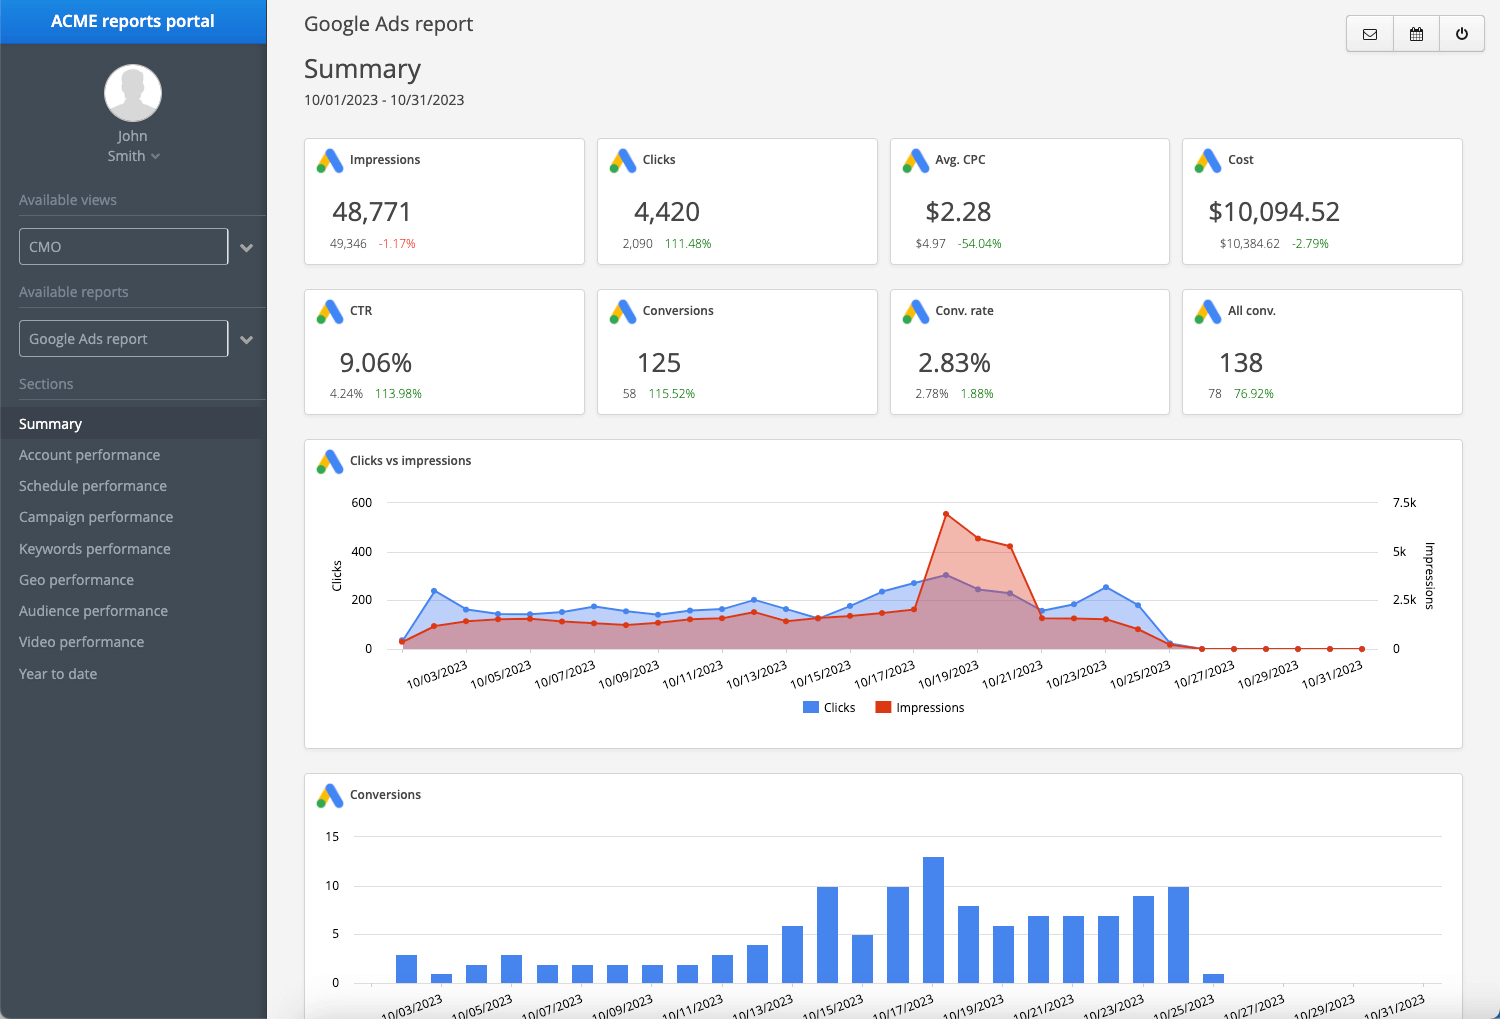
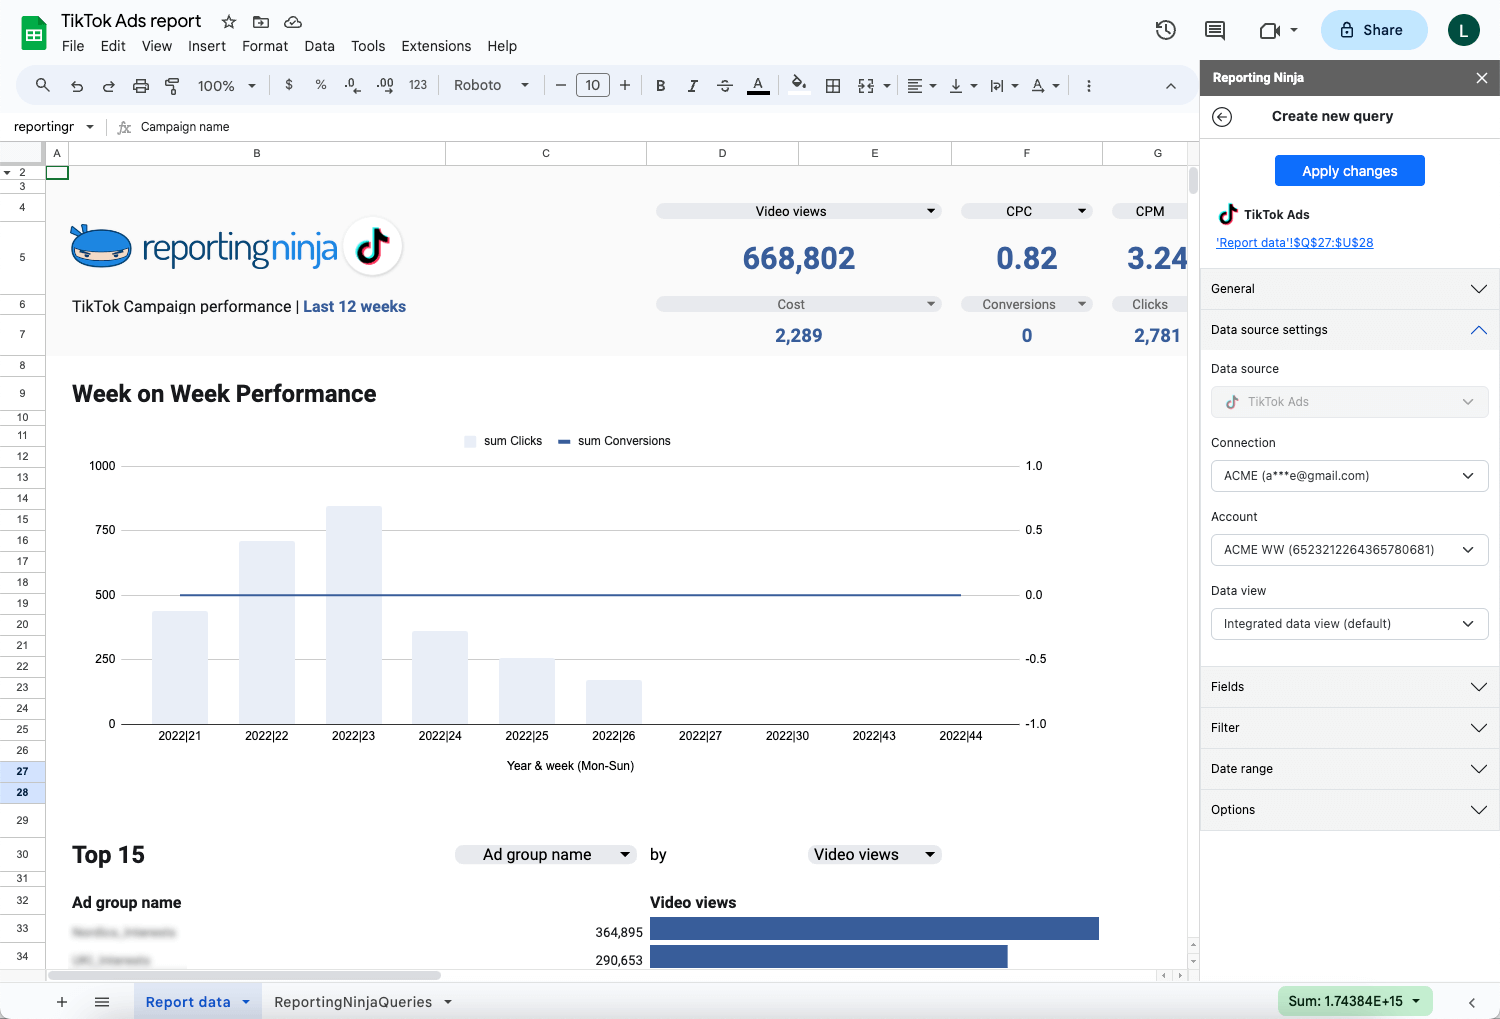
For agencies, the biggest benefit is automation. Instead of spending hours each month exporting data, combining spreadsheets, updating dashboards, and formatting client reports, those reports are scheduled and delivered automatically. That time goes back to deeper analysis and strategy-building.
Every paid plan includes all integrations, all destinations, and all core features. No tier-gating as your client base grows. Plans start at $20/month billed annually, making professional automated marketing reports accessible without enterprise-level costs.
Best for: Freelancers, boutique agencies, and small in-house marketing teams that want automated, client-ready cross-channel reporting without paying enterprise-platform prices.
{{cta-block-v1}}
GA4 is the standard for website and conversion analytics, and most marketing teams use it as a foundational data source rather than a standalone reporting environment.
The platform focuses on website behavior, so marketers reporting across paid advertising, social media, CRM, and SEO performance need additional tools to consolidate those sources into a single view. That's why most agencies treat GA4 as a data source that feeds into a broader social media analytics dashboard or cross-channel report, rather than as their primary reporting environment.
Best for: Teams that need deep on-site behavioral data, including traffic sources, conversion paths, and user flow, but who pair it with a separate tool for cross-channel reporting.
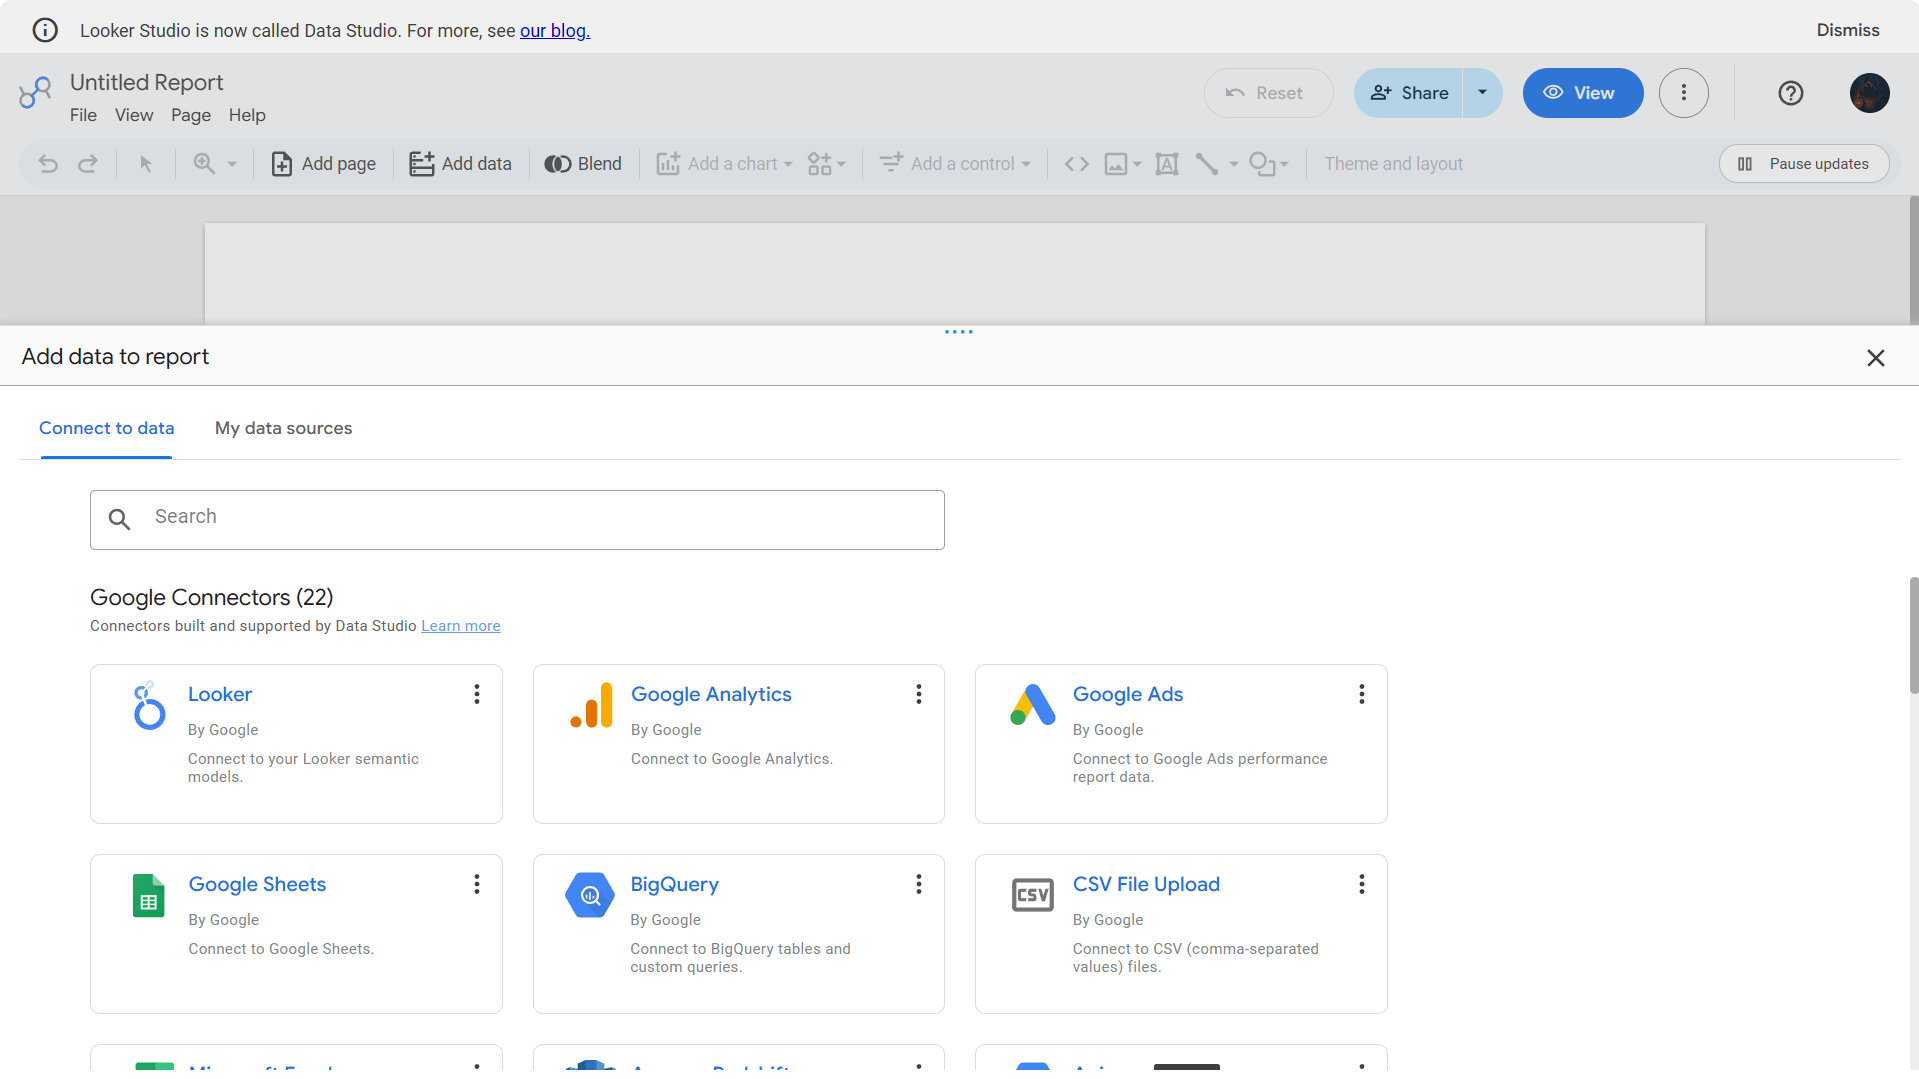
Looker Studio (now Data Studio) is widely used for creating custom marketing dashboards. It allows marketers to build visual reports from multiple data sources and share them with clients or stakeholders, and it's free to use.
Reporting Ninja's Looker Studio connectors address the connectivity and maintenance overhead if Looker Studio is already your team's preferred format.
Best for: Teams that want fully customizable dashboards and are comfortable managing connectors and data refresh maintenance across multiple client accounts.
Start your free trial of Reporting Ninja and see how it fits into your current reporting stack.
The gap between having data and getting insights from it comes down to how fast and reliably you can move from raw numbers to a decision-ready report.
Valuable insights often get buried under fragmented data, inconsistent metrics, and time-consuming reporting processes. When teams spend hours collecting and formatting data, they have less time to analyze performance and act on what they find.
Reporting Ninja helps marketers automate recurring reports, consolidate data from multiple channels, and deliver client-ready reporting without the manual work.
Plans start at $20/month billed annually, and all integrations are included in all plans. No feature gating between plans. Start your free 15-day trial at Reporting Ninja or see how our pricing compares for your team size.
{{cta-block-v1}}
Marketing performance insights are interpretations of your marketing data that explain what happened, why it happened, and what to do about it. They go beyond raw metrics to surface the context and patterns that inform decisions.
A metric is a number, while an insight is a number with meaning and a next step. "CTR dropped 22%" is a metric. "CTR dropped 22% because ad frequency hit 8.4 and the audience is saturated, so we need to refresh creative or expand targeting" is an insight.
It depends on your business goals, but the metrics most closely tied to outcomes include CAC, conversion rate, revenue, ROAS, CLV, pipeline contribution, and CPL. Rather than tracking dozens of metrics, prioritize the KPIs that directly answer whether the business is growing.
Automated reporting platforms connect to your marketing channels, generate reports on a schedule, and eliminate manual exports and formatting. Reporting Ninja pulls data from Google Ads, Meta Ads, GA4, Search Console, LinkedIn Ads, and more into a single workflow, simplifying marketing data management before automatically delivering reports so your team can focus on analysis instead of administration.
Reporting on what happened without explaining why or recommending what to do next. A report that describes performance is useful. A report that drives decisions is valuable. The distinction usually comes down to whether the person writing the report has time for analysis or is still stuck in data collection. Automating the collection and formatting layer is what creates that space.
Sign up for a 15 days free trial. No credit card required.

Build and automate amazing custom reports in a few clicks. Save time, be more productive, impress your clients.