Analytics
May 27, 2026
[2026] Google Analytics SEO dashboard examples & use cases

![[2026] Google Analytics SEO dashboard examples & use cases](https://cdn.prod.website-files.com/65bd4cd0ea7dc98c12446765/69380622f39c35fadfe8abd6_Google%20analytics%20seo%20dashboard.webp)
GA4 buried your SEO data. Traffic sits in one report, engagement in another, and conversions are hidden behind menus. You need multiple tabs open just to answer a simple question: did last month's content actually work?
An SEO dashboard fixes this.
Instead of chasing numbers across GA4, you get one clear view of organic sessions, engagement quality, landing page performance, and conversions. Trends become obvious. Problems surface faster. And you spend less time digging through reports and more time improving what matters.
This guide shows you what to include, how to structure your dashboard, and how to automate the entire thing using GA4, Looker Studio, or Reporting Ninja — without rebuilding reports every month.
A Google Analytics SEO dashboard is a custom interface (built in GA4 or Looker Studio) that brings your key SEO metrics into a single view. Instead of jumping between GA4’s Acquisition, Landing Pages, and Search Console reports, you see your core search KPIs together: organic sessions, CTR, engaged sessions, conversions, and landing page performance.
Because GA4 is now the default version of Google Analytics, your SEO data is more scattered than it was in Universal Analytics. Learning how to build a comprehensive Google Analytics SEO report fixes this by consolidating your organic traffic, engagement, and goal-tracking metrics in one place. That makes trends easier to spot, issues faster to diagnose, and reporting far more efficient.
Your SEO dashboard should highlight the metrics that explain how search visitors find your site, how they interact with your content, and whether they take meaningful actions. Because GA4 uses an event-based model, engagement and conversions are central to understanding performance.
Organic sessions show how many users arrive from search engines. This is your clearest indicator of visibility and whether your content or technical updates are improving rankings. When organic sessions slow down, it often points to stale content, increased competition, or crawling/indexing issues that need attention.
GA4 counts an engaged session when a user spends 10 seconds on your site, views more than one page, or triggers a conversion event. This replaces the old bounce-rate mindset and gives a clearer signal of intent match. Low-engagement sessions usually mean the content doesn’t fully address the query, the page loads slowly, or the layout makes it hard for users to find what they need.
Your landing pages reveal which parts of your site attract organic visitors — and how well those pages hold attention. Metrics like engagement rate, average session duration, exits, and scroll depth tell you whether the content actually satisfies search intent. Pages with high traffic but low engagement often need more focused messaging, improved UX, or tighter internal linking.
In GA4, all conversions are events: sign-ups, form submissions, purchases, demo requests, or any action that signals value. Tracking organic conversions shows whether your SEO efforts drive outcomes, not just traffic. If a page attracts visitors but few conversions, the issue usually lies in keyword alignment, CTA placement, or friction in the conversion path.
Search Console data rounds out your dashboard with visibility into what people search for and how often they click. CTR is particularly useful: when impressions are high but CTR is low, your titles and meta descriptions aren’t compelling enough for the query. Query-level data also helps you spot new content opportunities or pages that rank well but don’t persuade users to visit.
Together, these metrics give you a complete view of your organic performance: who’s finding you, how effectively your content meets their expectations, and whether those visits turn into meaningful actions.
Building an SEO dashboard in GA4 or Looker Studio helps you pull your core organic metrics into one place. GA4’s reporting is limited, so most teams use Looker Studio for actual dashboards. Follow these steps to build a clean, reliable SEO view.
Decide what you’re trying to monitor: growth, engagement quality, or conversions. A dashboard trying to track everything becomes cluttered and unusable.
Most teams use Looker Studio because GA4 doesn’t offer a drag-and-drop dashboard builder.
Stick to the essentials:
Don’t add metrics just because they’re available; focus on what drives decisions.
Start with top-level traffic and engagement, then add landing page tables and conversions below. Group related widgets together so the dashboard reads top-to-bottom like a story.
Before publishing, compare your dashboard metrics to GA4’s Acquisition > Traffic Acquisition report to confirm everything aligns.
These best practices help you build a dashboard that’s accurate, easy to maintain, and useful for ongoing optimisation.
Seeing how real dashboards are structured makes it easier to decide what to include in your own. The examples below highlight the layouts most SEO teams use when reporting on performance, diagnosing issues, and identifying opportunities. Each one helps you understand a different part of the organic journey — visibility, behaviour, and outcomes.
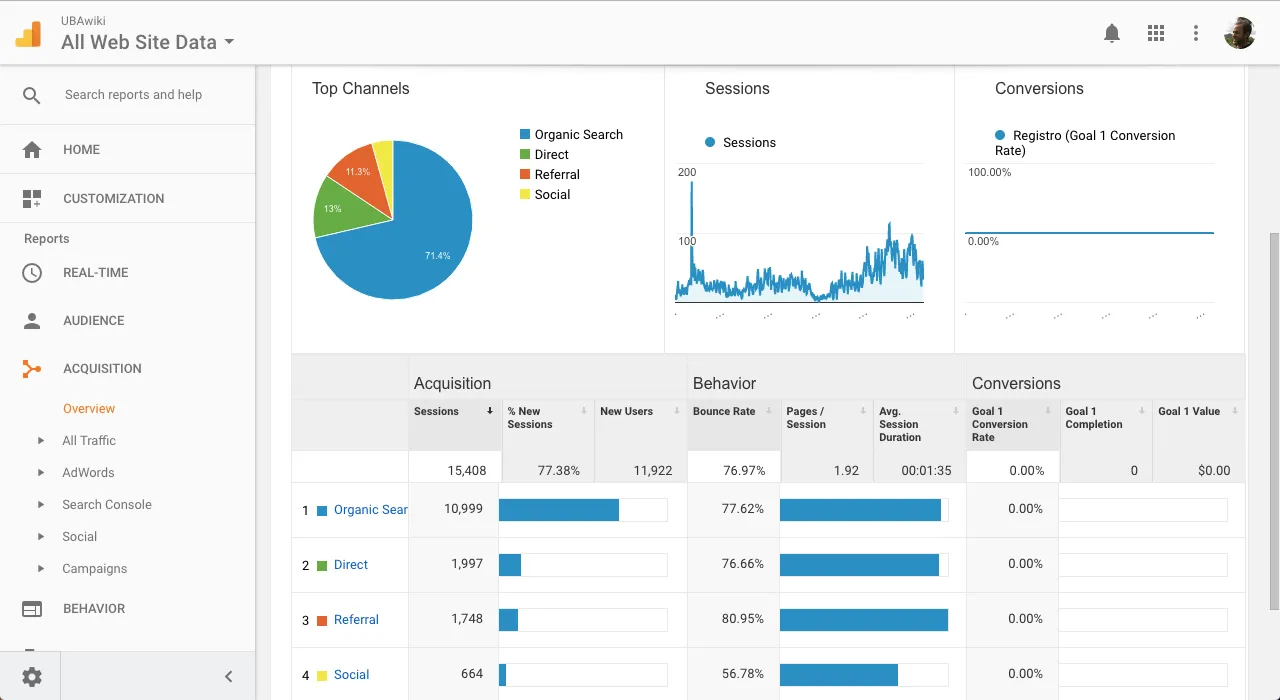
This is the top-level snapshot most dashboards start with. It typically includes organic sessions, engaged sessions, new vs returning users, and event conversions. A 12-month trend line helps you catch seasonal patterns or early drops in visibility.
Many teams also include a simple table ranking top landing pages by sessions, so you can see where most organic traffic originates.
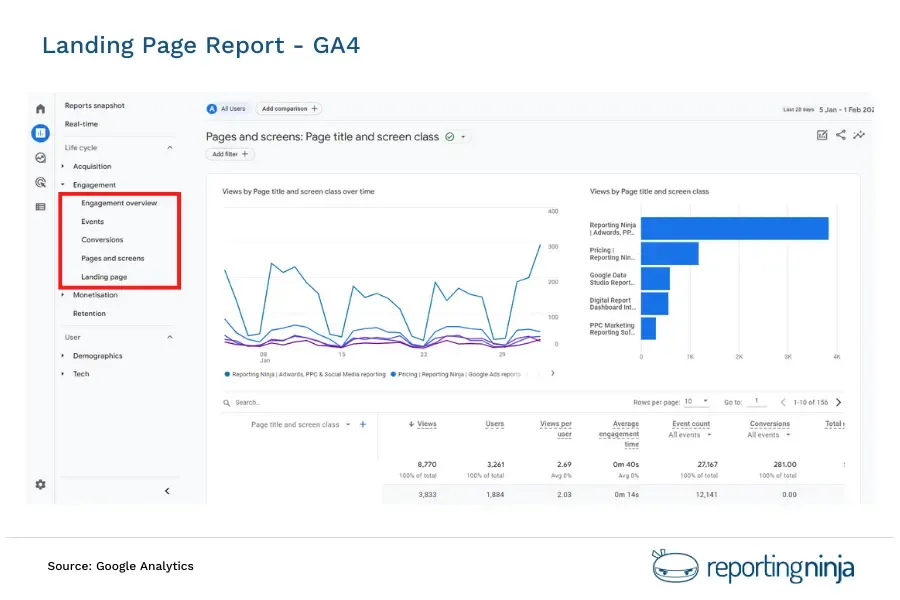
A deeper look at individual pages shows which URLs attract attention and how well they hold it. Useful metrics here include engagement rate, average engagement time, scroll depth, exit rate, and conversions for each page.
This view helps you spot content that ranks well but under-performs with users, often signalling that the page needs structural improvements, clearer messaging, or faster load times. Filtering to pages with at least 100 sessions keeps the analysis focused.
This example brings rankings and behaviour into one place. You’ll typically combine Search Console metrics (impressions, clicks, CTR, average position) with GA4 data (engaged sessions, engagement rate, event conversions).
Seeing these side by side shows how queries translate into clicks, how those clicks behave on your site, and which keywords lead to meaningful actions.
This is one of the most useful views for identifying new content opportunities or pages that need title/meta updates.
A conversion-focused dashboard shows which landing pages and queries generate outcomes like sign-ups, form submissions, or purchases.
Because GA4 uses event-based tracking, this view makes it easier to connect organic traffic to business results.
Most teams break conversions down by landing page, device, and query so they can see which pages deliver high-value traffic and which attract visitors but fail to convert.
Use these structures as a starting point and adjust them to match your goals, your reporting cadence, and the depth of insight your audience needs.
Building dashboards in GA4 takes time, and Looker Studio still requires manual setup, connectors, and constant maintenance.
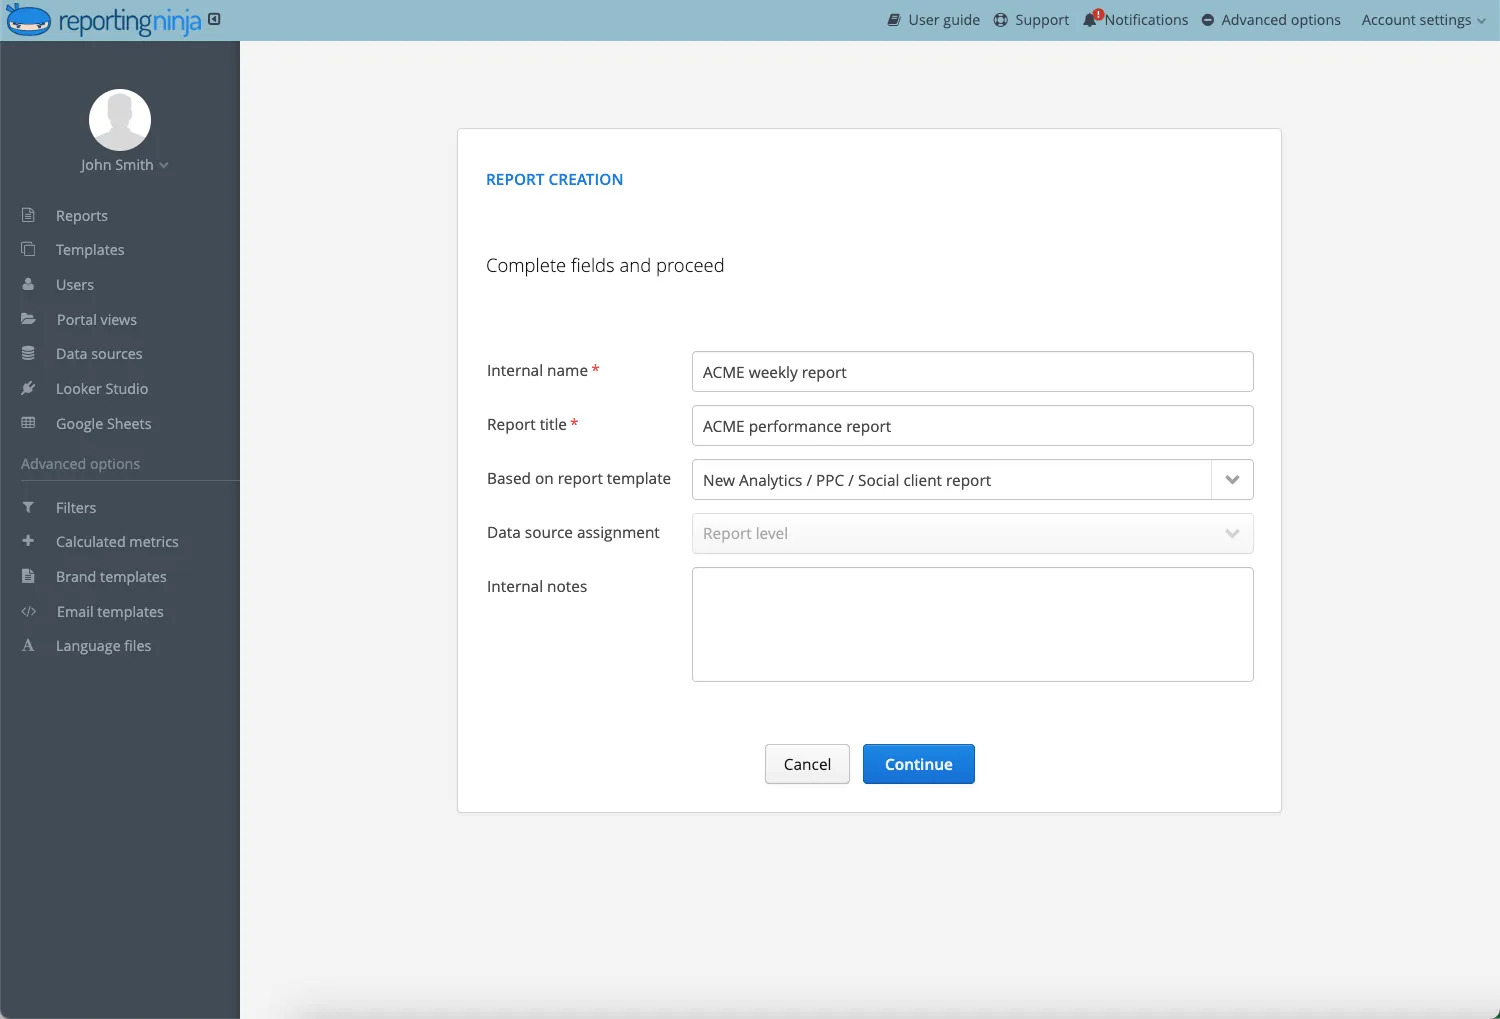
Reporting Ninja removes all of that. You start with a ready-made SEO dashboard template and everything you need is already mapped.
Choose an SEO template and your dashboard loads instantly with traffic, engagement, conversions, landing page performance, and Search Console data already connected.
You can customise any widget in seconds: add or remove metrics, change chart types, apply filters, or adjust date ranges. Everything is drag-and-drop: no GA4 menus, no configuration files, and no broken data sources to fix.
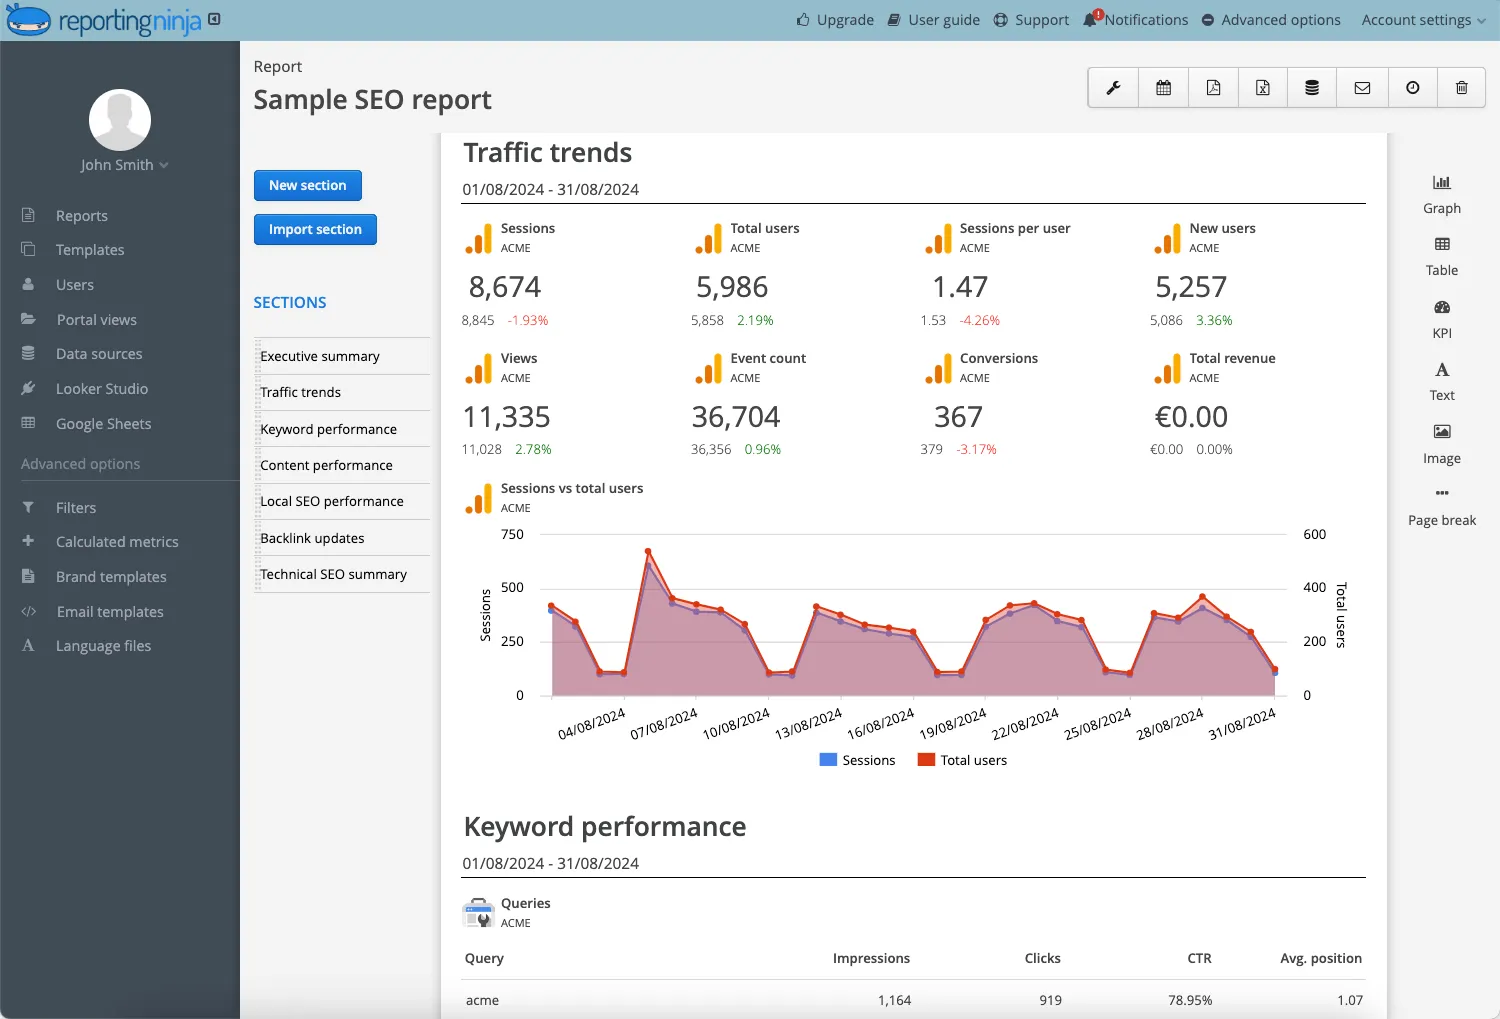
White-labelling takes just a moment. Upload your logo, set the brand colours, and share the dashboard as a link or export it as a PDF.
You can schedule automated delivery (daily, weekly, or monthly), so clients receive reports without you rebuilding anything. No manual exports, no copy-pasting charts. The dashboard updates automatically and sends itself.
Reporting shouldn’t take longer than the work it’s describing. GA4 and Looker Studio make even simple SEO dashboards slow to build and easy to break. Reporting Ninja removes that friction. Your dashboard loads with the core metrics already connected, branded, and ready to share.
The result is an SEO reporting process that takes minutes, not hours. You spend your time analysing what matters - which pages are growing, where engagement drops, and how organic traffic converts - instead of rebuilding the same layout each month.
If you want fast, consistent, and easy to maintain seo reports for clients, start with a Reporting Ninja dashboard. It gives you the insight you need without the overhead.
Sign up for a 15 days free trial. No credit card required.

Build and automate amazing custom reports in a few clicks. Save time, be more productive, impress your clients.