SEO
January 20, 2026
Top 5 Looker Studio alternatives & competitors (2026 updated)

If Looker Studio is slowing you down with broken dashboards or manual reporting, here are five strong alternatives for 2026, covering automated marketing reports, BI governance, visual analytics, and KPI dashboards.
Reporting Ninja is one of the most practical Looker Studio alternatives if your main goal is automated marketing reporting, whether you need SEO reporting or PPC reporting capabilities, without stacking multiple tools.
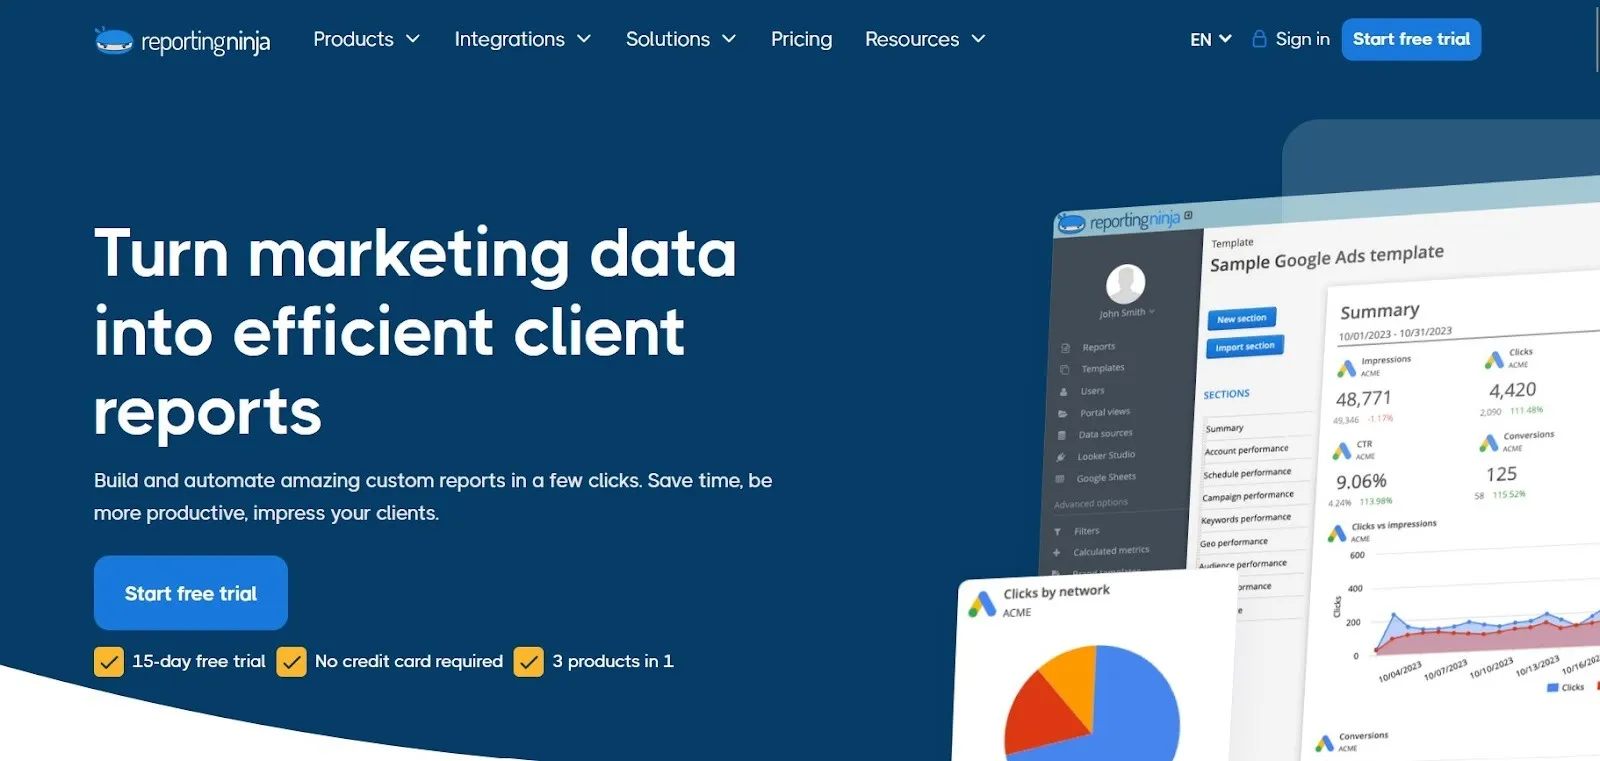
It gives you Looker Studio connectors, a Google Sheets add-on, and its own reporting platform in every plan. Pricing starts at $20/month, which makes it a strong fit for agencies managing recurring client reporting.
Reporting Ninja focuses on the workflows most teams struggle with in Looker Studio: getting reliable cross-platform data into reports, keeping it refreshed, and reusing report structures across clients.
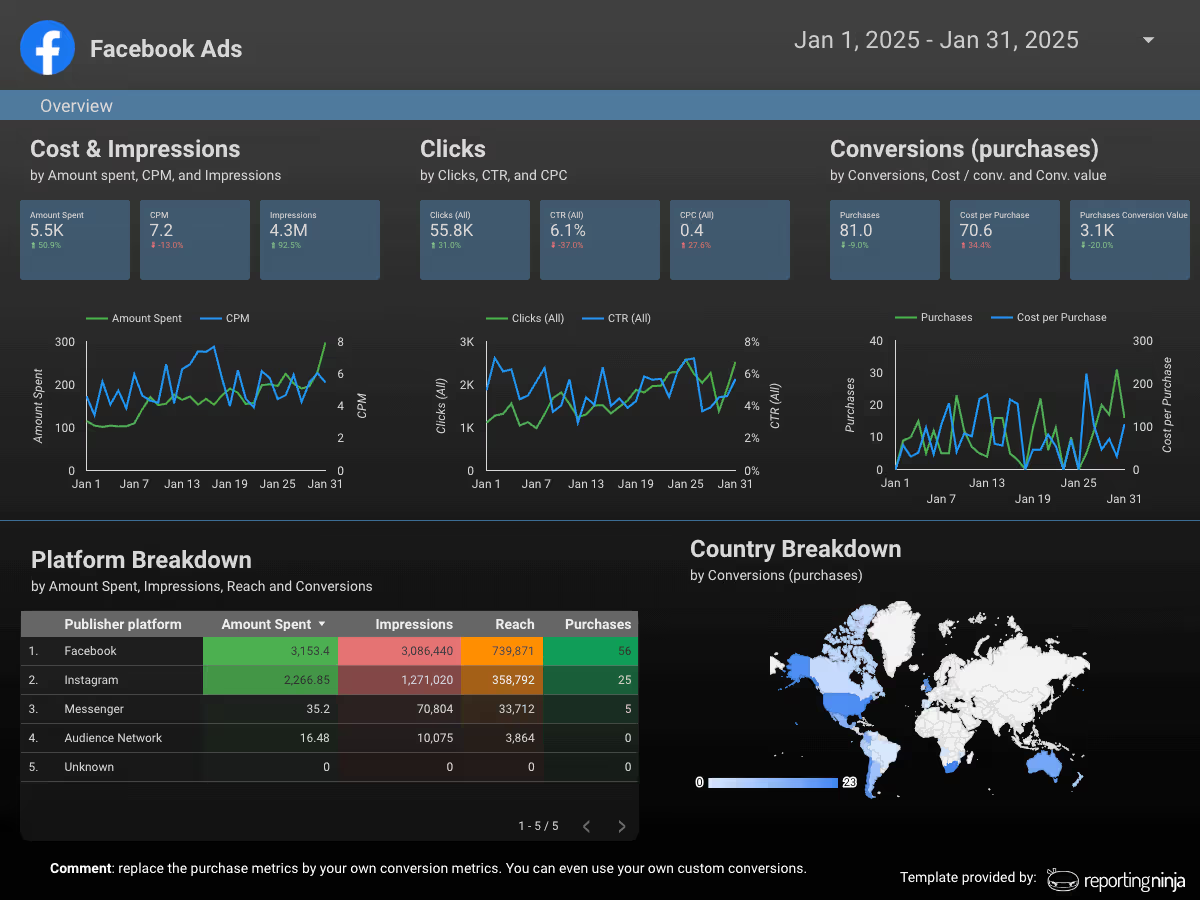
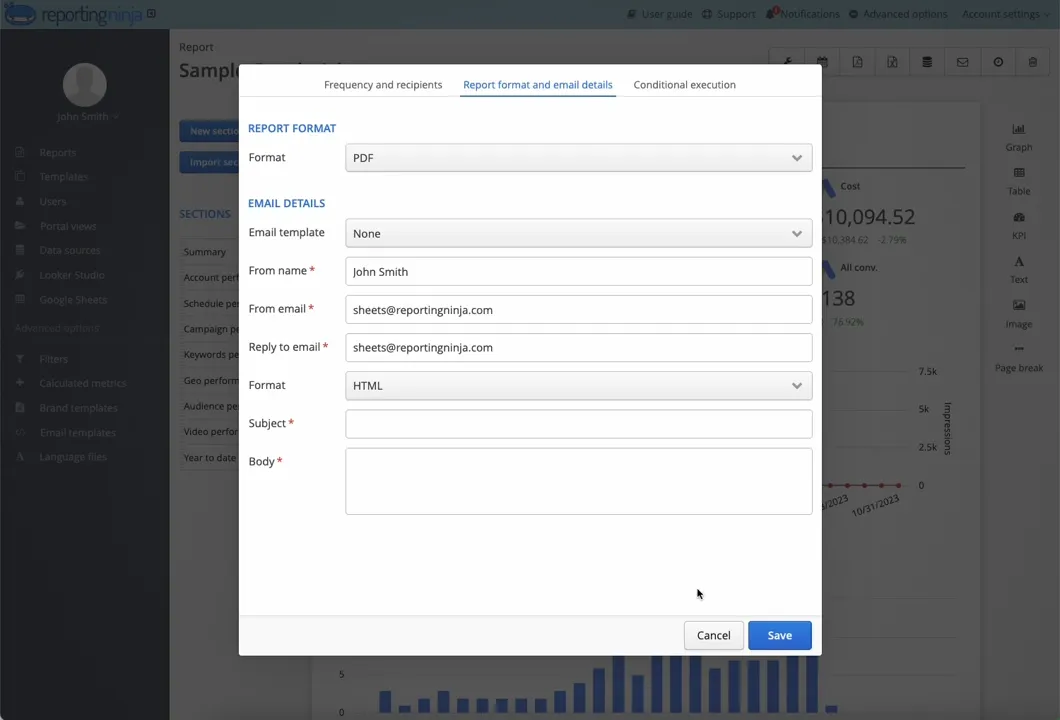
Reporting Ninja connects Looker Studio to common marketing platforms via pre-built integrations, so you can build live dashboards without exporting CSVs or manually updating Sheets. Plans are based on the number of connected accounts per platform type (Meta Ads, Microsoft Advertising, and so on).
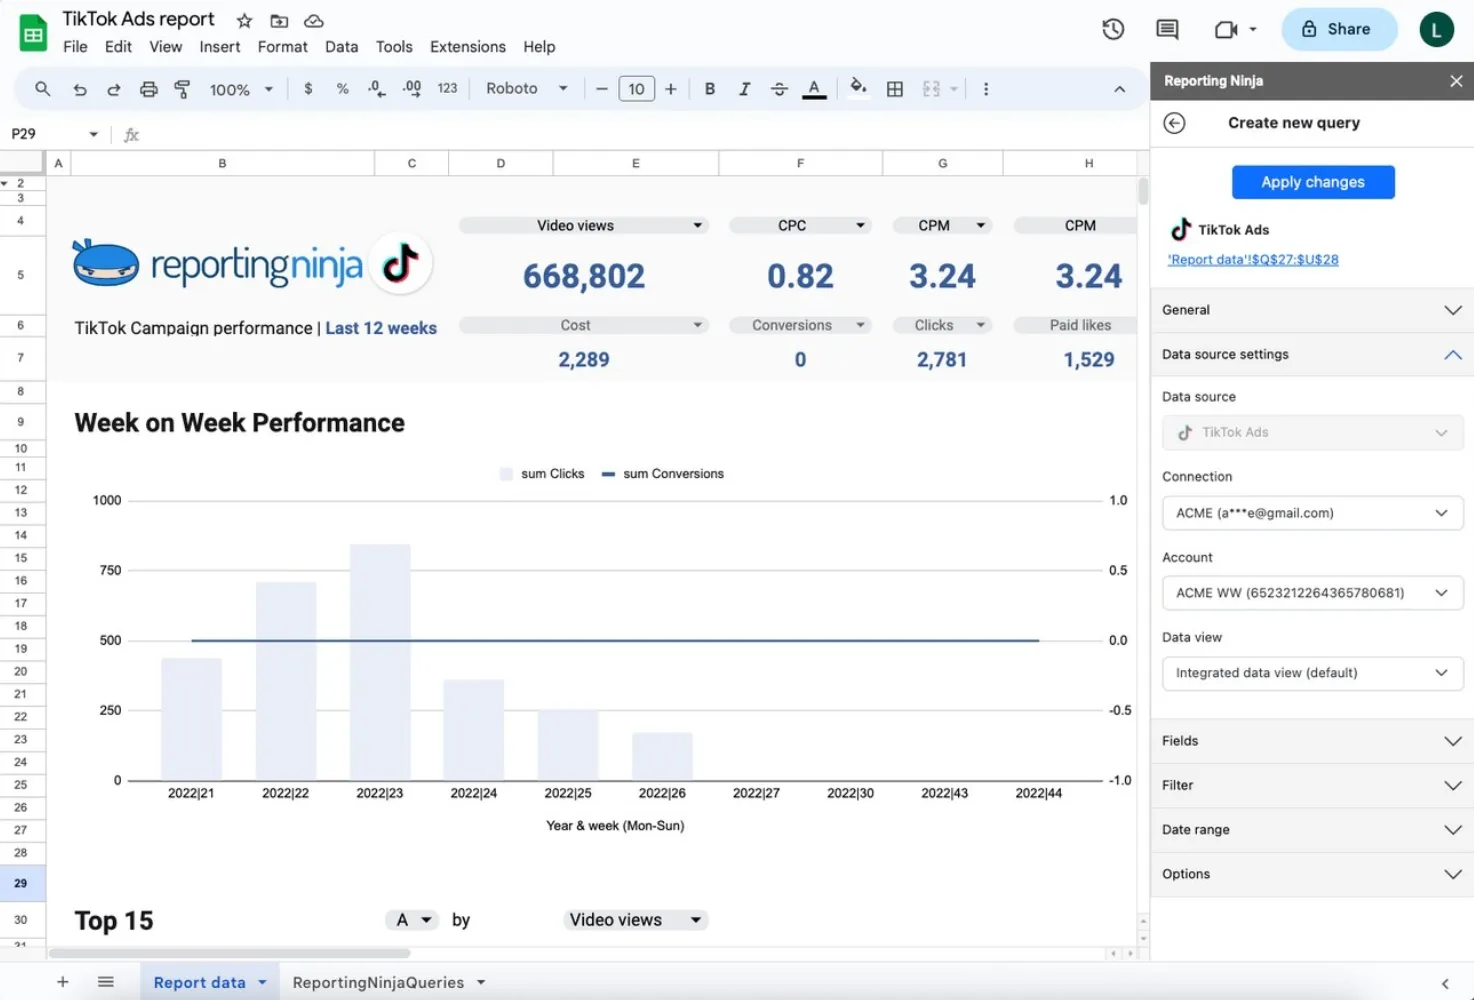
If your reporting workflow starts in Sheets, Reporting Ninja also supports pulling marketing data directly into Google Sheets for an analysis report with Looker Studio. This is useful when you want more control over calculations, blending, or building a “single source” sheet for multiple dashboards.

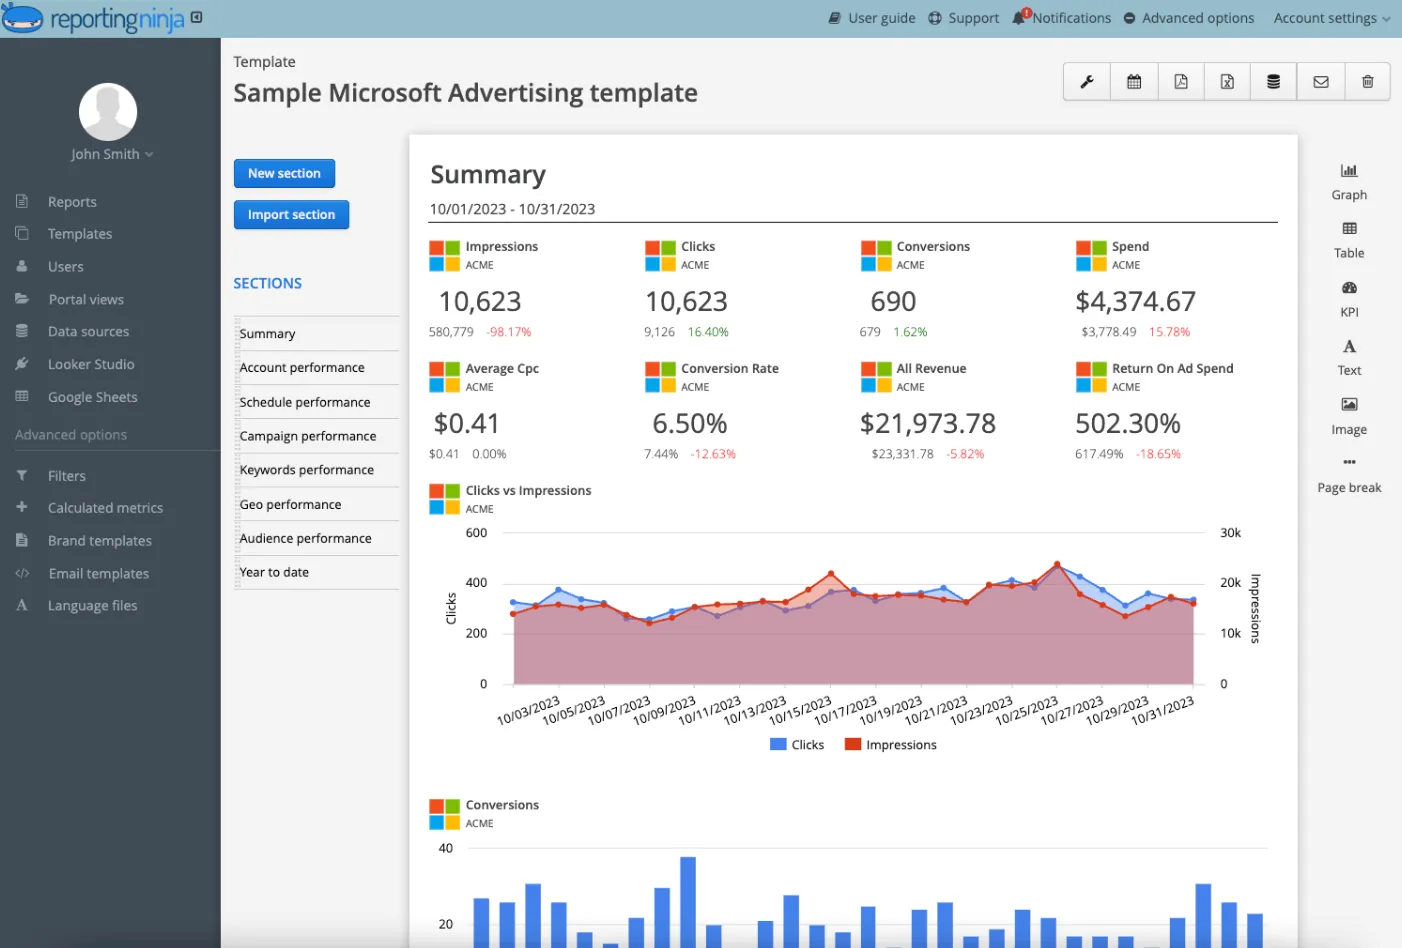
Instead of starting from a blank dashboard, you can use templates and pre-built widgets to assemble client-ready Looker Studio dashboards faster, which is especially useful for agencies that need consistent reporting formats across many accounts.
Reporting Ninja pricing starts at $20/month. Plans scale based on how many accounts of each platform type you need to connect.
“I had already worked with other tools, but the balance between automation, customization, and the visuals offered by Reporting Ninja meets all my needs. The ability to integrate data from various marketing channels and turn them into such well-crafted reports saves us a lot of time while enhancing our clients' experience.” - Stephanie Barbieri, Studio 33
If reporting feels repetitive or fragile, Reporting Ninja helps streamline the process. Connect your marketing platforms, keep data refreshed automatically, and reuse report templates across clients or teams. Start a free trial today to see if it fits your reporting workflow.
{{cta-block-v1}}
Power BI is one of the strongest Looker Studio alternatives if you need more control over your data model, tighter governance, and reporting that can scale across teams.
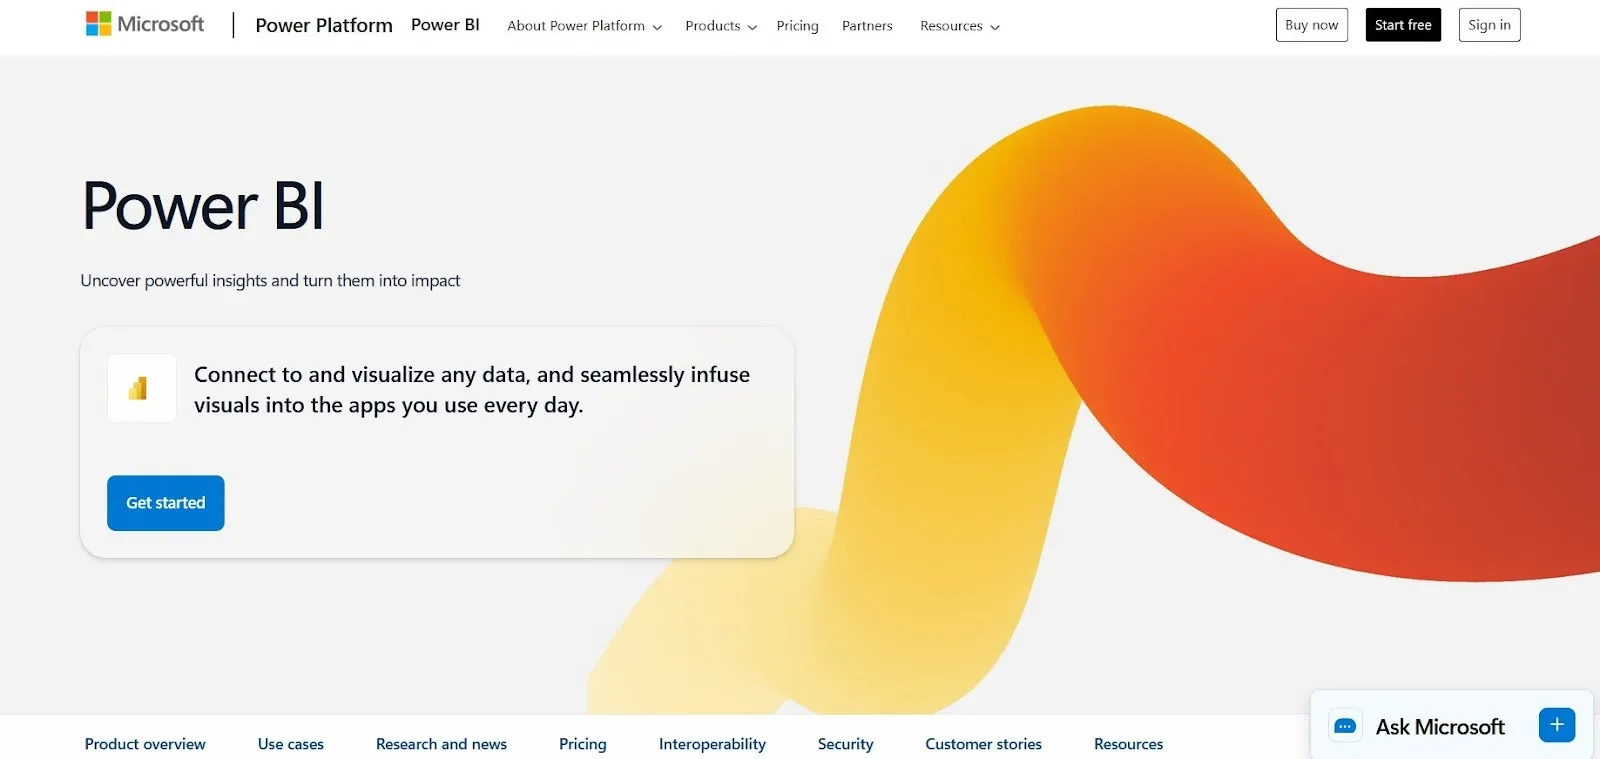
It’s built for organizations that want a single “source of truth” layer (semantic models) feeding many dashboards, rather than each report rebuilding logic from scratch. If you already use Microsoft 365, it’s also an easy fit operationally.
Power BI pricing is primarily per-user, with the most common tiers being Pro and Premium Per User (PPU).
“It has a lot of helpful features, the visuals are clean, and it connects smoothly with different data sources.” - Sourabh M., validated G2 reviewer.
“The main drawback of Power BI is the learning curve, particularly when working with DAX, data modelling, and relationships, which can be challenging for non-technical users.” - Tasneem M., validated G2 reviewer.
Tableau is a solid Looker Studio alternative when you need deeper visual exploration, more flexible dashboard interactivity, and stronger support for complex analytics workflows.
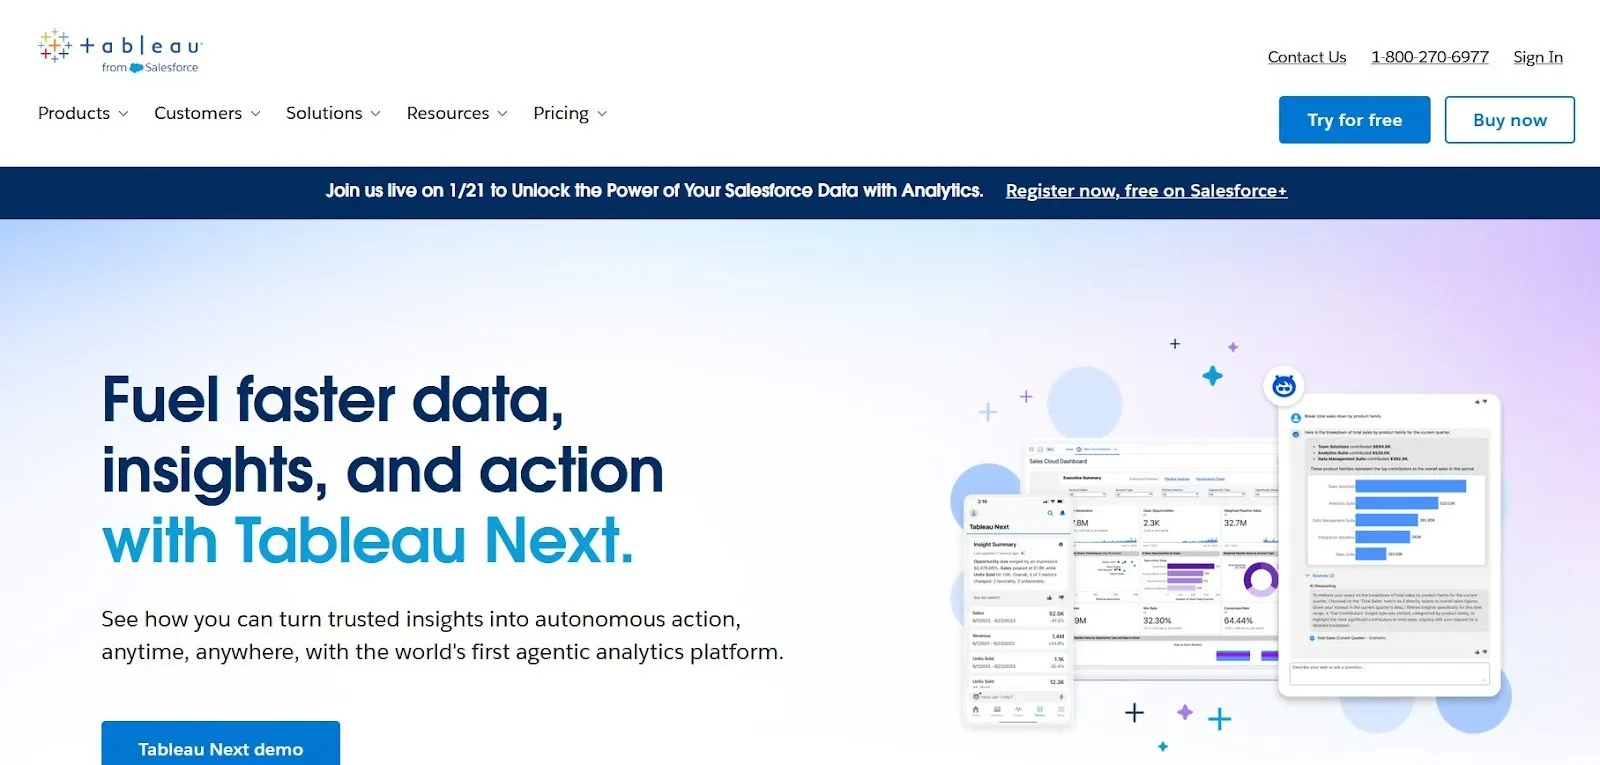
It’s widely used by data teams because it’s built for slicing and interrogating data, not just presenting it. If your reporting needs go beyond marketing dashboards and you want users to explore “why” something changed (not just what changed), Tableau could be a good fit.
Tableau pricing is typically per user, with multiple product tiers depending on how users create, edit, or only view dashboards.
“The ability to analyze data quickly and iteratively, with immediate feedback, makes using the product engaging, enjoyable, and easy to learn.” - Anirban G., validated G2 reviewer.
“Sometimes it feels a bit heavy, especially when working with large datasets. It can slow down or take time to load dashboards. Also, a few settings or formatting options are not very straightforward, so you need to dig around to fix small things.” - Toshim S., validated G2 reviewer.
Databox is a decent Looker Studio alternative if your main goal is fast, clean KPI dashboards without spending time on dashboard design or data modeling. It’s built for teams that want reporting to be simple: pick your sources, choose pre-built dashboards, and share results with stakeholders. This makes it a good fit for sales and marketing teams that need visibility into performance, but don’t need deep analytics. Pricing starts from $199/month.
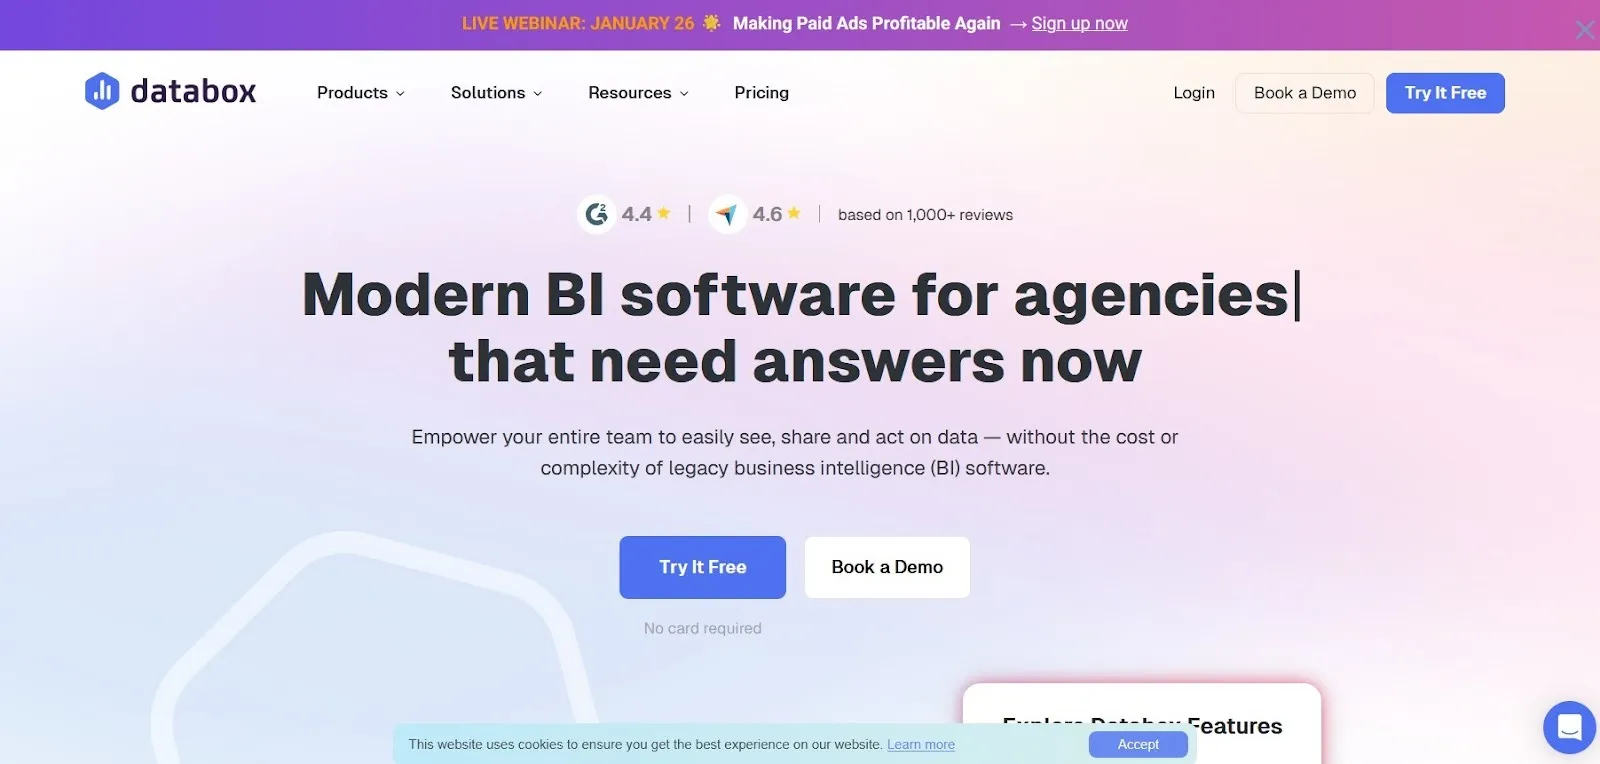
Databox also works well when you want dashboards to be consumed outside a BI tool, through scheduled emails, TV mode, or stakeholder-friendly views.
Zoho Analytics is a viable option if you want a more traditional BI-style tool at a more accessible price point, especially if your business already uses other Zoho products.
It supports a wide range of connectors, reporting formats, and dashboard types, and it’s designed to help SMBs move beyond basic charts into more structured analytics.
Side note: Need both Looker Studio and Google Sheets data connectors? See how Reporting Ninja manages both under a single plan.
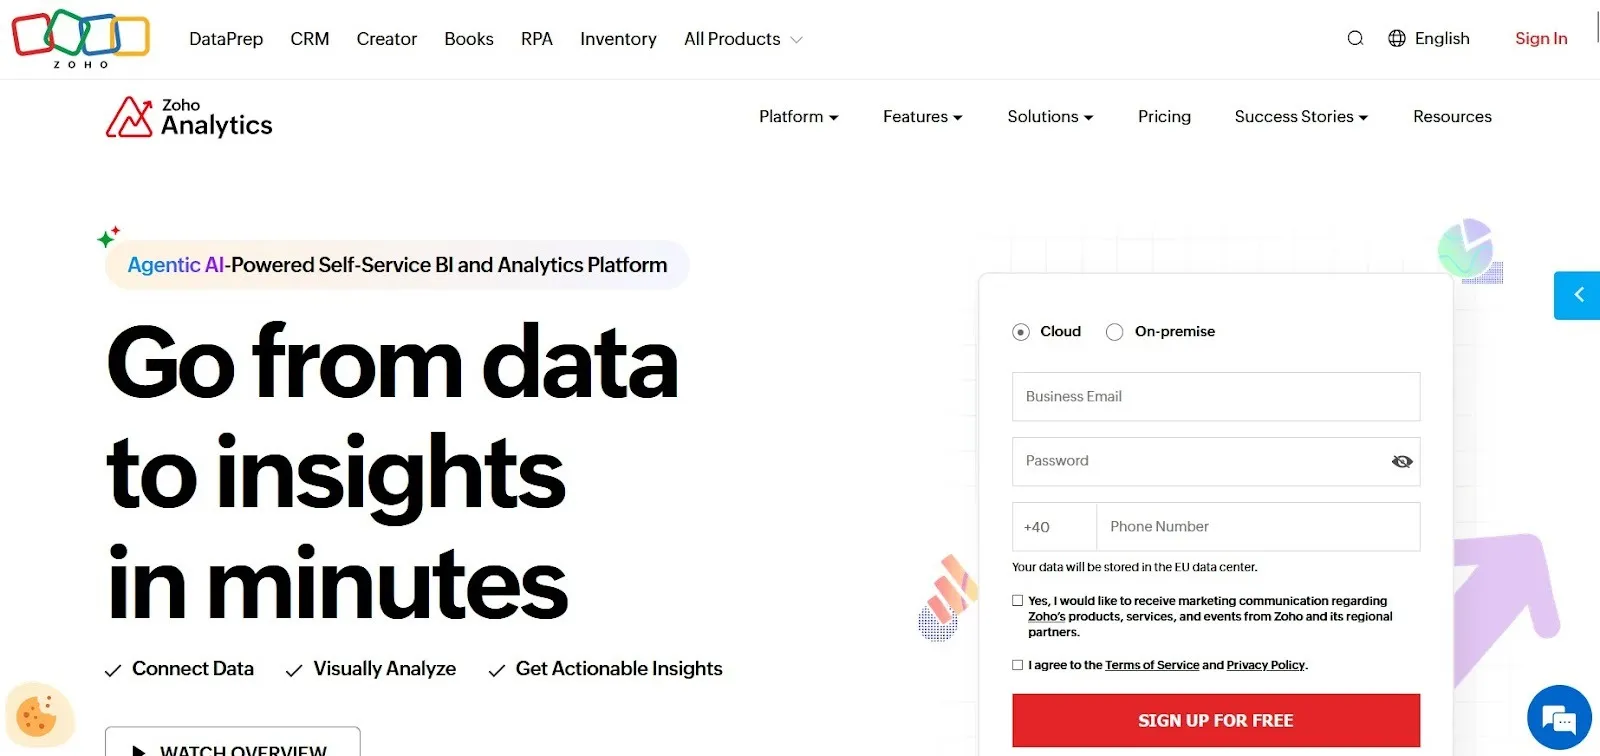
Compared to Looker Studio, Zoho Analytics can be a better fit when you need more control over data preparation, blending, and scheduled reporting within a single platform.
The main drawback is that it can take longer to set up well, and the interface won’t feel as familiar to teams that live inside Google Workspace. Pricing starts from €30/ month.
Looker Studio can be a solid free dashboarding tool, but many teams outgrow it once reporting becomes recurring, cross-platform, and client-facing. Here are the most common reasons teams switch.
As reporting grows, Looker Studio dashboards often require ongoing upkeep: fixing broken charts, reconnecting data sources, managing permissions, and troubleshooting blends and filters. Over time, reporting turns into “dashboard maintenance,” especially when multiple clients rely on similar templates.
If this sounds familiar, a reporting platform like Reporting Ninja can reduce that maintenance by centralizing delivery and refresh logic into a repeatable workflow.
Looker Studio works well for a small number of dashboards. It gets harder when you need 20–50 variations across different clients, accounts, and stakeholders. Duplication becomes the default scaling method, and every copy increases the chance of inconsistencies and manual fixes.
Reporting Ninja is a better fit when you want to scale recurring client reporting using standardized report structures rather than cloning dashboards.
Looker Studio can work for one dashboard. The problem starts when you need 20. And each with similar KPIs but different accounts and stakeholders. Without strong templates and repeatable workflows, teams end up duplicating dashboards and maintaining them manually.
Reporting Ninja supports reusable templates and structured reporting workflows that make recurring client reporting easier to standardize.
If these issues sound familiar, Reporting Ninja can help fix them. Automate data pulls, reduce connector issues, and standardize reports across clients or teams.
Try Reporting Ninja to see if it’s a better fit.
{{cta-block-v1}}
Reporting Ninja is built for the exact pain Looker Studio teams hit at scale: fragile connectors, manual prep, and duplicated dashboards. It turns recurring reporting into a stable, repeatable workflow that stays updated and scales across clients.
Start a free trial to see that workflow in action for you.
Sign up for a 15 days free trial. No credit card required.

Build and automate amazing custom reports in a few clicks. Save time, be more productive, impress your clients.