PPC
March 3, 2026
2026 Paid media reporting guide: what to track, report on & how


Paid media reporting in 2026 isn’t about exporting platform data; it’s about understanding what’s driving profit and where to scale.
This guide breaks down what to track, what stakeholders expect, and how to build reports that lead to clearer budget decisions across channels.
Global ad spend continues to grow, with investment expected to exceed $1 trillion in 2026. Yet many teams still rely on platform exports from Google Ads, Meta, or LinkedIn as their “report.” That’s the gap - these raw platform exports rarely provide meaningful marketing reports.
Platform dashboards show channel-level performance. They don’t show blended CAC, cross-channel ROAS, or how paid media impacts pipeline and revenue. Without a unified view and paid search analytics, decisions are often made in silos.
This lack of clarity affects retention. Around 40% of agency clients cite poor communication and unclear reporting as the main reason for leaving.
Strategic reporting connects spend to business outcomes. It shows what’s working, what isn’t, and where budget should move next.
Different stakeholders don’t want more data. They want clarity on performance, risk, and growth opportunities.
Here’s how expectations shift by role:
Clients want answers, not dashboards. Your report should show:
When reporting is structured this way, conversations shift from explaining numbers to making decisions about growth and budget allocation.
Marketing leaders care about efficiency and forecasting. They expect:
This gives leadership a clear view of how paid media impacts revenue, not just channel performance.
Founders look at paid media through one lens: profitability.
They want to know:
Reports that focus on these metrics directly influence hiring, investment, and growth decisions.
Paid media reporting only works when it aligns with the decisions each stakeholder needs to make. Whether it’s a client, a marketing leader, or a founder, the goal is the same: connect spend to outcomes and make the next move clear.
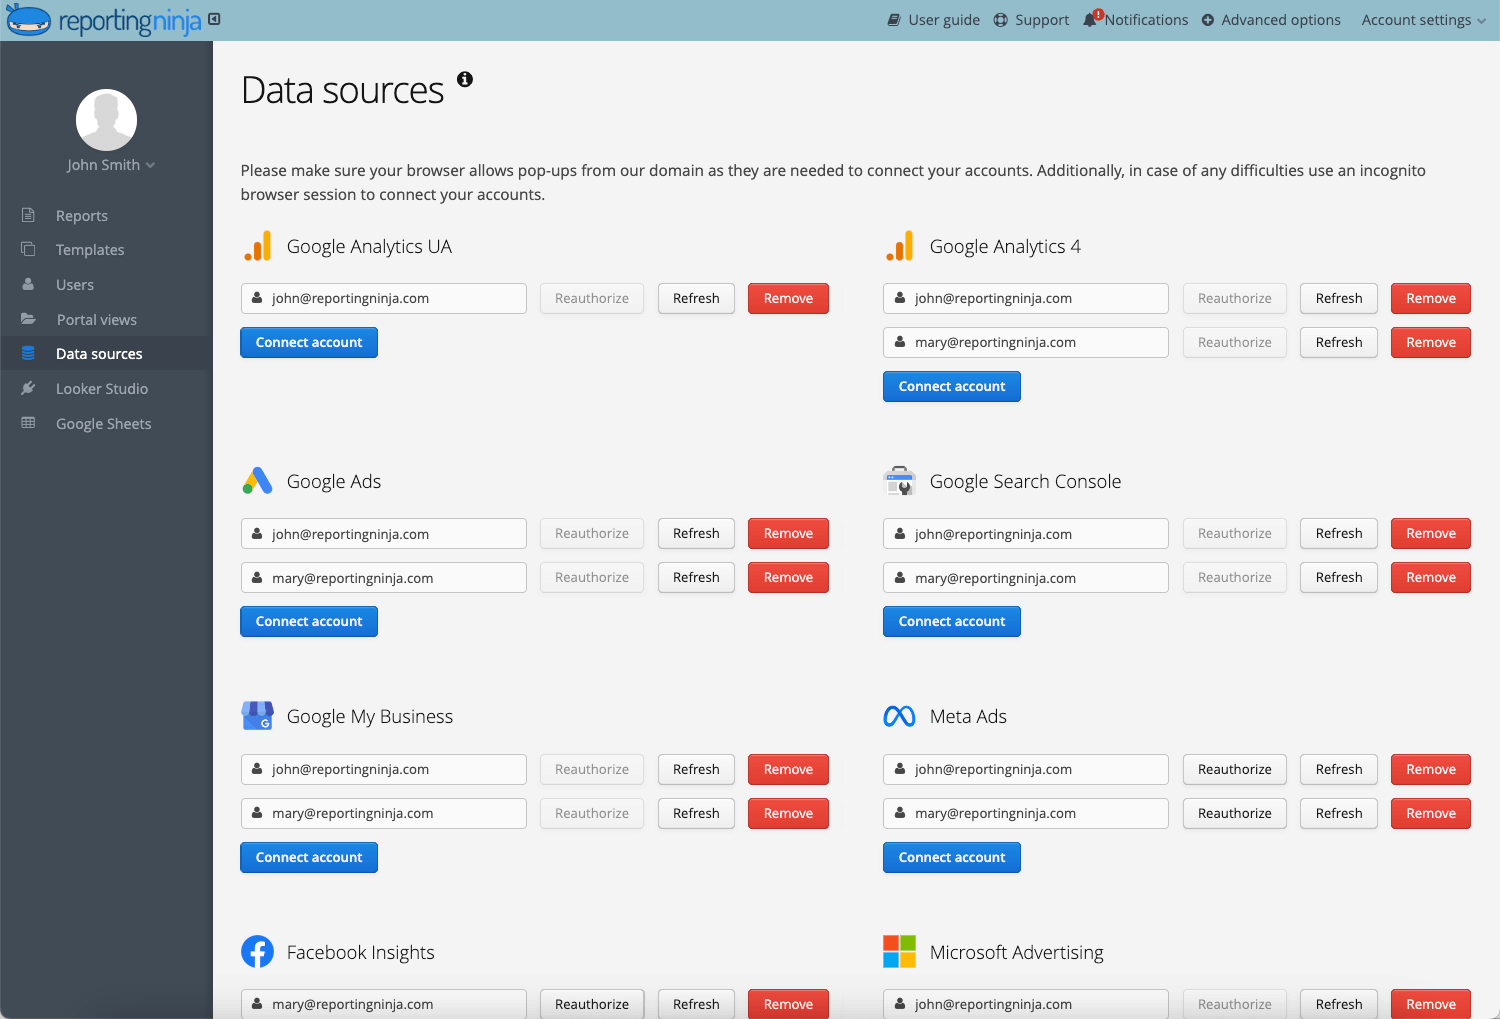
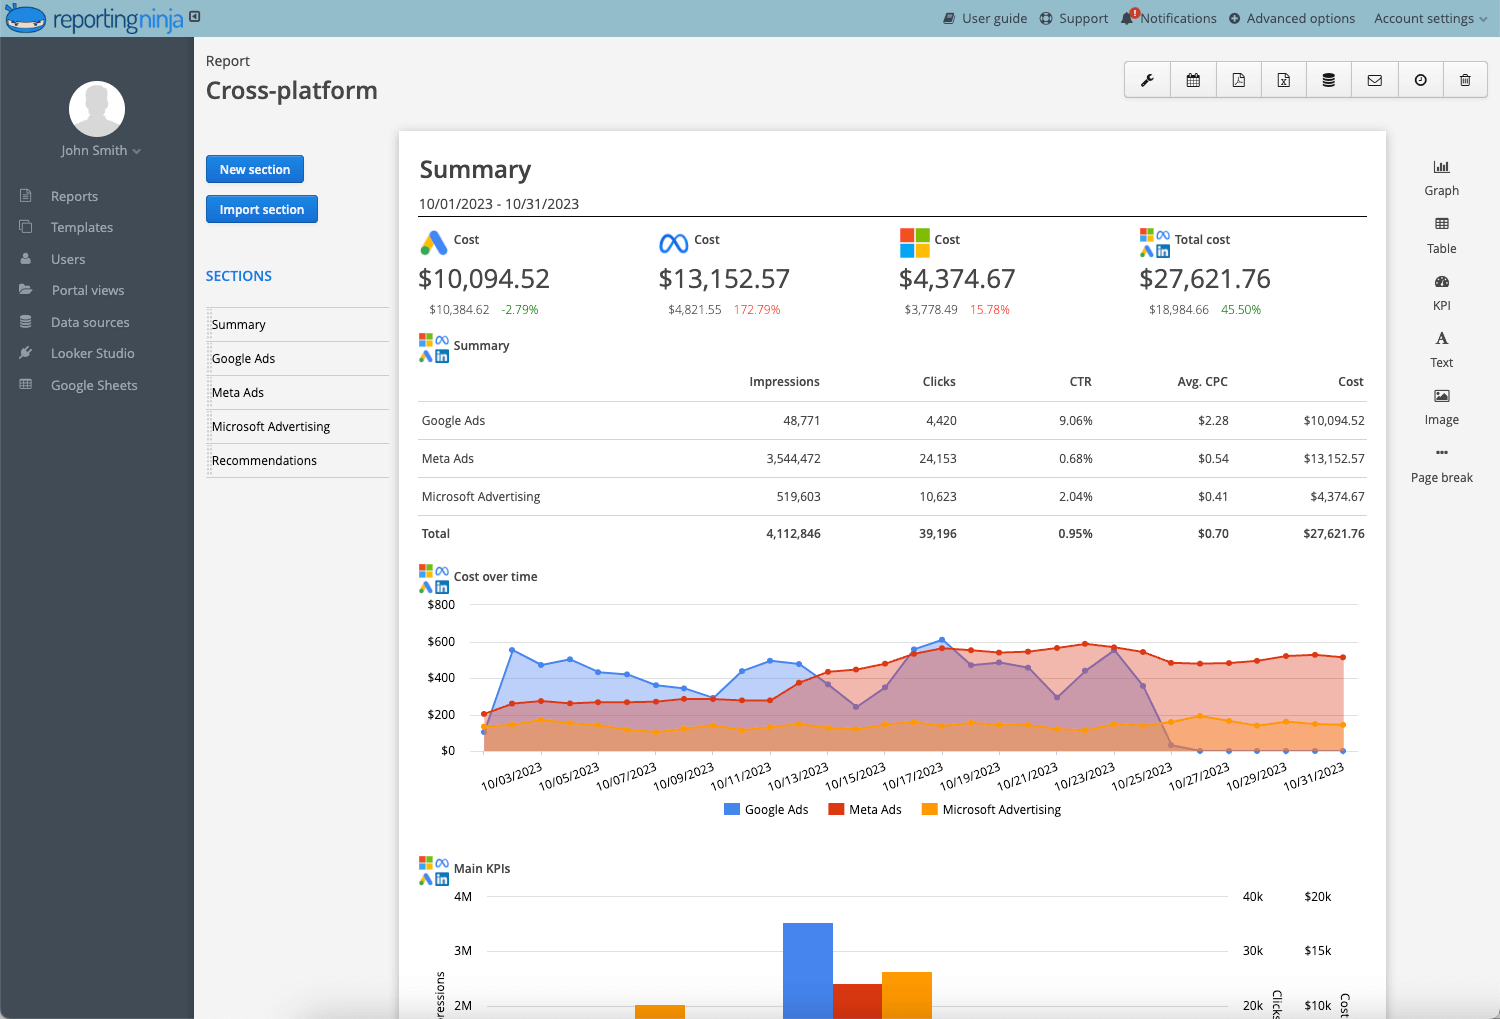
Your report should unify performance across Google Ads, Meta Ads, LinkedIn Ads, TikTok, and any other paid channel into one view.
Isolated channel metrics create blind spots. Cross-platform reporting exposes true efficiency.
Focus on metrics that connect spend to business outcomes:
When these metrics are combined, it becomes clear which channels generate revenue and which are just increasing spend.
Not every report serves the same purpose. The structure should match the decision being made.
Common paid media report types include:
The mistake many teams make is sending the same report to everyone. Format should align with the stakeholder and the decision at hand.
{{cta-block-v1}}
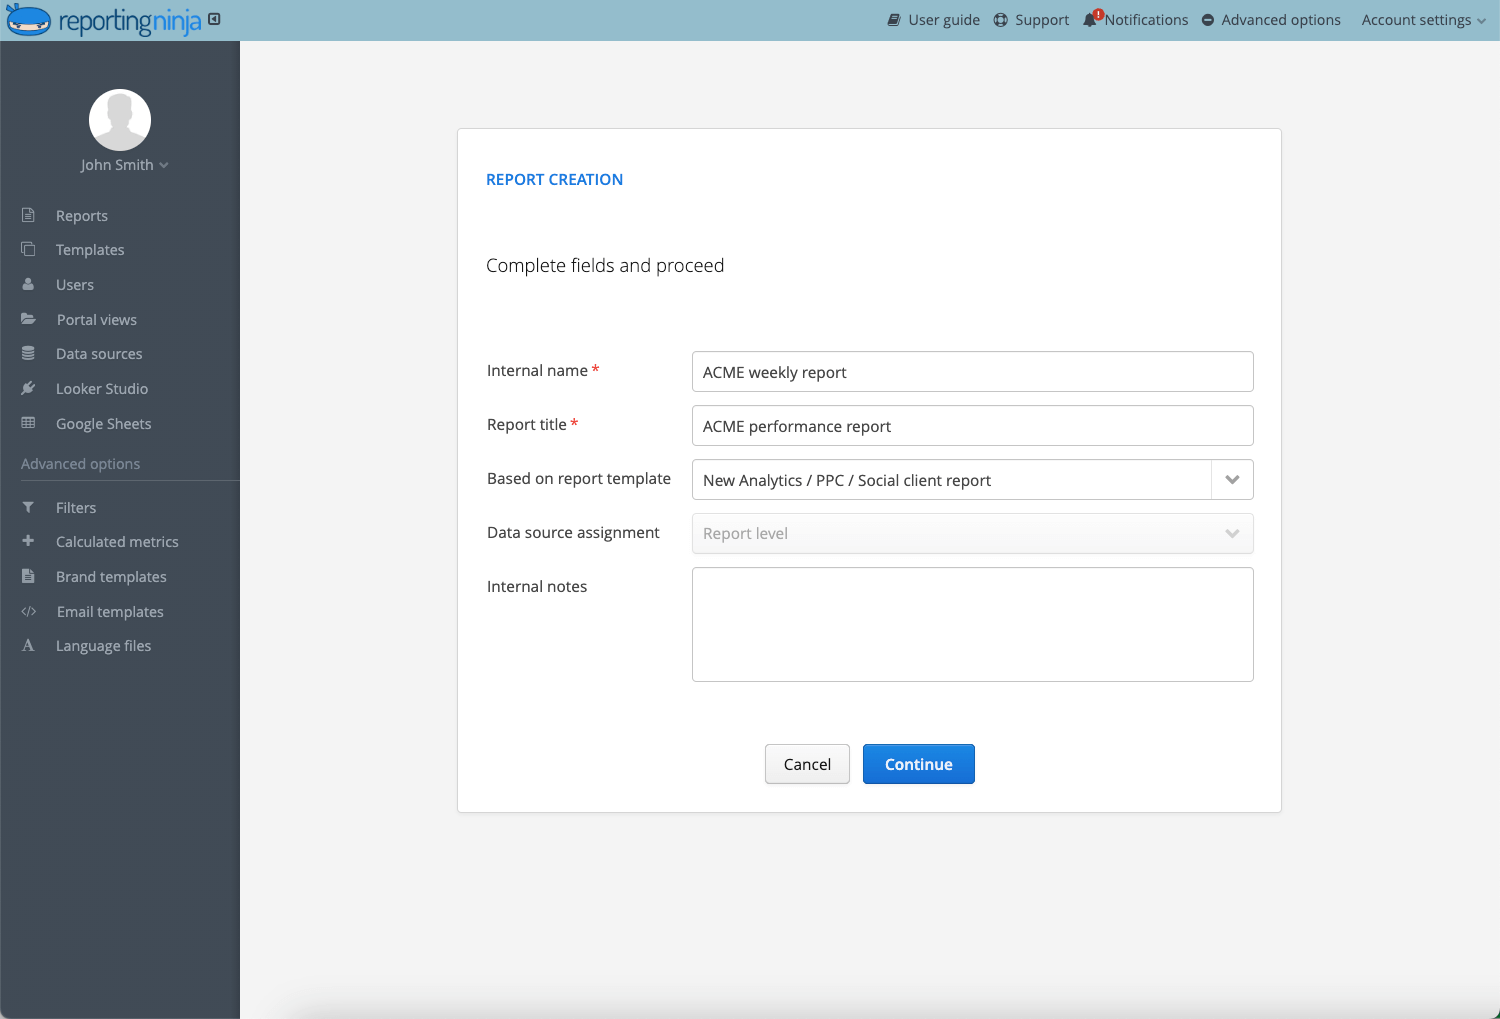
Here’s a practical way to build a cross-channel paid media report in minutes using Reporting Ninja.
Start by connecting all relevant platforms:
This pulls performance data into one environment instead of relying on separate exports.
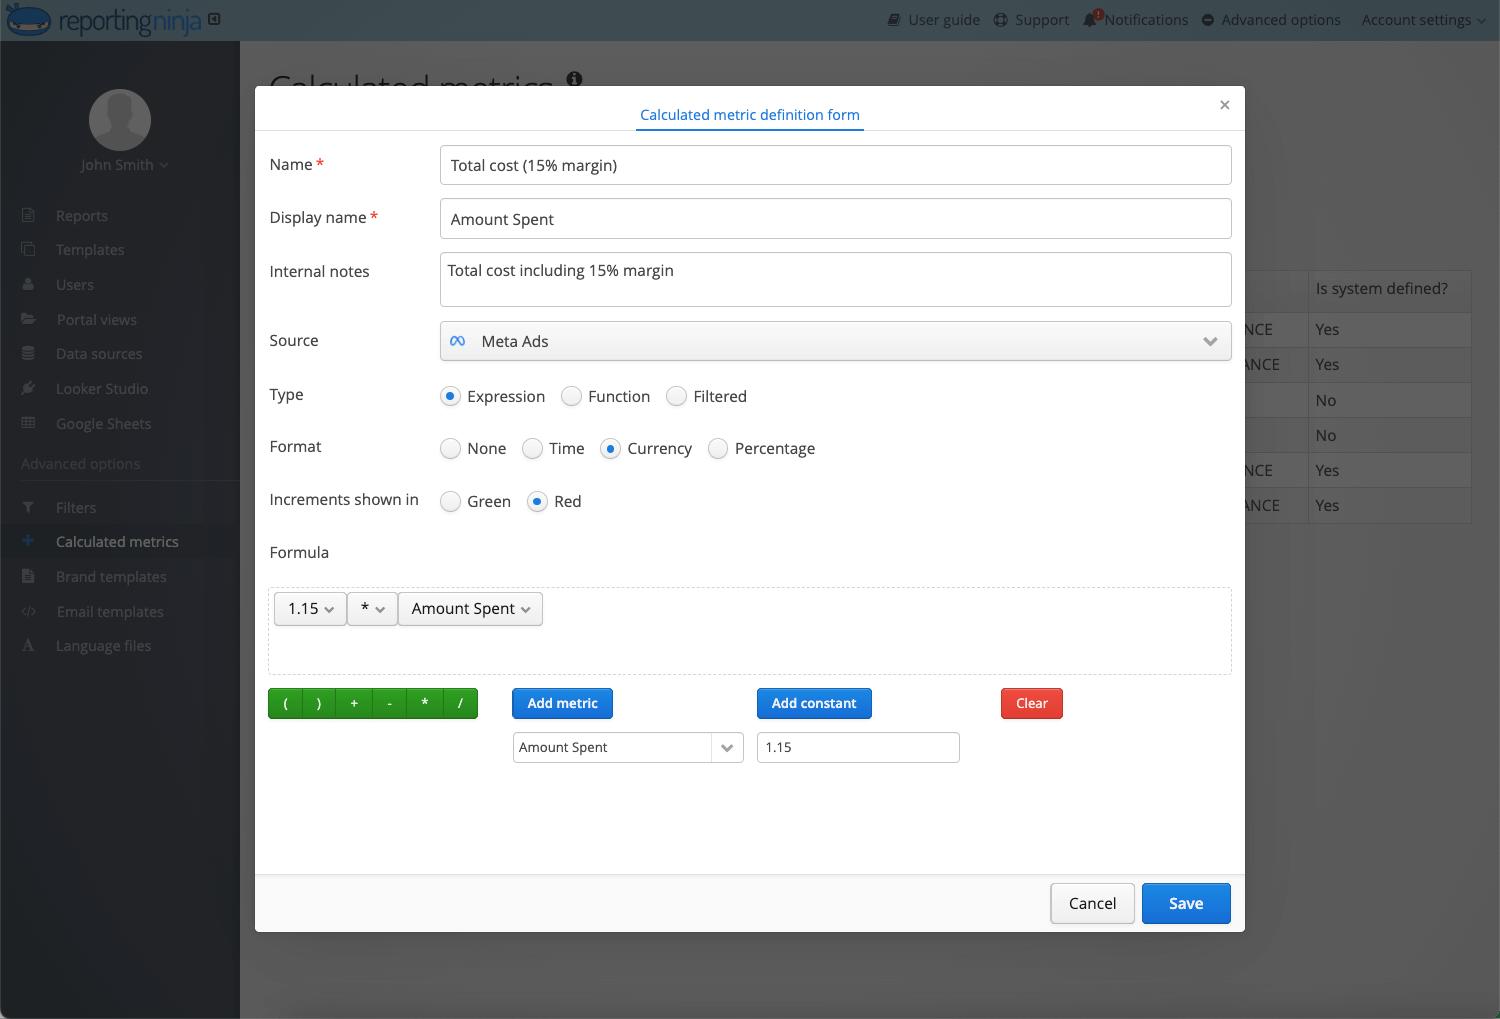
Choose a paid media reporting template designed for:
Templates give you structure immediately, so you don’t build reports from scratch.
Adjust the report to match decision-makers:
This ensures your report answers business questions, not just performance summaries.
Schedule reports to send automatically:
This removes repetitive spreadsheet exports and reduces reporting errors.
Start building clearer paid media reports today. Create your first cross-channel dashboard in Reporting Ninja and see all your ad performance in one place.
{{cta-block-v1}}
Seeing structure in action makes reporting clearer. Below are three paid media report examples built around real decision-making scenarios.
A SaaS company spending $120,000/month across Google, Meta, and LinkedIn consolidates all channels into one executive report.
The report includes:
At 3.4x ROAS, performance exceeds the typical B2B SaaS benchmark of 1.7x–2.3%.
Leadership reviews one profitability view instead of multiple dashboards, making budget allocation decisions faster and more consistent.
An agency managing five paid channels for an e-commerce brand delivers a monthly client report focused on:
Clear reporting improves client understanding and shifts conversations toward scaling decisions. Transparency also supports retention, with 70% of agency leaders citing it as a key factor.
A founder reviewing $40,000/month in paid spend receives a simplified performance report:
A 2.3-month payback period outperforms the typical SaaS benchmark of 4–6 months.
The report focuses only on profitability and cash flow, helping guide hiring and growth decisions.
Even experienced teams fall into reporting habits that reduce clarity and weaken decision-making.
If your reporting still relies on exports and manual spreadsheets, it’s time to simplify the process.
With Reporting Ninja, you can:
Instead of stitching together dashboards, you get one report that shows exactly where your budget is working.
Paid media refers to advertising where you pay to promote your content or offers, such as Google Ads, Meta Ads, LinkedIn Ads, and other sponsored placements
A paid media report should include blended ROAS, CAC, cost per qualified lead, channel performance, budget allocation, and revenue or pipeline contribution.
It depends. Weekly reports support tactical optimizations, while monthly reports are better suited for executive and strategic reviews
Yes. Platform data is useful, but it should sit within a cross-channel view that shows overall profitability and efficiency.
Focusing on vanity metrics. If your report doesn’t connect spend to revenue or profit, it won’t guide meaningful decisions.
Sign up for a 15 days free trial. No credit card required.

Build and automate amazing custom reports in a few clicks. Save time, be more productive, impress your clients.