How to create Facebook automated reports in minutes (with examples)
Luis Pereira
Founder & CEO at Reporting Ninja
Key takeaways
Facebook automated reports automatically pull campaign data from Ads Manager and generate scheduled dashboards without manual exports.
Automation eliminates repetitive reporting tasks and reduces human errors caused by manual spreadsheets.
Effective Facebook reports focus on core KPIs such as ROAS, CPA, CTR, and conversions instead of overwhelming dashboards with unnecessary metrics.
Multi-channel reporting tools like Reporting Ninja allow agencies to automate reporting, schedule delivery, and standardize client reports at scale.
Still exporting Facebook Ads data every week?
Facebook automated reports remove manual work by pulling performance data into dashboards and sending scheduled updates automatically.
In this guide, you’ll learn how to set up automated Facebook reporting, which tools are worth using, and how to build reports clients actually read.
Why manual Facebook reporting becomes a bottleneck at scale?
Manual Facebook reporting works when you manage one or two accounts. At scale, it breaks down quickly, making auditing Facebook ads for errors or inconsistencies even more difficult and time-consuming.
Time compounds across accounts: Exporting data, formatting spreadsheets, and building slides, including tracking all Facebook ads metrics, can take 20–30 minutes per client. Reporting alone can account for up to 32% of a marketer’s time, making it one of the most time-intensive tasks.
Human errors increase: Manual exports often lead to wrong date ranges, missing metrics, or broken formulas.
Reporting standards become inconsistent: Different team members structure reports differently, making performance harder to compare.
Scaling becomes linear: Every new client increases reporting workload instead of improving efficiency.
At this point, reporting stops being a task and starts limiting how much you can grow.
Main benefits of automated Facebook reports
Automated Facebook reports replace manual work with a system that runs on its own. Using the right Facebook reporting software ensures these benefits show up immediately.
Reduce manual work and save hours weekly Automated syncing pulls data directly from Facebook Ads. No more exports, copy-pasting, or rebuilding the same dashboards every month.
Improve client retention through consistency Scheduled reports arrive on time, every time. Clean layouts and standardized KPIs build trust and reduce “Where’s the report?” emails.
Scale without adding headcount Whether you manage 5 accounts or 50, automation removes the linear workload problem. Adding a new client doesn’t mean adding another reporting day.
Minimize reporting errors Live data connections reduce incorrect date ranges, missing metrics, or broken spreadsheet formulas.
Centralize multi-channel performance Instead of isolating Facebook data, you can combine it with Google Ads, LinkedIn, TikTok, and more in one automated report.
Reporting Ninja supports scheduled, white-label reports across multiple channels, helping agencies standardize reporting across their entire client base.
Agency operators often highlight reporting automation as a major time saver. In a Reddit r/PPC discussion, one marketer noted that once a dashboard template is built, “90% of reporting should be done in minutes” because it can be duplicated across multiple client accounts.
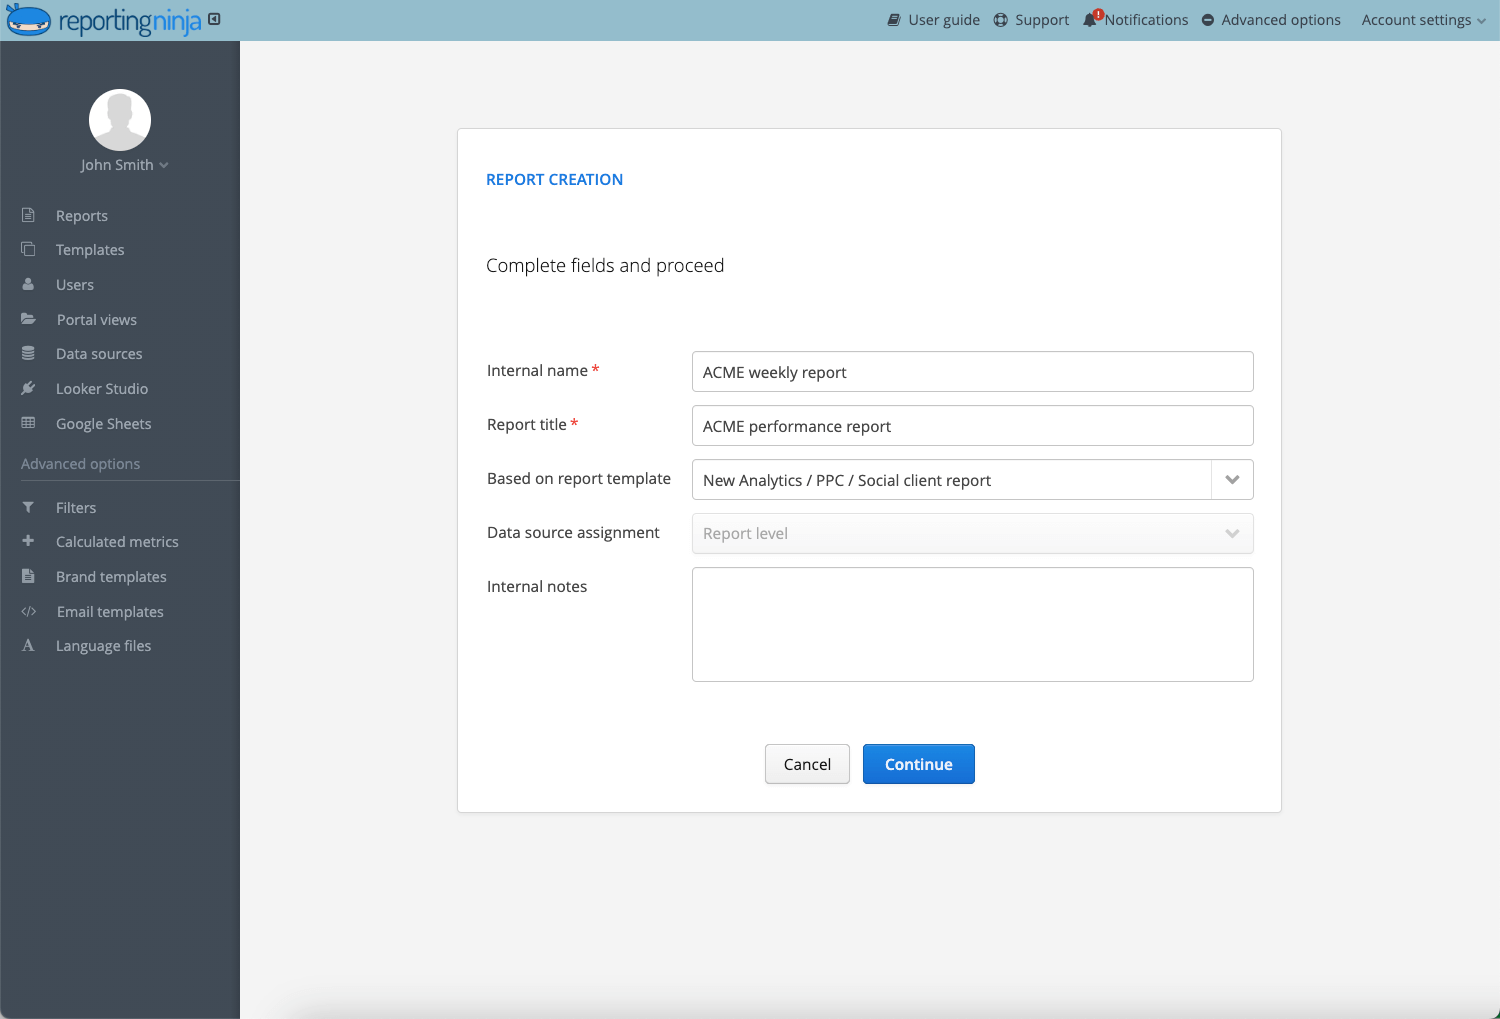
How to create Facebook automated reports (step-by-step)
Creating Facebook automated reports takes four core steps: connect your data source, choose your KPIs, design your layout, and schedule delivery.
Here’s how the workflow looks inside Reporting Ninja.
Step
Action
Result
1
Connect Facebook Ads account
Data sync begins automatically
2
Select KPIs and date ranges
Focused performance metrics
3
Customize dashboard layout
Client-ready report structure
4
Schedule delivery
Automated weekly or monthly reports
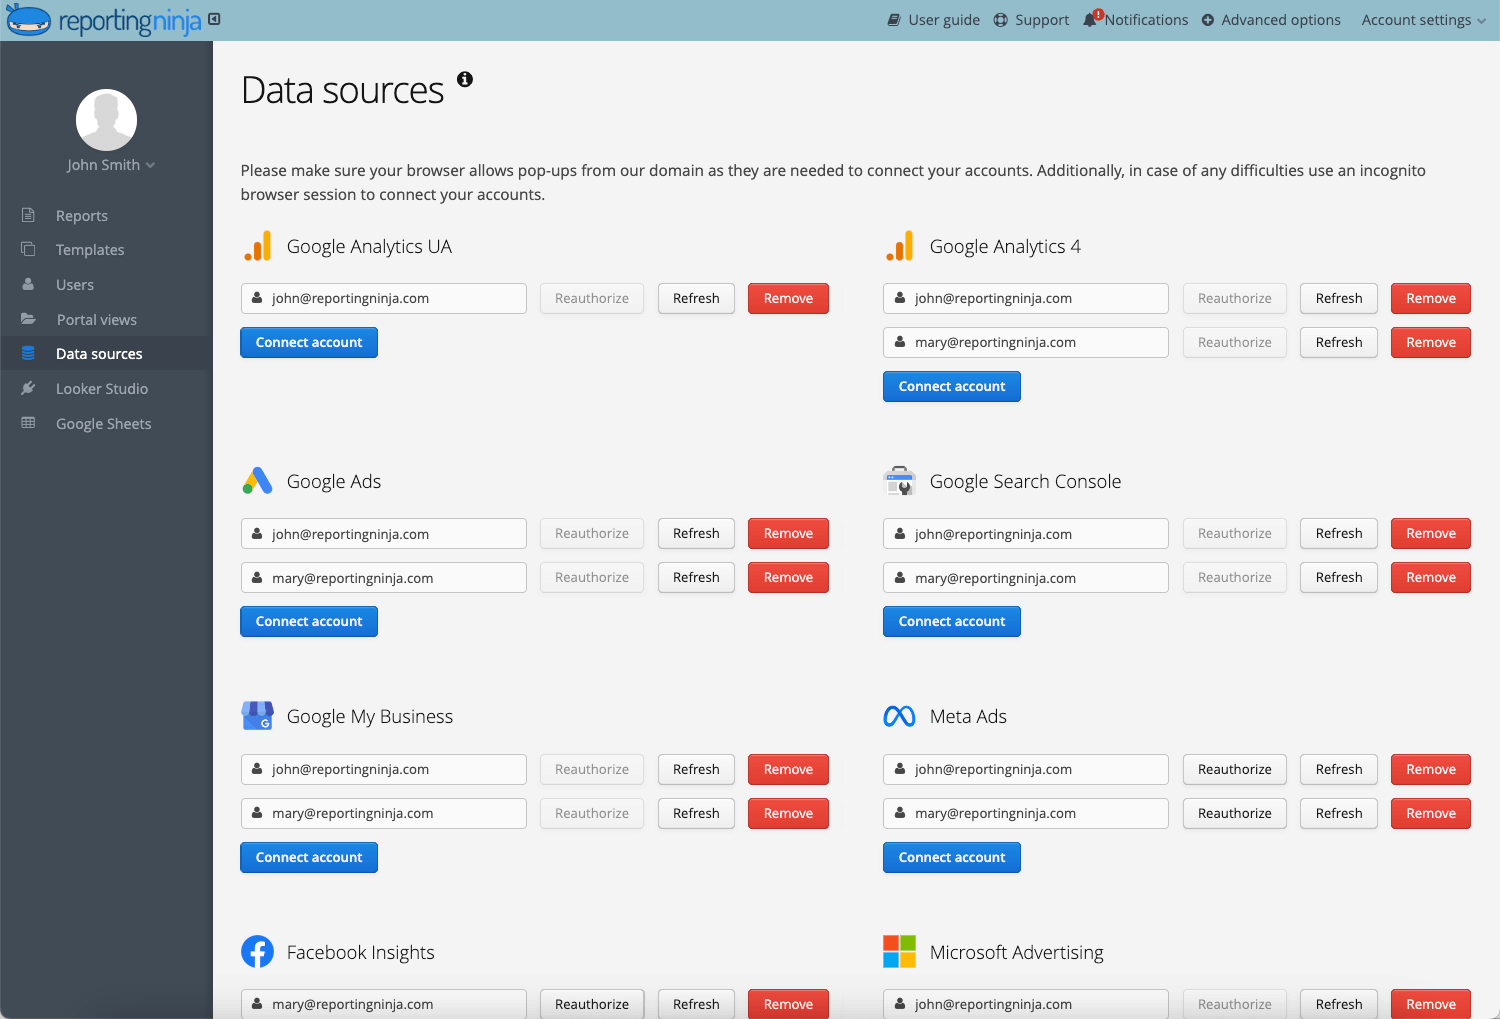
Step #1: Connect your Facebook Ads account
Start by connecting your Facebook Ads account to Reporting Ninja.
Select Facebook Ads as your data source
Authenticate via Meta
Choose the ad accounts you want to report on
Once connected, data syncs automatically. No manual exports. No CSV uploads.
Pro Tip: Connect all active ad accounts upfront. This lets you standardize report templates and avoid repeating setup for each new client or campaign.
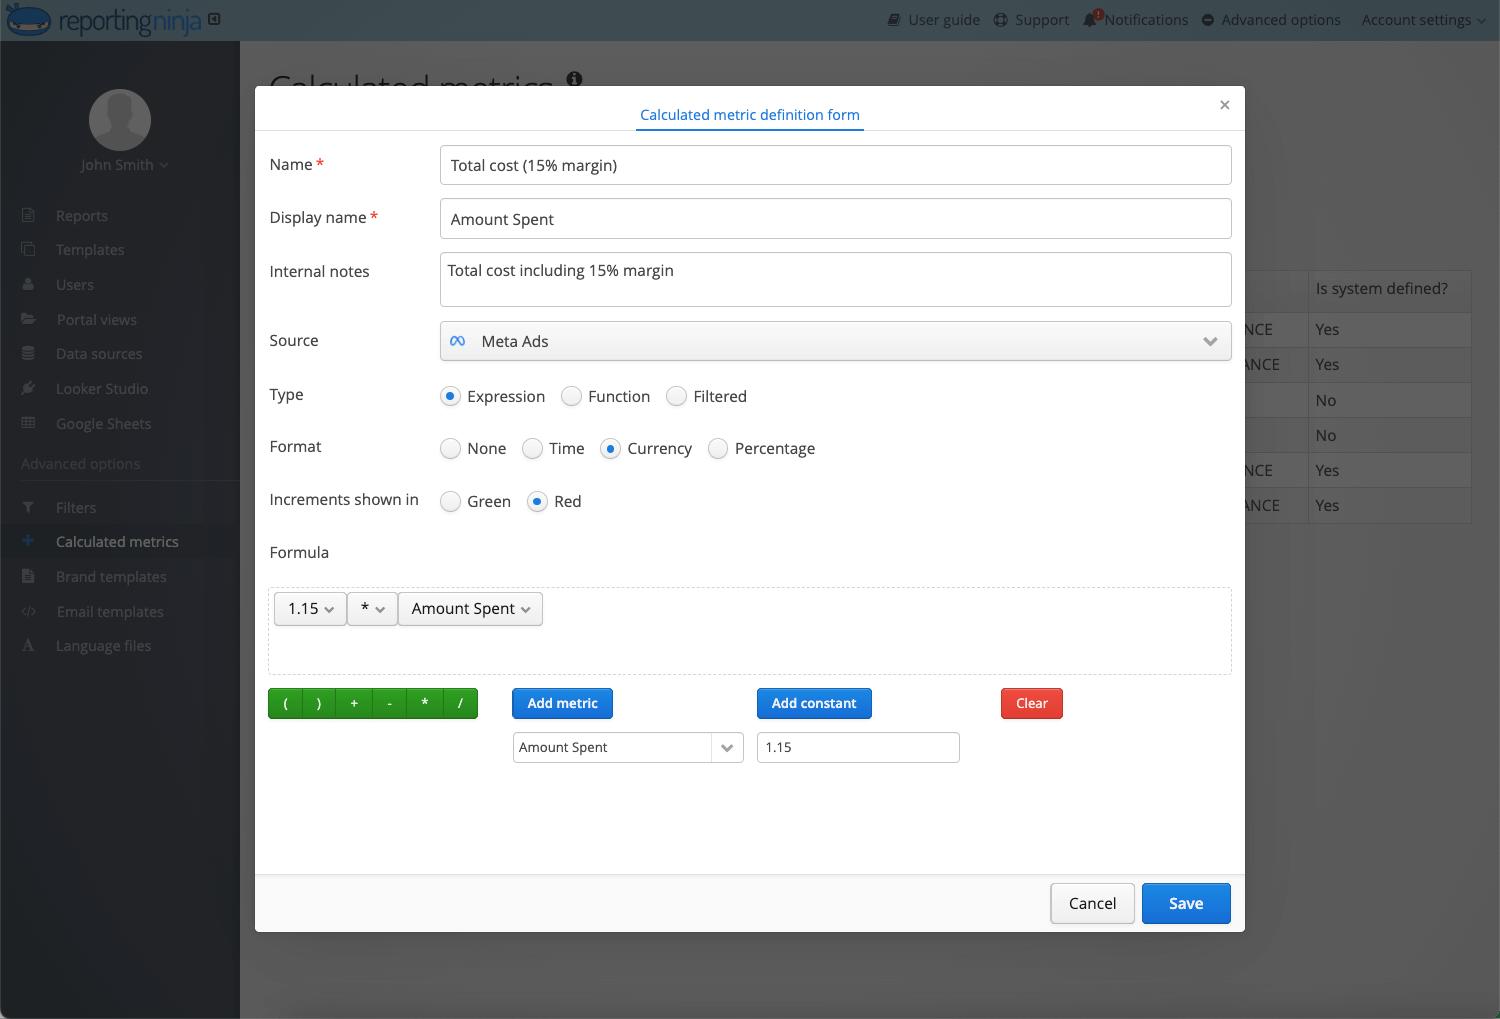
Step #2: Select your KPIs and date range
Next, define what actually matters.
Choose metrics aligned with campaign goals, such as those you track across your Facebook ads strategies:
ROAS
Cost per acquisition (CPA)
Click-through rate (CTR)
Conversions
Spend
Avoid metric overload. A clean social media report focused on 6–10 KPIs is easier to interpret than a dashboard with 40 numbers.
Step #3: Customize your report layout
Now structure the report for clarity.
Add performance summaries at the top
Break down results by campaign, ad set, or creative
Include trend charts for month-over-month comparisons
White-label options allow you to add your agency logo, brand colors, and custom domain for client delivery.
Pro Tip: Create a reusable reporting template before adding clients. This allows you to duplicate reports instantly instead of building new dashboards each time.
Automation saves time — but only if it’s set up correctly. These common mistakes can make your reports harder to use, not easier.
Automating raw data without context Sending numbers without interpretation forces clients to do the analysis themselves. Always include a short performance summary at the top of the report.
Tracking too many metrics More data doesn’t mean better reporting. Focus on KPIs tied to revenue, cost efficiency, and campaign objectives.
Using inconsistent date ranges Comparing last 7 days to last 30 days creates misleading trends. Standardize your reporting periods.
Ignoring delivery settings Reports sent at random times feel unstructured. Set fixed schedules so stakeholders expect them.
Failing to align KPIs with goals Awareness campaigns shouldn’t be judged on ROAS. Lead gen campaigns shouldn’t focus on impressions.
Pro Tip: Highlight 2–3 insights in plain language before showing charts. Decision-makers scan summaries first.
Software to automate Facebook performance reporting
Reporting Ninja is built specifically for automated marketing reporting. You can connect Facebook Ads, combine it with other platforms, and schedule fully white-labeled reports in minutes.
Key strengths include:
Multi-channel reporting in one dashboard
Automated scheduling and email delivery
White-label branding for agencies
Template duplication for scaling clients
Stop exporting data manually and automate your Facebook reporting workflow. Start your free trial of Reporting Ninja.
Tool 2: Supermetrics
Supermetrics focuses on data extraction rather than report presentation. It connects Facebook Ads to tools like Google Sheets or Looker Studio.
It’s best for teams that want raw data flexibility and already use BI platforms. However, you’ll still need to build and maintain your dashboards separately.
Tool 3: Whatagraph
Whatagraph emphasizes visual marketing dashboards with automated delivery.
It’s suited for agencies that prioritize presentation design. Whatagraph’s pricing starts significantly higher than many alternatives, which may limit accessibility for smaller teams.
{{cta-block-v1}}
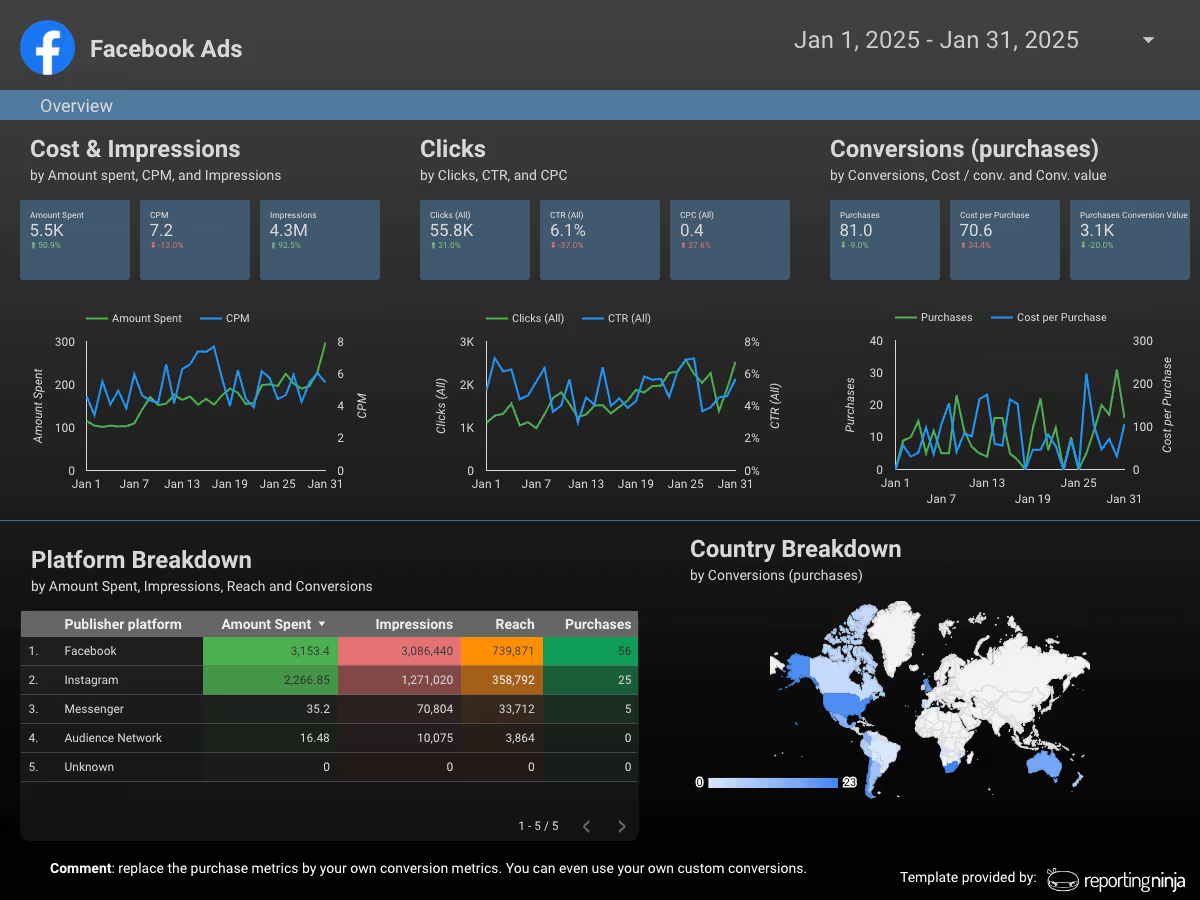
Examples of Facebook automated reports
Below are practical examples of what automated Facebook reports should look like — including before vs after improvements.
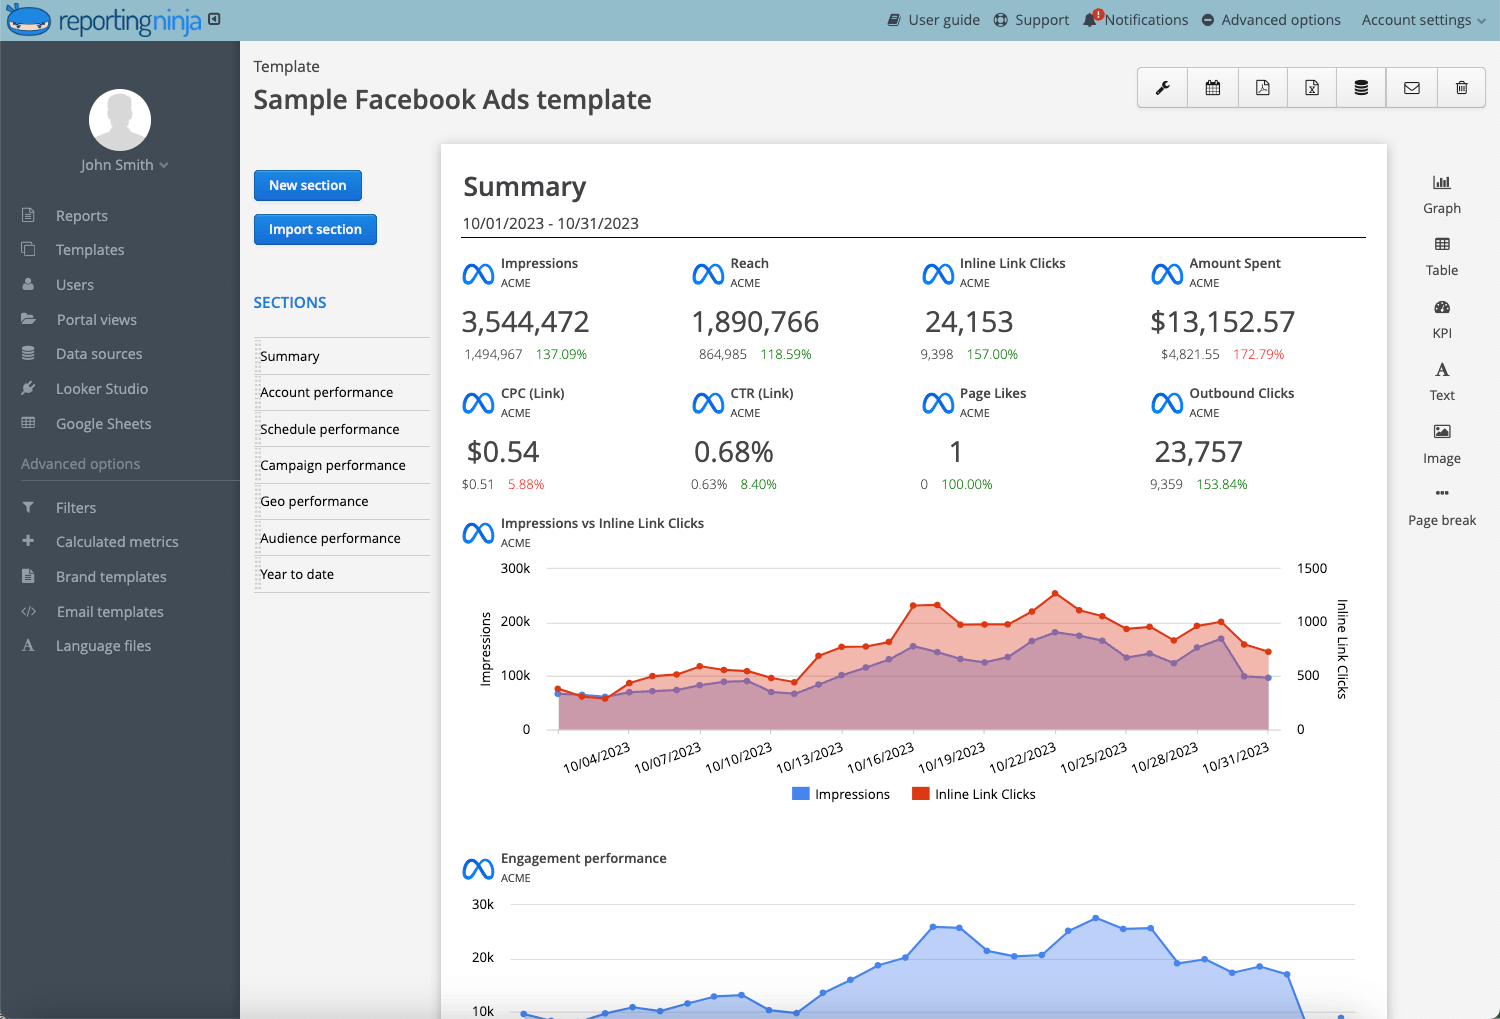
#1: Monthly performance overview (before vs after)
Before: A raw export from Facebook Ads Manager with 30+ columns, inconsistent formatting, and no summary.
After: A structured report showing:
Total spend
Revenue and ROAS
CPA trend
Conversion volume
Month-over-month comparison
At the top, a short summary explains what changed and why. This gives stakeholders context before they review the charts.
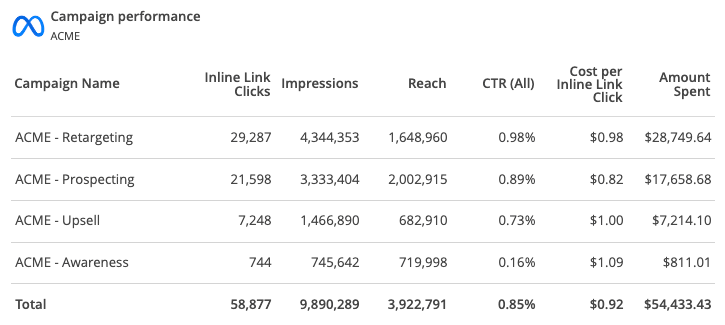
#2: Campaign breakdown report
Before: Screenshots pasted into slides with manual annotations.
After: An automated breakdown by:
Campaign objective
Ad set performance
Top-performing creatives
Budget allocation
Trend charts show which campaigns improved and which declined. This makes budget decisions easier and faster.
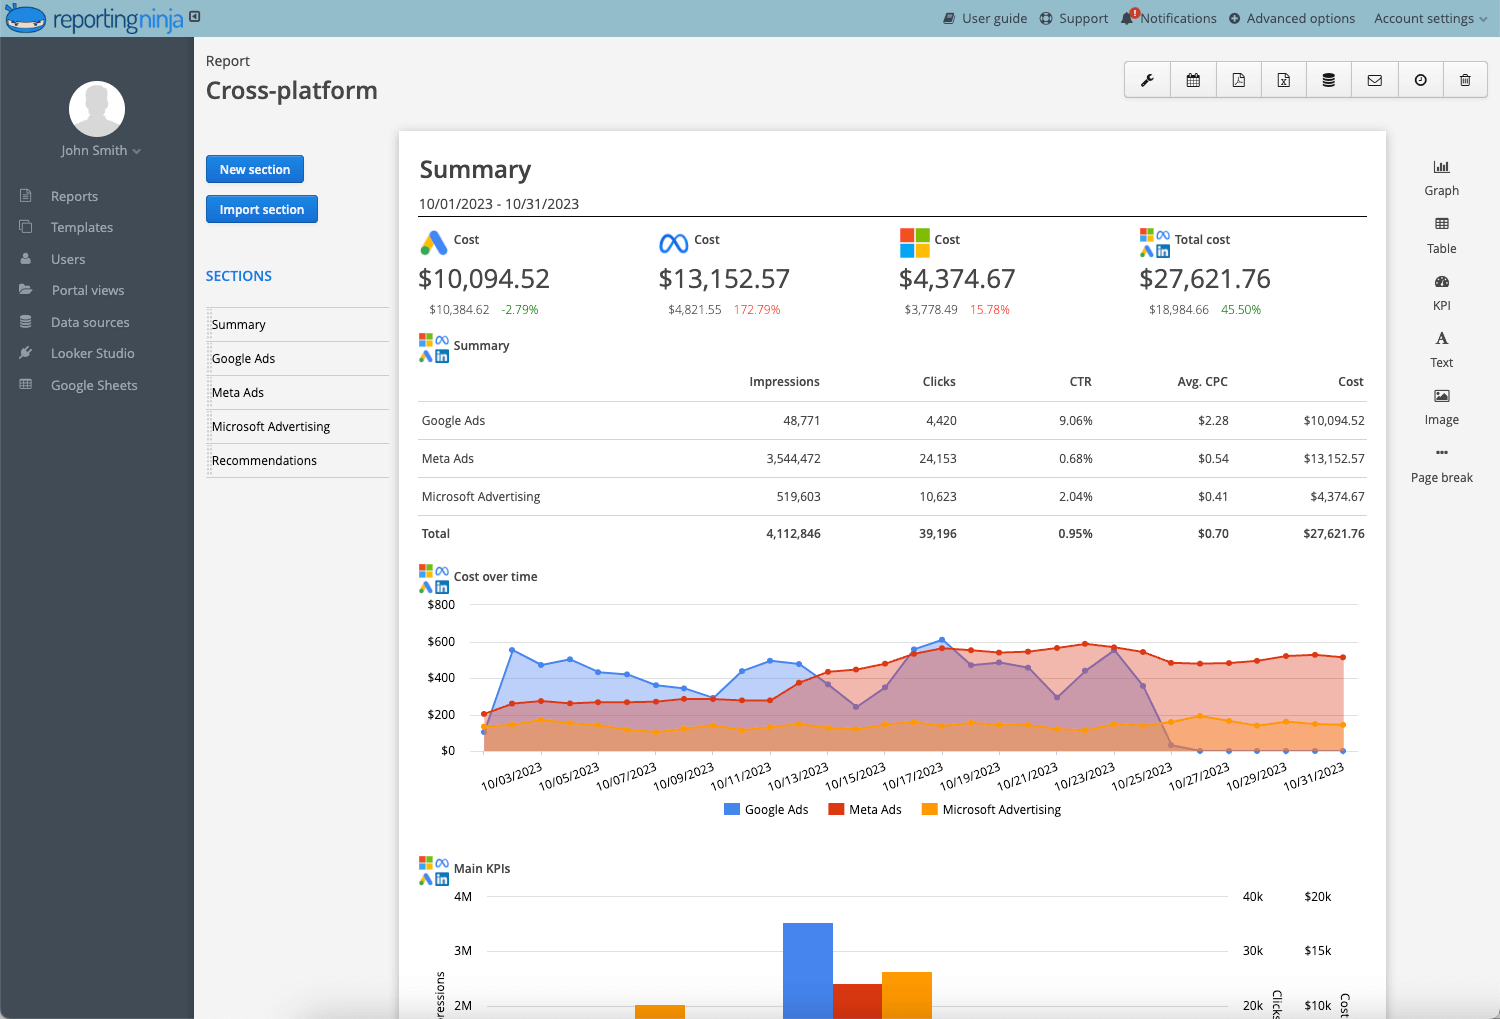
#3: Multi-channel performance report
Before: Separate reports for Facebook, Google Ads, and LinkedIn sent in different emails.
After: One consolidated report combining:
Cross-channel spend
Blended ROAS
Platform comparison charts
Total conversions by source
This reduces fragmentation and helps clients understand overall marketing performance, not just platform-level results.
Key Facebook KPIs and metrics you must track
Not every metric belongs in your report. Focus on numbers tied directly to revenue, efficiency, and growth.
KPI
What it measures
Why it matters
Return on ad spend (ROAS)
Revenue generated per dollar spent
Shows overall profitability of campaigns
Cost per acquisition (CPA)
Cost to generate a conversion or lead
Indicates efficiency and scalability
Click-through rate (CTR)
Percentage of users who click your ad
Reveals ad relevance and creative performance
Conversion rate
Percentage of clicks that convert
Highlights landing page and funnel effectiveness
Cost per click (CPC)
Average cost per ad click
Helps monitor traffic quality and bidding efficiency
Spend
Total budget used
Provides context for all performance metrics
Pro Tip: Pair ROAS with CPA when evaluating campaign profitability. High ROAS campaigns can still underperform if acquisition costs are unstable.
Automate your marketing & social reports in minutes with Reporting Ninja
Manual reporting doesn’t scale. Automation does.
If you’re managing multiple Facebook Ads accounts (or combining paid social with Google, LinkedIn, or TikTok), you need a reporting system that runs without constant oversight.
With Reporting Ninja, you can:
Connect Facebook Ads in minutes
Build reusable report templates
Schedule automatic weekly or monthly delivery
White-label reports for clients
Combine multiple channels into one dashboard
Set it up once. Let it run. Spend your time improving performance, not building reports.
Facebook automated reporting is the process of automatically pulling performance data from Facebook Ads into a scheduled report without manual exports or formatting
Can I automate Facebook Ads reports natively in Ads Manager?
No. Facebook Ads Manager allows exports and saved views, but it does not provide advanced scheduling, white-labeling, or multi-channel consolidation.
How often should I send automated Facebook reports?
Usually weekly or monthly. Weekly works for active campaigns with frequent optimization. Monthly is better for strategic performance reviews.
What’s the best format for automated Facebook reports?
It depends. Agencies typically prefer branded PDF dashboards, while internal teams may use live dashboards or scheduled email summaries.
Do automated reports update in real time?
Sometimes. Most reporting tools sync data on scheduled intervals, which may range from hourly to daily, depending on the platform.
Elevate your marketing reports to the next level
Sign up for a 15 days free trial. No credit card required.
By clicking “Accept”, you agree to the storing of cookies on your device to enhance site navigation, analyze site usage, and assist in our marketing efforts. View our Privacy Policy for more information.