Analytics
June 2, 2026
How to create local marketing reports: Metrics, examples & more



Local marketing reports often miss the one thing clients actually want them to answer: Is this bringing in more customers from my area, and is it worth the investment?
The data is usually there. The problem is that it's buried beneath pages of charts and metrics that business owners skim past.
This guide shows you exactly what to include in a local marketing report, which metrics clients care about (and which they ignore), a five-step framework for building reports that prove ROI, and example layouts you can adapt. By the end, you'll be able to create reports that are easier to read, demonstrate value clearly, and take less time to produce.
Local search drives trackable action, and that’s what makes it one of the easiest channels to prove value on if you report it right. Here's why getting these reports right is worth the effort for the freelancers and small agencies who run them.
Local business owners want every dollar of their marketing budget to work. When a client is spending on Google Ads and a Google Business Profile manager and maybe some local SEO, they want to know it's turning into customers and not just clicks.
The case for local marketing is strong. With 60% of local searches happening on a search engine and billions of monthly "near me" searches, plus 70% of customers more likely to visit a business with a Google Business Profile, local SEO offers one of the highest ROIs in digital marketing.
A report that connects spend to those purchases is what keeps a client paying you next month. If you provide a report that shows raw traffic with no link to revenue, the client starts to question your contract.
Local clients rely on agencies to translate complex marketing data into practical business outcomes, making clear reporting a key part of building trust. A clear monthly report that shows what you did, what happened, and what's next boosts retention more than any single campaign win.
The trust angle is backed by how local customers behave too. Recent studies show that 62% of consumers would avoid using a business if they found incorrect information online. So, when your report shows the client their listing is accurate, complete, and getting found, you're showing them you're protecting their reputation and not just running ads.
A good local report is an early warning system. If calls from the Google Business Profile dropped 30% this month, you want to spot it and explain it before the client emails you asking why the phone stopped ringing.
This matters because local intent converts fast. 76% of "near me" searches result in a visit to a business within a day. When demand is that immediate, a dip in visibility shows up as lost revenue almost right away.
Catching it in your report, with a plan attached, is how you look proactive rather than waiting for your client to point it out.
If you want to make your local reports look good, stop reporting what you can measure and start reporting what the client worries about. A client worried about an empty waiting room doesn't want to hear about impression share. They want to know how many people booked.
Local clients consistently care about a short list of outcomes:
What they don't care about, on its own, is the vanity layer, i.e., total impressions, raw keyword rankings, follower counts, and pageviews with no conversion attached. Those numbers belong in the report as context, but not the headline.
This table maps the gap between what marketers tend to track and what the client is really buying:
Beyond the headline outcomes, a few more specific metrics make a local report truly useful. These go past generic traffic and conversion numbers and often map directly to local performance.
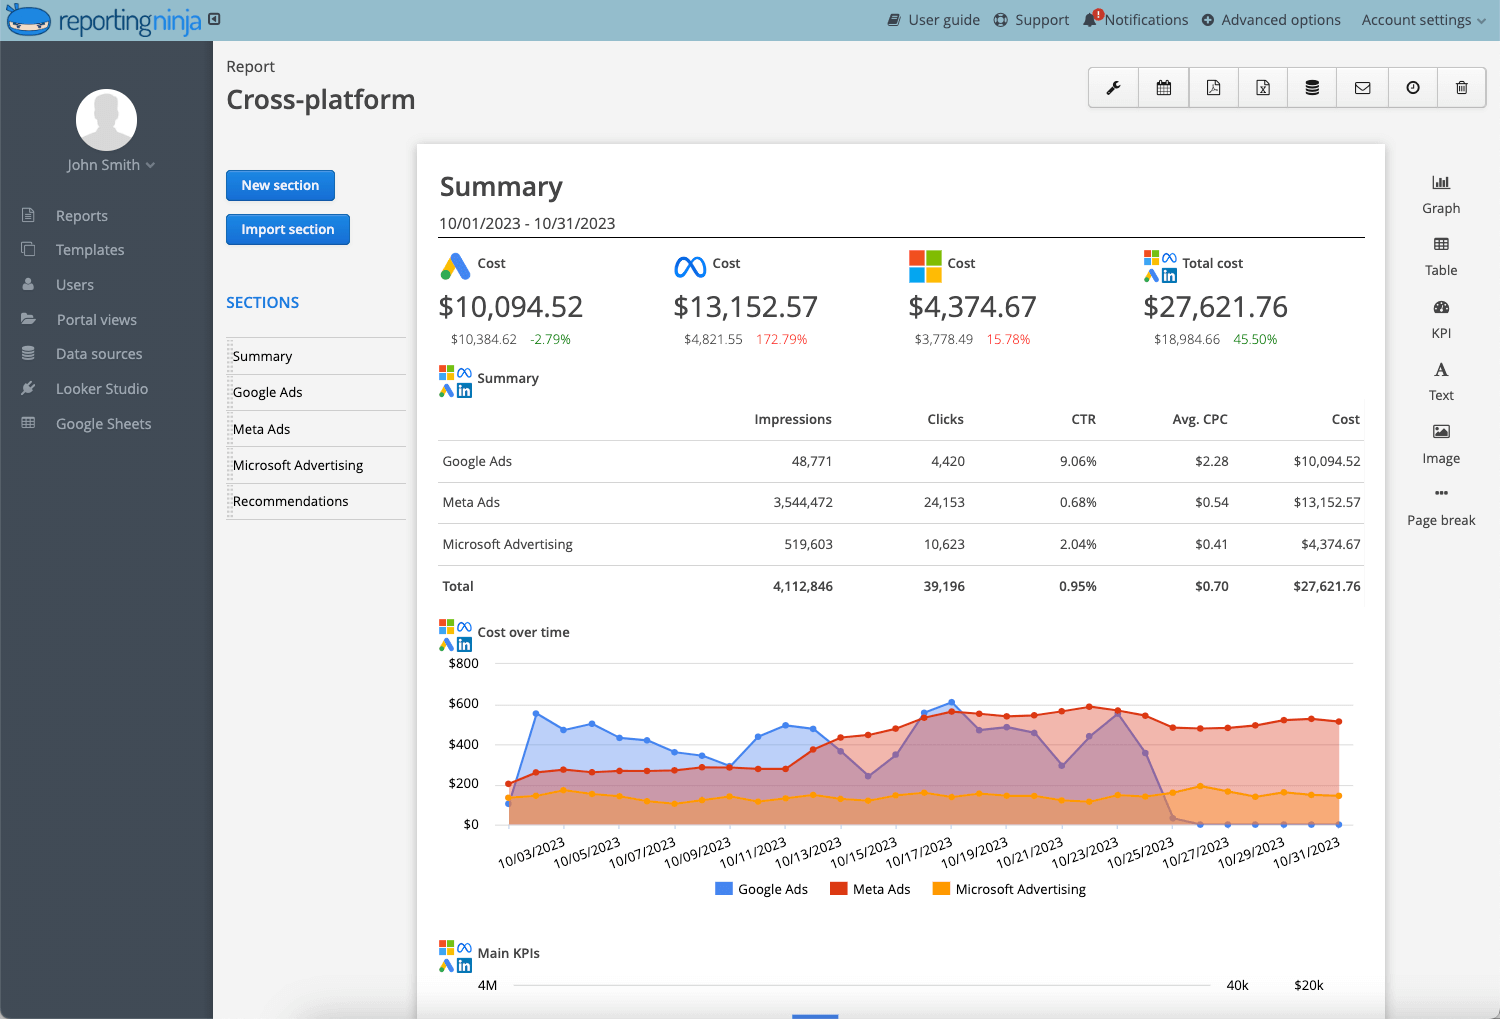
A reporting platform earns its keep here by pulling the Google Business Profile, Google Ads, and analytics data into one place so you're not manually stitching it together.
Reporting Ninja connects these sources and builds the view automatically, which is the whole point of automated marketing reports. The data assembles itself while you focus on what it means.
You don't need a complicated process, just a repeatable one. Here are the five steps that turn scattered local data into a report a client reads and trusts.
Start by writing down what this report is supposed to prove and who's reading it. A solo restaurant owner and a regional franchise manager need different things from the same data.
Ask the client what a good month looks like to them. Their answer (more bookings, more calls, more walk-ins) becomes the headline metric your whole report is built around. If you skip this step, you'll report everything, which means you report nothing.
Local reports usually pull from Google Business Profile, Google Ads, Google Analytics 4, Search Console, a call-tracking tool, and sometimes Meta or a booking system. The manual version of this is logging into each one, exporting a CSV, and cleaning it up.
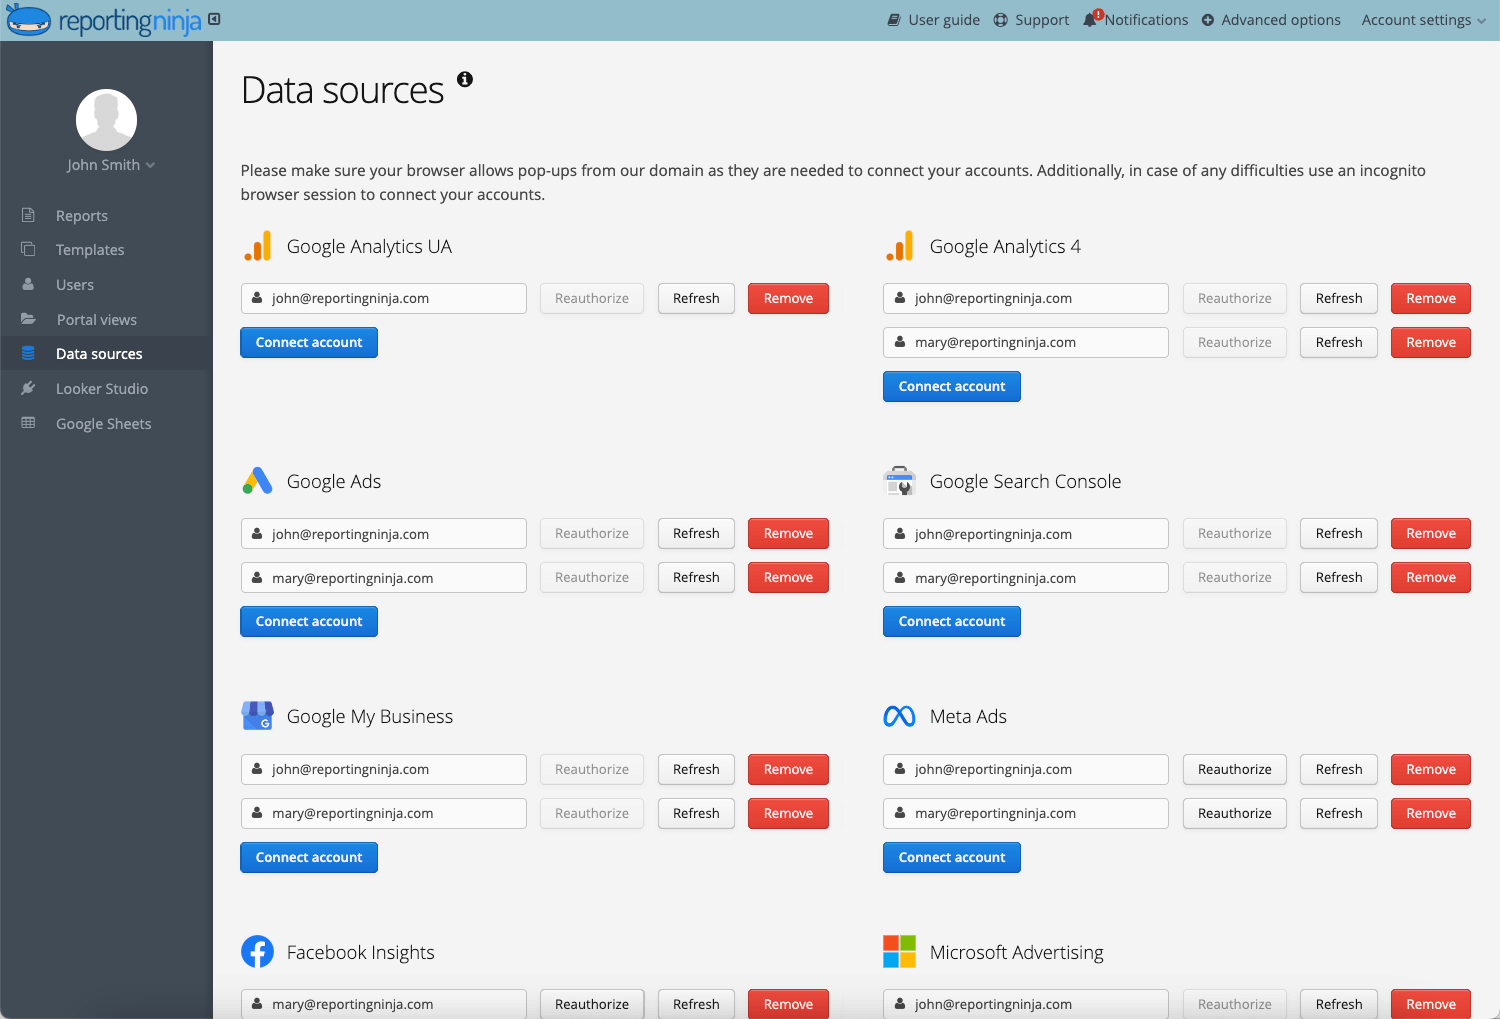
But that’s exactly where most of your hours go. Connecting your sources once to a reporting tool, instead of re-exporting every month, is the single biggest time saver available to you.
For any client with more than one location or one location targeting several nearby areas, segmentation makes the report more useful.
This is also the hardest part to do by hand. Most ad platforms don't offer location-level breakdown, so teams end up exporting data from Facebook, Google, and more, then manually building reports for each stakeholder, which is hard to manage and doesn't scale.
Before the charts, write three or four sentences explaining in plain language what happened, why, and what you're doing next. This is what the client actually reads.
A good summary sounds like a person talking. "Calls from your Google listing were up 22% this month after we added new photos and responded to all reviews. Bookings followed, up 15%.” Don’t use jargon and simply tell the same story the numbers do.
Write the summary last, after you've seen the data, but place it first in the report. It should answer the client's questions before they think to ask them.
The final step is making sure you never build this report from scratch again. Set the report once, schedule it to send weekly or monthly, and let it deliver itself.
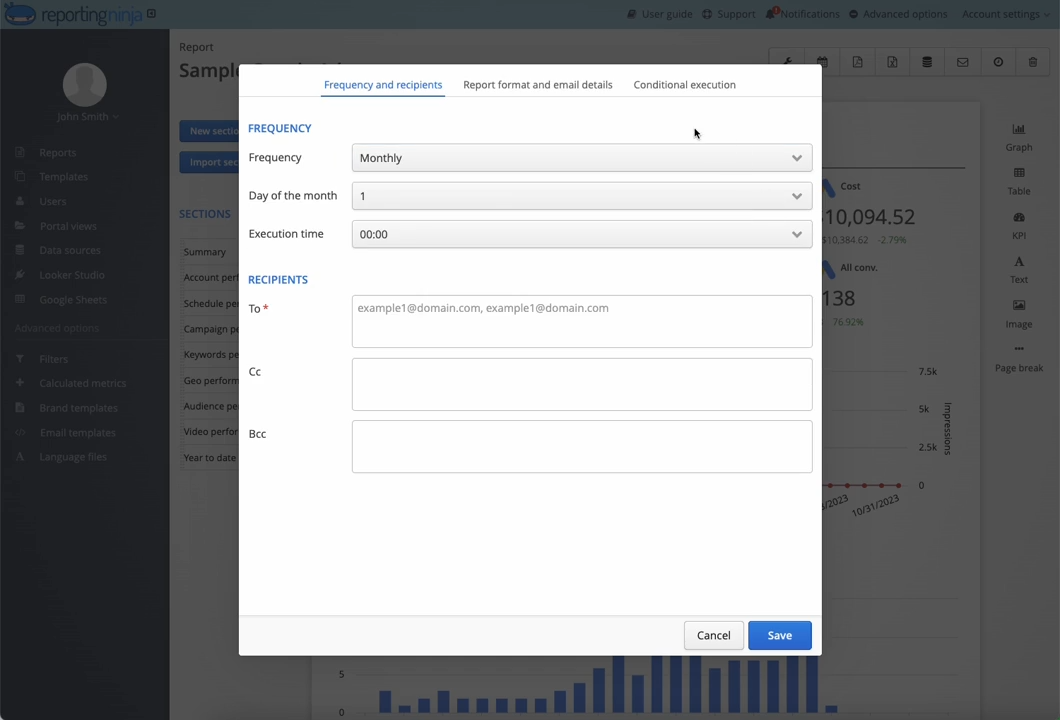
Agency analysts spend hours weekly on reporting, and for agencies managing 15+ clients, manual reporting can consume up to 50 hours or more each month. In contrast, agencies that implement automated reporting typically achieve an 80%+ reduction in preparation time.
Reporting Ninja gives you automated, white-label local reports across Google Business Profile, Google Ads, GA4, and more, with every integration included on every plan starting at $20/month billed annually. Start your free 15-day trial.
{{cta-block-v1}}
The difference between a report that works and one that doesn't is usually layout, not data. Here are three before-and-after patterns you can copy to make your reports effective.
A weak local dashboard opens with twelve widgets of equal size showing impressions, clicks, sessions, bounce rate, and more. All are competing for attention, so the client doesn't know where to look.
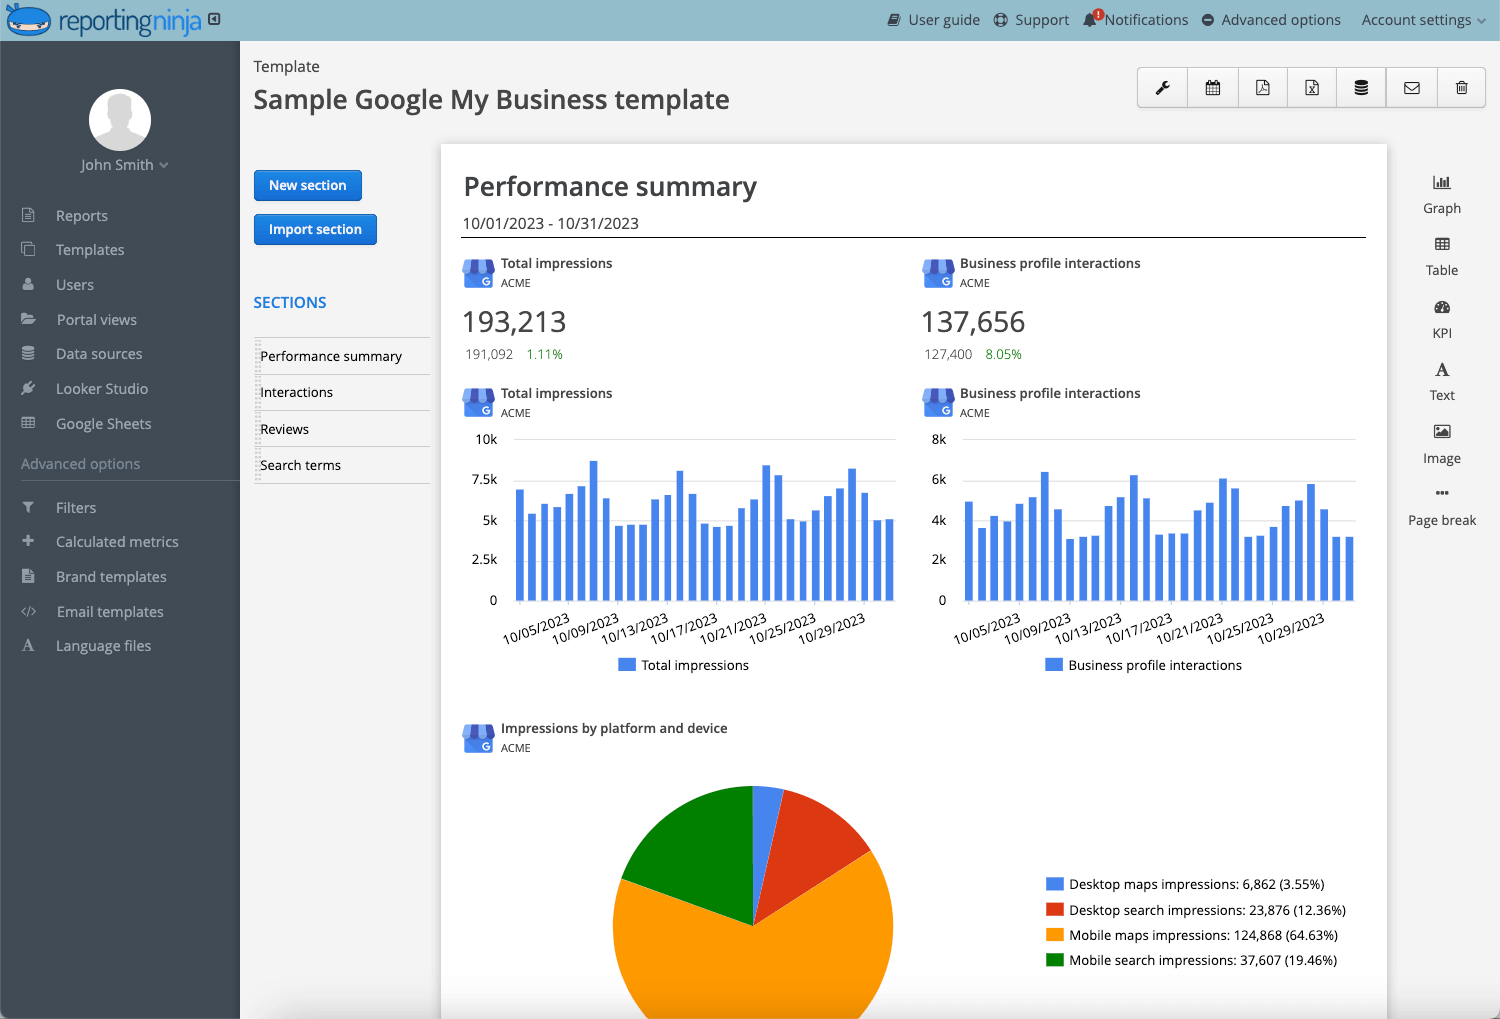
The optimized version leads with a couple of big numbers (total calls and leads this period, with the trend), then a short row of supporting KPIs, then detail below the fold for anyone who wants it. It’s the same data, but the reader gets the answer in two seconds instead of two minutes.
A multi-location report that mashes every branch into one total hides the story. The strong location is propping up the weak one and nobody can tell.
The better layout gives a roll-up summary at the top, then a comparison table or small-multiples chart showing each location side by side.
Corporate teams want the full picture, not 47 individual store reports. Meanwhile, local teams need their own hyper-specific view. You can serve both with one well-designed report structure.
A flat PDF emailed once a month is stale the moment it lands, and it triggers a stream of "can you send me last week's numbers?" emails. Those ad hoc requests are a pure time drain.
A live, shareable dashboard (or a scheduled report based on one) fixes both. The client checks current numbers themselves, and you stop fielding one-off data requests.
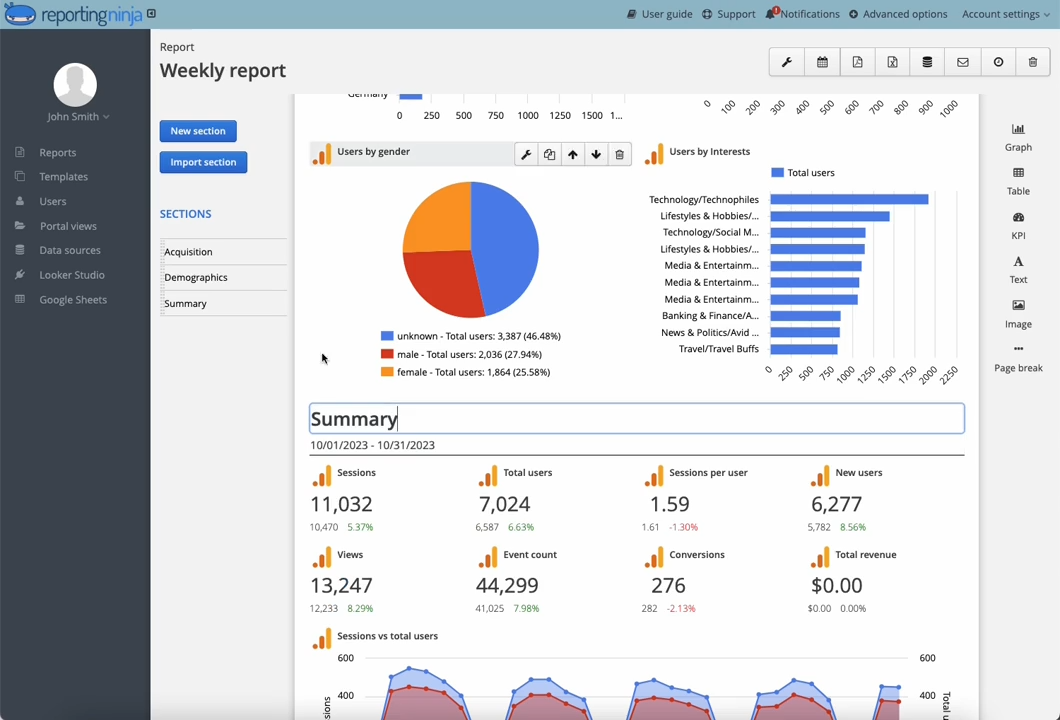
Reporting Ninja's white-label client portal gives each client live access to their own custom report.
Curious what separates reports that drive decisions from reports that get ignored? Here's what consistently works.
Most reporting problems come down to a handful of repeat offenders. Scan this before you send your next one.
The right tool depends on how many accounts you run and how much you can spend, but three features matter most for local work.
Local reports pull from Google Business Profile, Google Ads, GA4, Search Console, and often social. The tool has to bring all of it into one view, or you're back to exporting spreadsheets. Reporting Ninja connects these sources and pulls them into a single report, so you build once instead of stitching exports together every month.
For any multi-location client, you need both the corporate-level summary and the per-location drill-down without rebuilding the report each time. This is non-negotiable for agencies serving local brands at scale.
The tool should let you set a report once and have it delivered on a schedule, white-labeled to your brand. This is where the real time savings live, and it's why automated, scheduled delivery is the feature most worth paying for.
See how fast you can build a local report with every integration included. Start your free 15-day trial, no credit card required, four products in one.
{{cta-block-v1}}
Local clients keep paying when they can see your work bringing them business. The report is how you show them. Get the layout right, lead with outcomes, segment by location, and automate the delivery, and you turn a dreaded monthly chore into your best retention tool.
If manual reporting is eating your week, that's the part to fix first. Connect your local data sources once, build a branded template, and let Reporting Ninja deliver client-ready reports on schedule across every channel.
Start your free 15-day trial and build your first local report today.
A local marketing report is a summary of how a business is performing in a specific geographic area. It pulls together local search visibility, Google Business Profile activity, calls, leads, store visits, and ad spend into one view, so the business can see whether its marketing is bringing in customers from its target location.
They use one consolidated reporting tool instead of building separate reports by hand. The setup combines a roll-up dashboard for leadership with filtered, location-specific views for individual branch managers, so each stakeholder sees only their relevant data.
A general marketing report measures overall performance across all channels and audiences. A local marketing report narrows the focus with location-specific metrics, like Google Business Profile views, direction requests, calls from the listing, local pack rankings, and store visits. The local version answers, "Are people in this area finding and choosing this business?" which a broad report can't.
Monthly is the standard cadence for most local clients, with weekly reports for fast-moving paid campaigns or larger accounts. The key is setting a fixed schedule and sticking to it, since a regular cadence cuts down on ad hoc "send me last week's numbers" requests.
They connect their data sources (Google Business Profile, Google Ads, GA4, and others) to a platform like Reporting Ninja once, build a branded template, and schedule it to send automatically. The report then builds itself each cycle instead of being rebuilt by hand, which is how agencies cut report prep time by 80% or more.
Sign up for a 15 days free trial. No credit card required.

Build and automate amazing custom reports in a few clicks. Save time, be more productive, impress your clients.