Analytics
June 16, 2026
Google Sheets data connectors: use cases, solutions & setup



If you manage client reports across Google Ads, Meta, LinkedIn, and GA4, you already know the routine. Log into each platform, export a CSV, paste it into your sheet, fix the formatting, and repeat it all the next month.
According to a recent survey of 713 marketers, 63% of all data-related work time is spent on tasks that could be partially or fully automated, and data collection tops the list. That's time better invested in analysis and strategy.
Google Sheets data connectors solve this directly. Instead of exporting and importing manually, a connector pulls live data from your marketing platforms straight into your spreadsheet on a schedule you set.
This guide covers what connectors are, why they matter for agencies and freelancers, which types exist, how to set one up, and what to do when connectors aren't showing.
Google Sheets data connectors are tools that pull data from external sources into Google Sheets automatically. Instead of exporting CSV files or manually copying metrics, connectors fetch and refresh data on a schedule.
Here's how the process works:
The biggest difference between a connector and a manual export is automation. Once configured, a connector re-runs the same query on a schedule, keeping your spreadsheet up to date without manual work.
Most freelancers and small agencies start with manual exports because they're free and familiar. However, the real cost shows up in the number of hours spent on reports and not exactly the tool subscription.
Without a connector, reporting looks like this:
With a connector, the structure stays fixed, and the data refreshes automatically. For an agency managing multiple clients, that can mean the difference between two full days of monthly admin and a 30-minute check.
The 2026 Hubspot State of Marketing survey revealed that 59% of marketers analyze campaign data weekly, which means speed of reporting is a necessity to remain competitive. A connector directly helps you keep up by automating the collection layer so you can focus on what the data actually means.
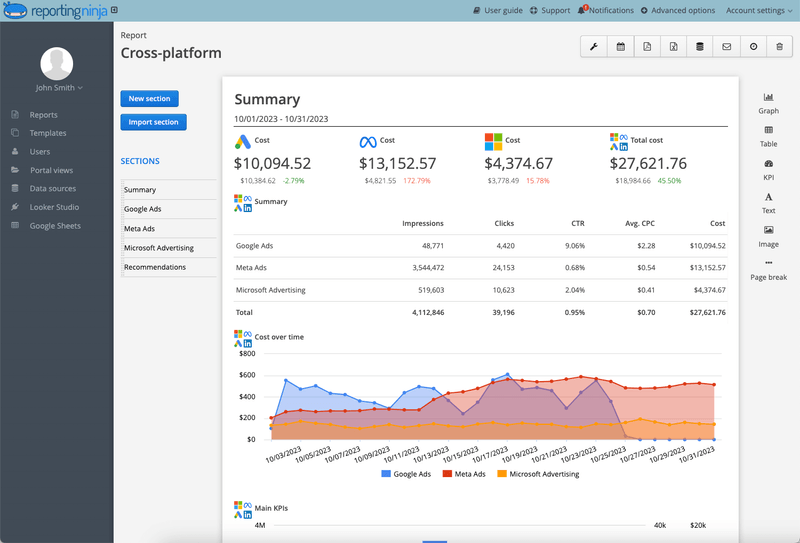
Your clients' campaigns are often spread out across multiple platforms. Google Ads, Meta, LinkedIn, and GA4 each have their own dashboards with their own export formats. A Google Sheets connector lets you pull all of those into a single document, giving you a consolidated cross-channel view without manually reconciling four different CSV formats.
Manual copy-paste introduces errors. A misaligned column, a stale export, or a date range that doesn't match the previous month is an easy mistake that undermines client trust. Connectors pull directly from the source API, so the data in your sheet matches what's in the platform.
Pre-built dashboards are convenient, but they're fixed. Google Sheets lets you write your own formulas, blend data from multiple sheets, build custom attribution models, or create pivot tables that match your client’s understanding of performance.
Adding a connector gives you all the flexibility of Sheets with live data rather than a snapshot. This is especially useful when a client asks for a metric that doesn't exist natively, such as blended CPA across Google and Meta, because you can pull both sources into one sheet and compute it yourself.
A tool like Reporting Ninja makes this workflow seamless for teams that want Sheets-based reporting but still need automation and scheduled delivery across multiple clients.
Not all connectors work the same way, and picking the wrong one for your workflow costs time and money you could’ve saved. Here's how the main categories break down and which situation each one fits.
Google built a native connector directly into Sheets called Connected Sheets. It links Google Sheets to BigQuery, Google's cloud data warehouse, and lets you run SQL queries, pivot tables, and charts against datasets that can contain billions of rows.
This connector is free if you already have BigQuery access, but it comes with restrictions. You need a Google Workspace Business, Enterprise, or Education account, so personal accounts don't qualify. Also, data extracts are capped at 50,000 rows, and the Sheets preview only shows the first 500 rows of query results.
Best for: Teams that already store structured marketing or product data in BigQuery and need to surface it in spreadsheets for non-technical stakeholders.
Limitation: Not useful for pulling raw marketing platform data from Google Ads, Meta, or LinkedIn without a separate pipeline to move that data into BigQuery first.
These are third-party add-ons published in the Google Workspace Marketplace. Once installed, they appear under the Extensions menu, where you authenticate each data source, select your fields, and run or schedule queries.
Popular examples include Supermetrics, Porter Metrics, Two Minute Reports, and Dataslayer.
Best for: Teams that want the connector functionality without managing a separate reporting platform and are willing to pay per-source or per-account.
Limitation: Managing authentication, data freshness, and query logic across multiple sources can get complicated fast, especially if you're handling more than three or four client accounts.
Reporting automation platforms sit between simple connector add-ons and fully custom API integrations. Instead of managing dozens of separate connectors—or building your own integrations—you connect your marketing accounts once and use a single platform to push data into Google Sheets, Looker Studio, and client reports.
Reporting Ninja falls into this category. Our Google Sheets add-on lets you import data from Google Ads, GA4, Meta Ads, LinkedIn Ads, Google My Business, Instagram Insights, Bing Ads, and more, all managed through a single account. You define your query (source, account, fields, date range, filters), and the data lands in your sheet with automatic refresh schedules.
What separates Reporting Ninja from a standalone Marketplace add-on is that the same account covers our Looker Studio connectors and custom reports platform, all on one plan starting at $20/month (billed annually). There’s no separate subscription or per-connector fees.
Best for: Teams managing reports across multiple clients, channels, and data sources who want a single platform for Google Sheets, Looker Studio, and automated reporting.
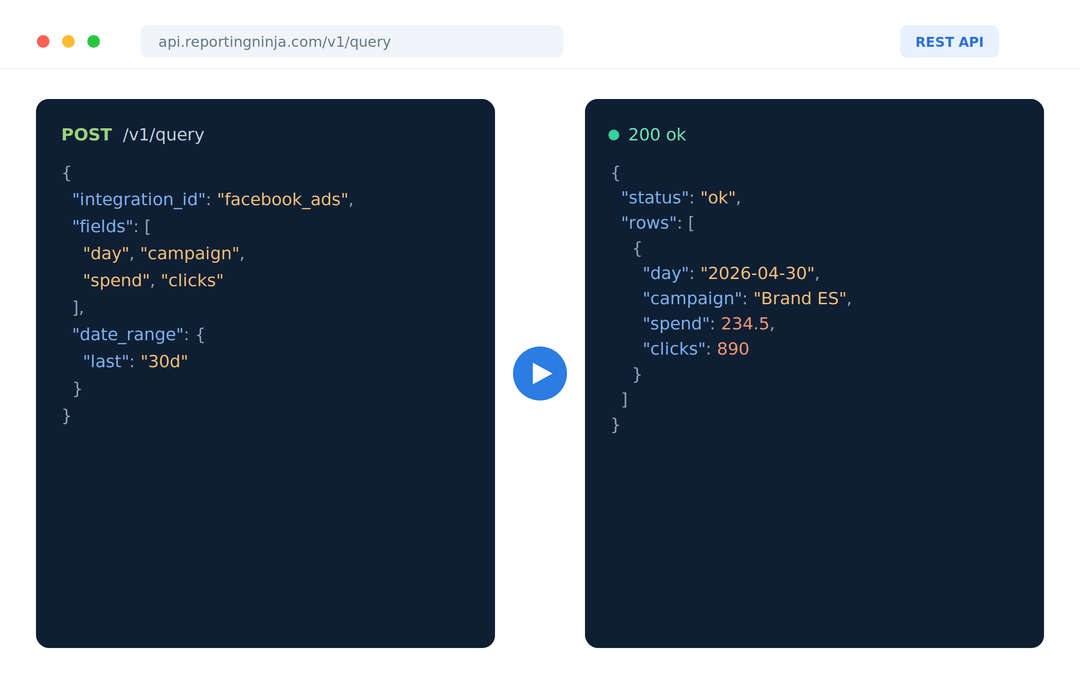
Learn more about Reporting Ninja’s Marketing Data API.
{{cta-block-v1}}
Google Apps Script allows developers to build custom connectors that pull data directly from APIs into Google Sheets. This provides maximum flexibility and avoids connector subscription costs.
However, data sources like Meta and Google don't always announce breaking API changes clearly. Custom scripts built on these APIs can stop working after months of stability, which is the hidden cost of this approach.
Best for: Engineering-heavy teams, custom internal dashboards, or unique data sources that no third-party connector supports.
Limitation: Requires ongoing technical maintenance; breaks when source APIs change; no built-in scheduling or error handling without custom code.
Setting up a connector is usually straightforward, but the structure you build around it matters more than the setup itself. Here's a practical workflow, using the Reporting Ninja Google Sheets add-on as the example.
Visit reportingninja.com and start your free 15-day trial. Once inside, connect the marketing platforms you want to pull data from. All your data source authorizations are managed from one central place, so adding a new client account takes seconds.
Go to the Reporting Ninja add-on page in the Google Workspace Marketplace. Click Install, follow the prompts, and grant the required permissions using the Google account associated with the Sheets file you'll be working in.
Make sure you're installing under the correct Google account, as a mismatch is one of the most common reasons add-ons don't appear in Sheets.
Open Google Sheets and click Extensions, Reporting Ninja, and then Launch. The Reporting Ninja sidebar will open on the right side of your spreadsheet. If the Reporting Ninja option isn't appearing under Extensions, try refreshing the page first.
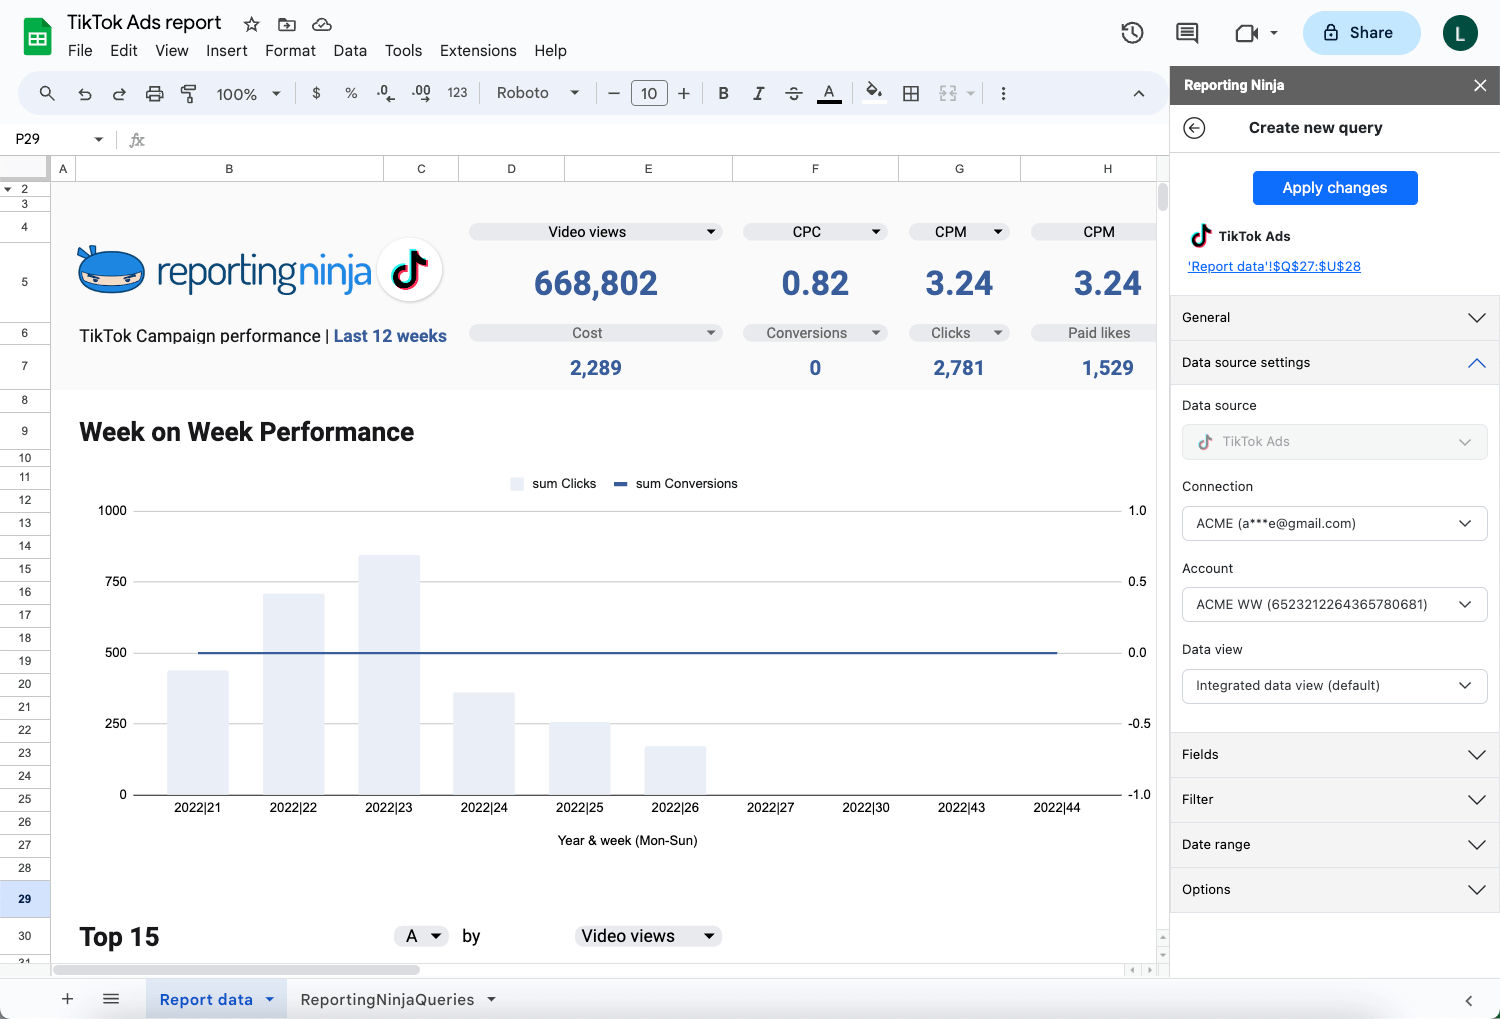
If it still doesn't show, check that you're logged into the same Google account that completed the installation.
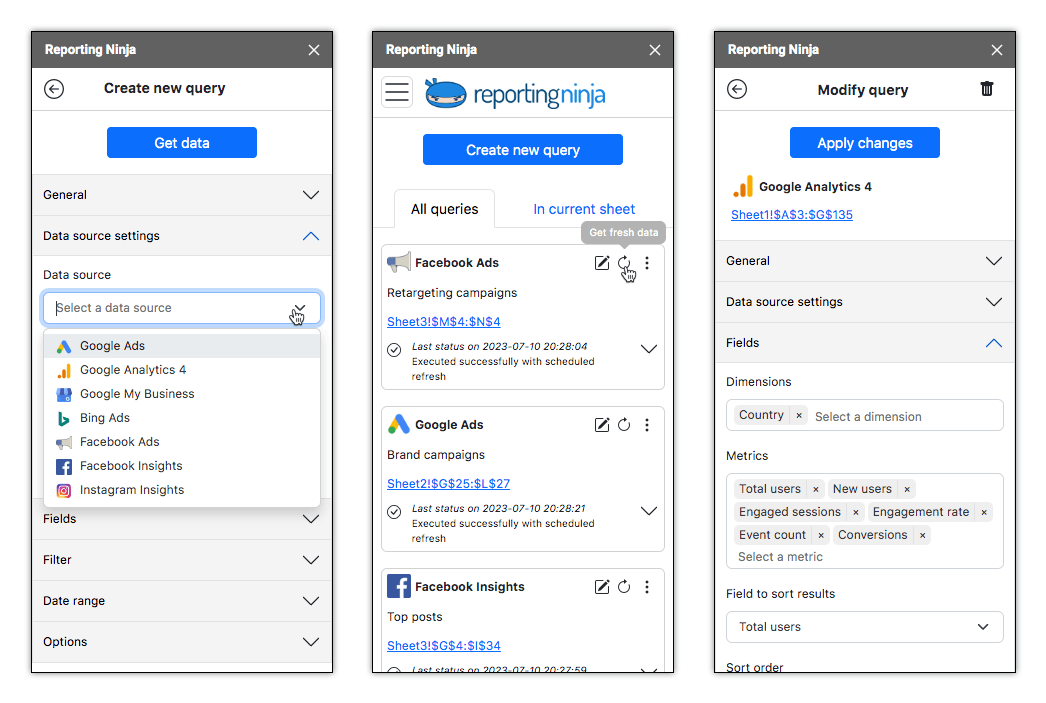
In the sidebar, click Create new query. You'll select:
Click Run, and the data populates into your sheet starting at the cell you've selected.
Once data flows in, keep your raw data tab untouched and never edit it manually. Build separate summary tabs for KPIs using formulas that reference the raw tab, which makes debugging and refreshing easier. Also, use charts and pivot tables built from summary tabs to keep visuals stable when data refreshes.
In the sidebar, open your saved query and set a refresh schedule. Daily is the most common cadence for client reporting. Reporting Ninja will re-run the query on schedule and overwrite the data range with the latest results, so your sheet updates overnight and the data is current by the time your client opens it in the morning.
At this stage, many teams move from standalone connectors to platforms like Reporting Ninja to handle scheduling and multi-client reporting more efficiently.
Start your free 15-day trial with Reporting Ninja.
Getting the connector set up is the easy part. Getting clean, reliable data that your clients can act on takes a bit more thought. These five practices will help you with the latter.
When you hard-code a date range ("January 1 to January 31"), you have to update it manually every month. Most connectors support dynamic ranges like "last 30 days" or "this month to date." Use those wherever possible so your refresh schedule works without intervention.
Fixed date ranges are fine for one-off analyses or historical comparisons, but for any recurring report, dynamic ranges are the correct default.
Resist the temptation to build a slightly different query layout for each client. Consistent column structure across clients means you can reuse the same summary formulas and chart templates without rebuilding them from scratch.
For example, you can name your sheet tabs "GA4_raw," "Google_Ads_raw," and "Meta_raw" across every client so cross-tab formulas use the same references throughout.
Structure the raw data tab with the same columns in the same order for each data source, then build client-specific summary tabs on top. Keep the raw tab untouched, use a transformation tab for formulas, and use a separate dashboard tab for visuals and KPIs.
Connector refreshes can fail silently. An expired API key, revoked permission, or offline platform API can cause your sheet to stop updating without any alert. Most connectors have a refresh log or status panel, so check it before sending a report to a client.
The simplest safeguard is adding a "last updated" cell to your report that pulls the current timestamp when data refreshes. A stale date is an immediate flag to investigate before the data goes anywhere.
Every API call has rate limits, and pulling unnecessary fields or too many historical rows can slow refreshes or trigger errors. Before running a query, think about what fields you'll actually use in the report. Impressions and clicks are standard; reach, frequency, and view-through conversions might only be relevant for specific campaign types. Leaner queries refresh faster, fail less often, and are easier to debug when something goes wrong.
Random refresh schedules create inconsistent data windows that confuse clients and complicate period-over-period comparisons. Align refreshes with your reporting deadlines instead.
For example, if you send reports every Monday morning, then you should schedule a refresh for Sunday night. This ensures every client sees the same fresh data window without manual intervention every cycle.
Google Sheets data connector tools differ in scope, pricing, and complexity. Below are the main options, from native Google tools to third-party connectors and custom scripts.
Google Sheets data connectors solve the difficult task of getting clean, updated data from multiple sources into one place. But once the data is there, the real challenge becomes scaling reports across clients, campaigns, and time periods without rebuilding manually.
This is where Reporting Ninja earns its keep. Our Google Sheets add-on handles the connection and refresh layer so you can focus on the analysis. Plus, the same account gives you access to Looker Studio connectors and a custom reports platform, so you can pick what works for each client.
Want to see it for yourself? Start your free 15-day trial. No credit card or sales call required.
{{cta-block-v1}}
When your data outgrows the spreadsheet. Google Sheets caps every spreadsheet at 10 million cells, so row-heavy or multi-year datasets slow down or stop refreshing. They're also wrong when you need true real-time data, since connectors refresh on a schedule. For those cases, a dedicated platform or data warehouse fits better.
Not on its own. Native functions like IMPORTDATA fetch from a URL but don't connect to Google Ads, Meta, or GA4. To pull marketing data automatically, you need a connector, either a Marketplace add-on or a platform like Reporting Ninja that authenticates each source and refreshes on a set schedule.
Some are. Google's native Connected Sheets is free with BigQuery and a qualifying Workspace account, and custom scripts avoid fees but cost developer time. Add-ons and reporting platforms are paid, usually priced by accounts and sources. Reporting Ninja bundles its Sheets add-on, Looker Studio connectors, and custom reports on one plan starting at $20/month billed annually.
Usually a row or cell limit. IMPORTDATA limits the number of cells returned per call, and Connected Sheets pulls up to 500,000 rows from BigQuery. Google Sheets may return only a subset of the results or display a size-related error when limits are exceeded. Narrow the date range, pull fewer fields, or split the query across tabs.
Sign up for a 15 days free trial. No credit card required.

Build and automate amazing custom reports in a few clicks. Save time, be more productive, impress your clients.