Social
August 18, 2026
Facebook connector: how to set up, use cases & more


You export a CSV from Facebook Ads Manager and another from Page Insights and paste both into a spreadsheet. That works well enough until you have to rebuild the same client report every week, or worse, do it for ten different clients at a time.
A Facebook connector fixes this by automatically pulling your Facebook data into a report or dashboard, so the numbers stay current without you repeatedly touching an export button.
In this guide, you'll learn about the different types of Facebook connectors, how to set one up, what data you can collect using them, how the leading tools compare, and the mistakes that quietly break client reports.
A Facebook connector is a tool that automatically pulls data from the Meta API into a reporting destination like Data Studio, Google Sheets, or a dashboard, refreshing on a schedule instead of requiring a manual export.
There are three types of connectors, depending on the data you need and where you want it to go:
A freelancer juggling five clients needs a combined connector that's fast to duplicate. An agency wants a connector that scales across dozens of ad accounts without per-client setup work. An in-house marketer may only need an ads connector if a separate social team already owns Facebook insights reporting.
Once you've identified the type of connector you need, the next step is understanding how it pulls data from Facebook into your reporting destination.
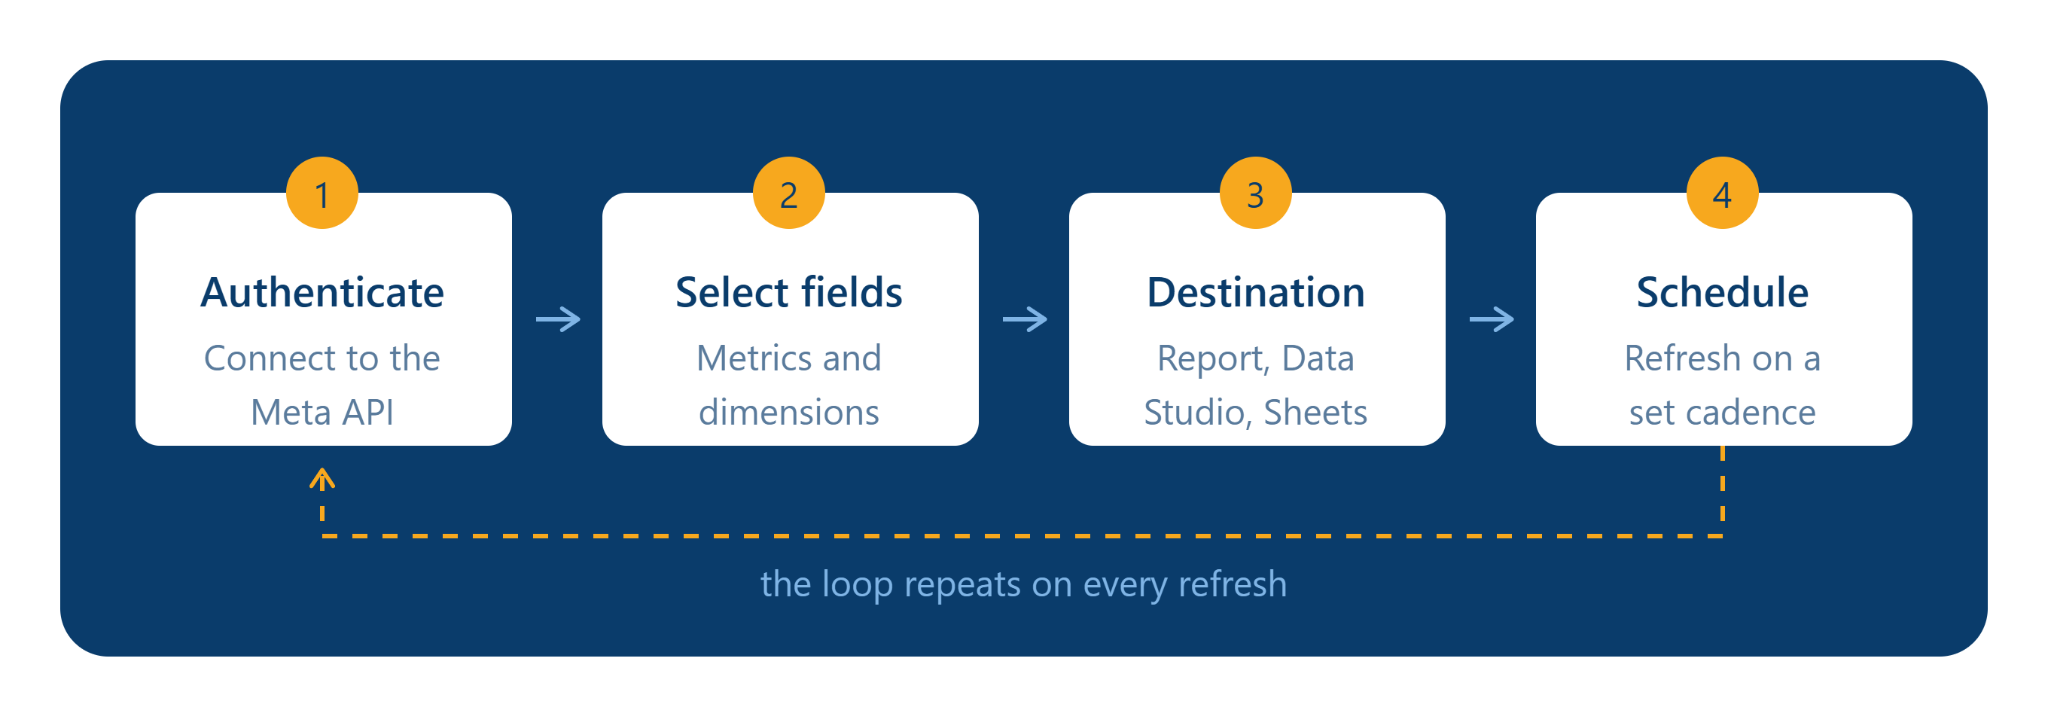
Most Facebook connectors follow the same four-step flow regardless of destination:
Authentication is often where setup issues begin. The connecting account needs Meta Business or ad account-level access, not just a personal login, or you'll end up with the "missing data" problem.
Native connectors, such as those built directly into a reporting platform, tend to be more stable because the platform's team maintains the connector when Meta changes its API. Third-party connectors that sit between the API and your destination add a layer of dependency. The following section breaks down when each type makes sense.
{{cta-block-v1}}
A typical Facebook connector exposes dozens of fields, but only a handful actually belong in a client report. The table below covers the fields that are most relevant to clients.
Ads data centers on delivery and outcomes: how much was spent, how efficiently it was spent, and what it produced.
Cost per result is worth flagging specifically since it normalizes performance across campaigns with different objectives. This makes comparisons much more meaningful than raw conversion totals. Most connectors also expose creative-level data (which specific ad or image is performing) that’s useful when a client asks why performance dipped.
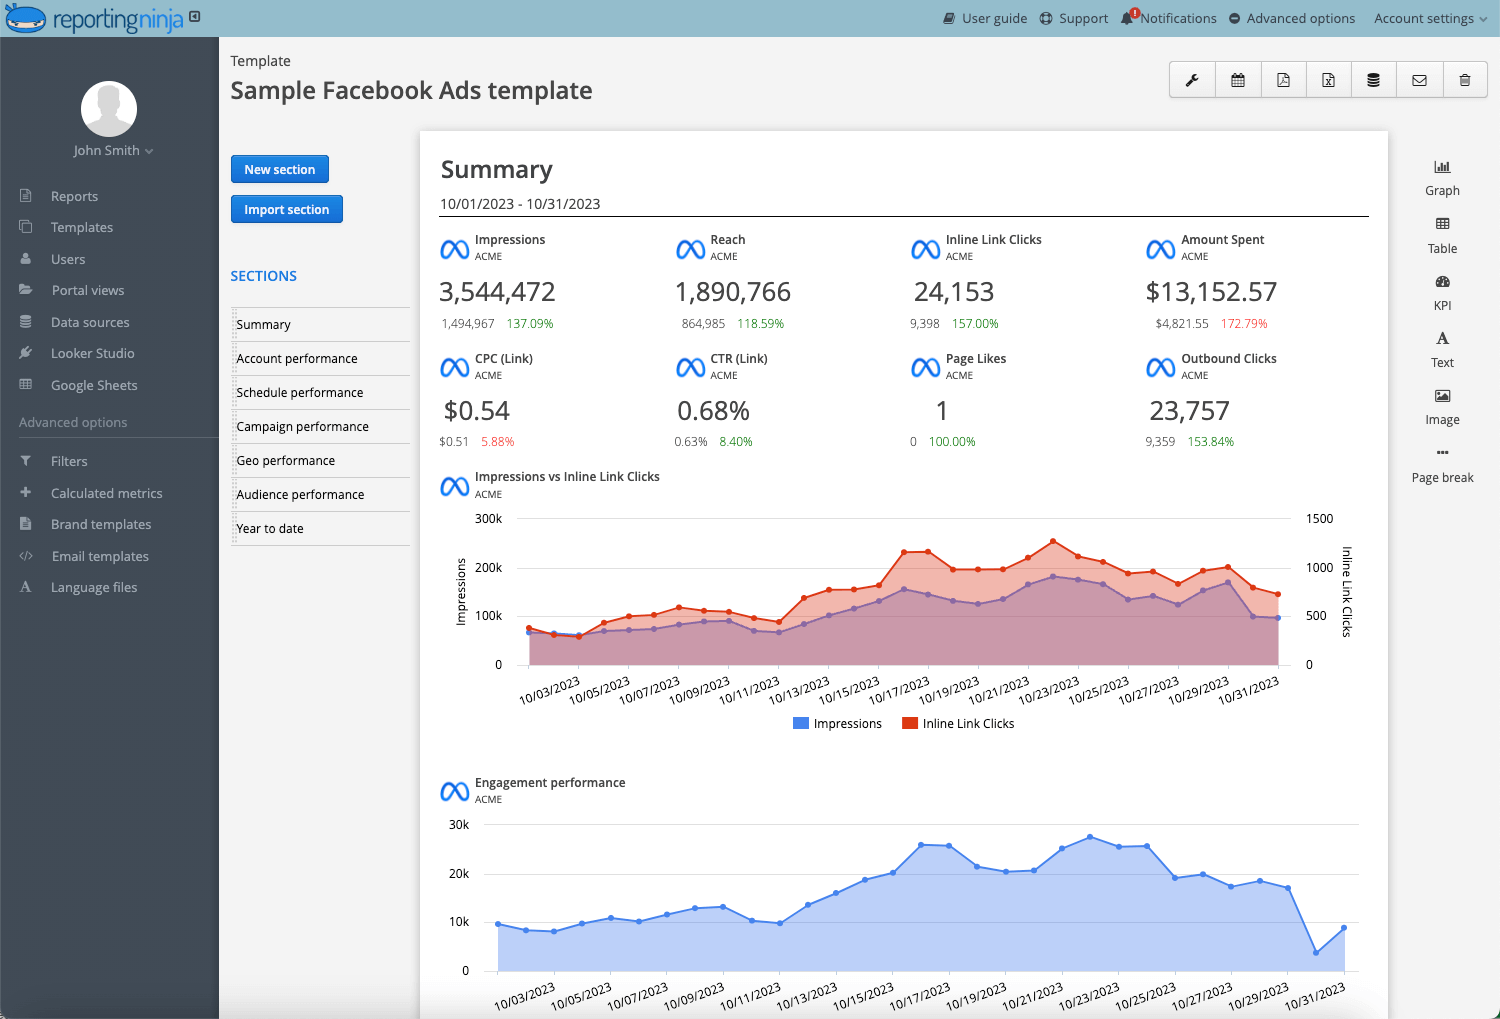
Page data covers reach, engagement, and audience growth without any spend attached. It matters most for clients running an organic content strategy or when you need to show how organic content supports paid campaigns instead of viewing each channel separately.
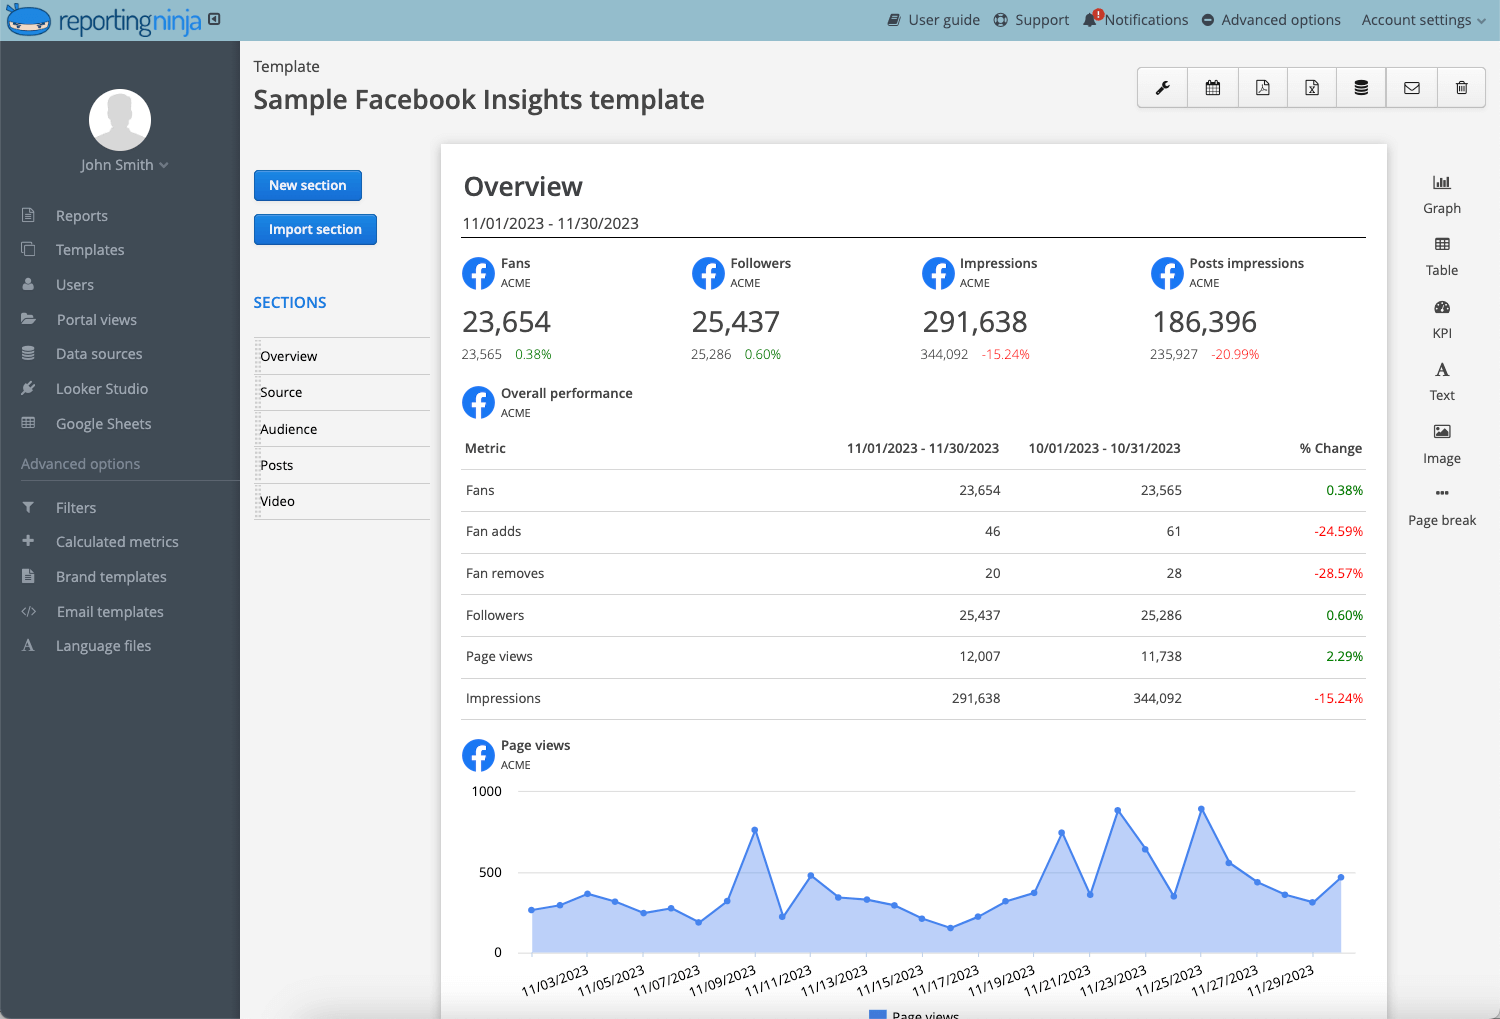
Breaking metrics down by campaign, date, placement, or audience turns a flat number into something actionable. Placement breakdowns (feed versus stories versus reels) in particular often reveal that budget is being spent inefficiently on a placement the client doesn't care about.
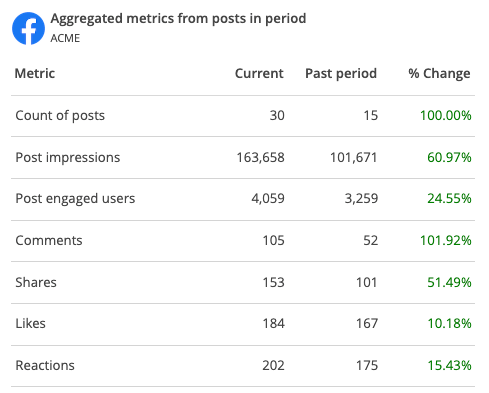
Conversions aren't necessarily comparable across accounts. What counts as a conversion depends on how the client's Meta Pixel and/or Conversions API is configured, including which events and custom conversion rules are being tracked. So two accounts can report a “conversion” metric while counting different customer actions.
Connectors expose standard events like purchases, leads, and add to cart, along with any custom conversions the client has defined. Check which event the campaign is optimizing for before the number goes in a report, since a campaign optimized for landing page views will not produce purchase data.
Once you know which data matters, the next decision is choosing the type of connector that delivers it most effectively.
Facebook connectors fall into four broad categories, and their scope matters more than the feature list.
A native connector is built and maintained by the reporting platform itself. That means you don’t have to manually update to keep it working when Meta changes its API. Reporting Ninja works by combining the connector, report builder, and client delivery all in one place, so there's no separate BI tool to configure.
This is the simplest option for agencies, but you’re generally limited to the destinations supported by that platform.
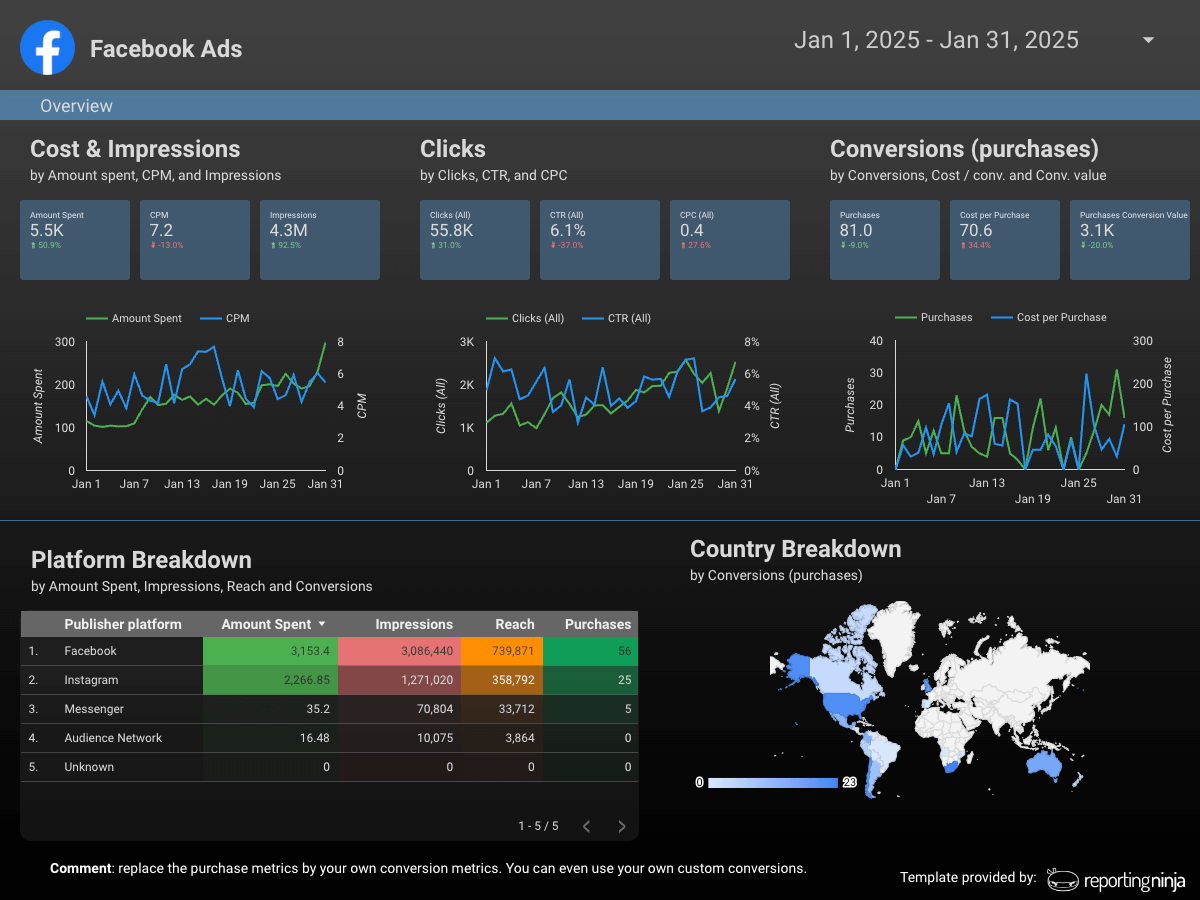
Google offers a free native Facebook connector for Data Studio with basic fields. Third-party connectors like Supermetrics add more granular fields and support for other destinations, but at a per-source and per-account pricing, which gets expensive at scale. Reporting Ninja also offers Data Studio connectors, but on the same affordable plan as the rest of the platform.
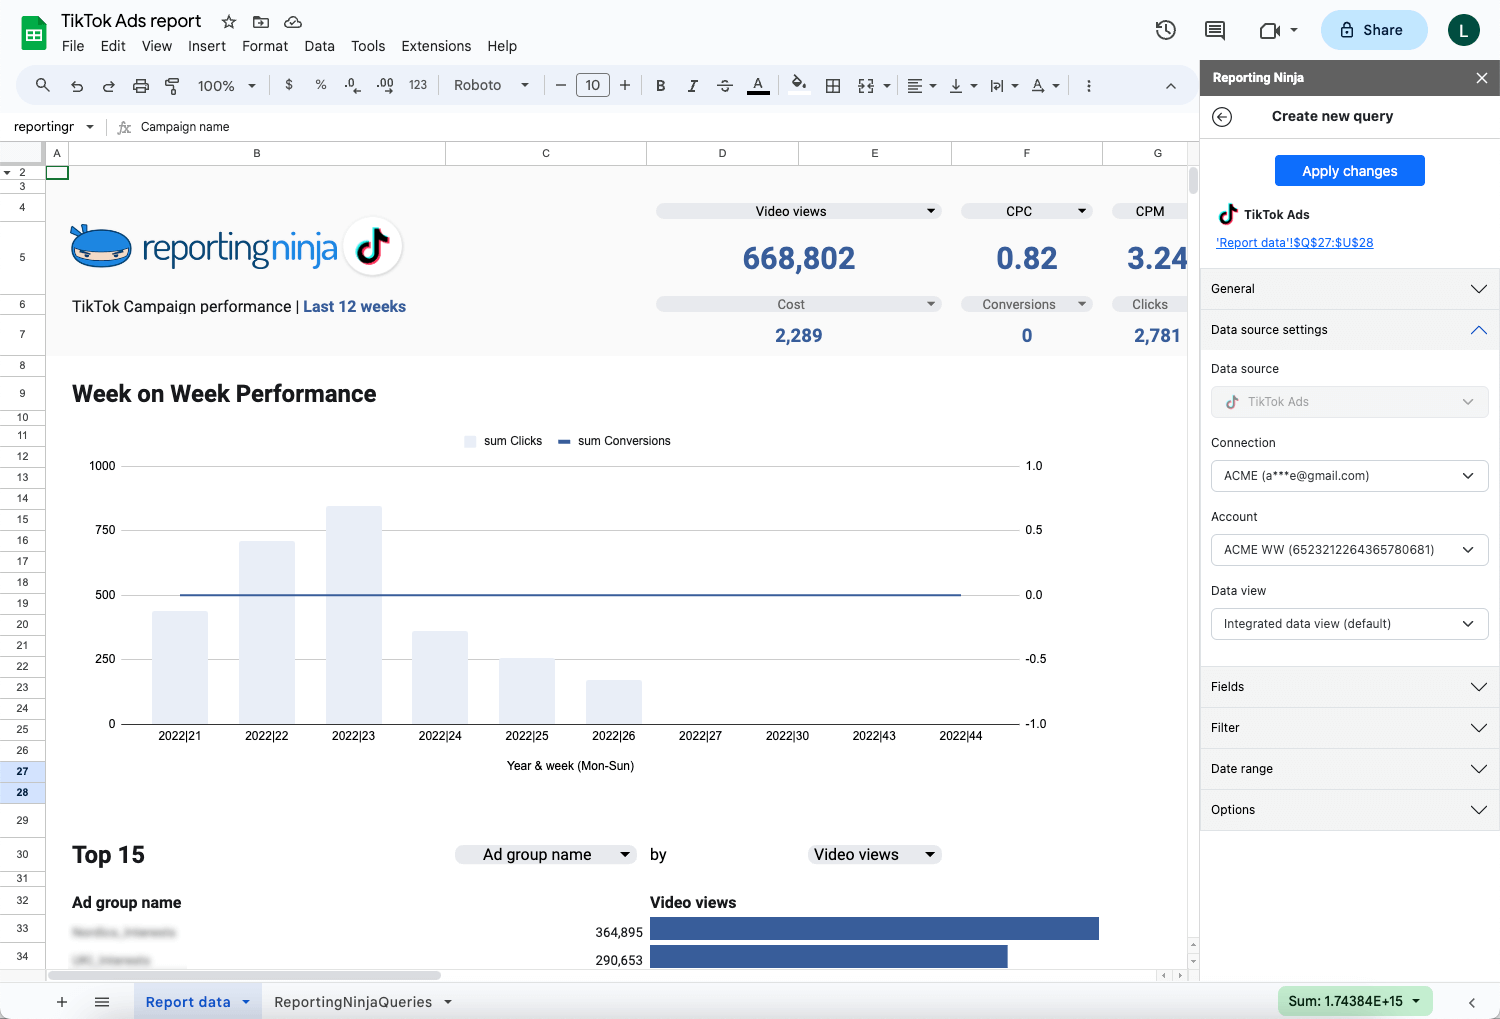
A Sheets add-on suits teams that want to build custom calculations or blend Facebook data with non-marketing data (like sales figures) in a spreadsheet they already control. It's less client-friendly out of the box than a dedicated reporting platform, since you're formatting the report yourself rather than starting from a template. Reporting Ninja also comes with a Google Sheets add-on, if this is the route you prefer for your reports.
These move raw Facebook data into a warehouse like BigQuery or Snowflake for a data team to model and analyze downstream. If you're an agency or in-house marketer building client reports rather than a data pipeline, this category is usually more than what you need.
Connecting Facebook data follows five steps regardless of which tool you choose. Here's the roadmap, followed by the details for each step.
Your destination depends on who's reading the report. If it's an internal team comfortable with Data Studio, a Data Studio connector works fine. If it's a client who needs something polished and branded without you manually formatting it, a dedicated reporting platform gets you there faster.
Agencies managing multiple clients should consider how easily a destination lets you duplicate a setup across accounts, since rebuilding from scratch for each client defeats the purpose of automating in the first place.
Log in with a Meta account, then grant the connector access to the specific ad account or page you're reporting on.
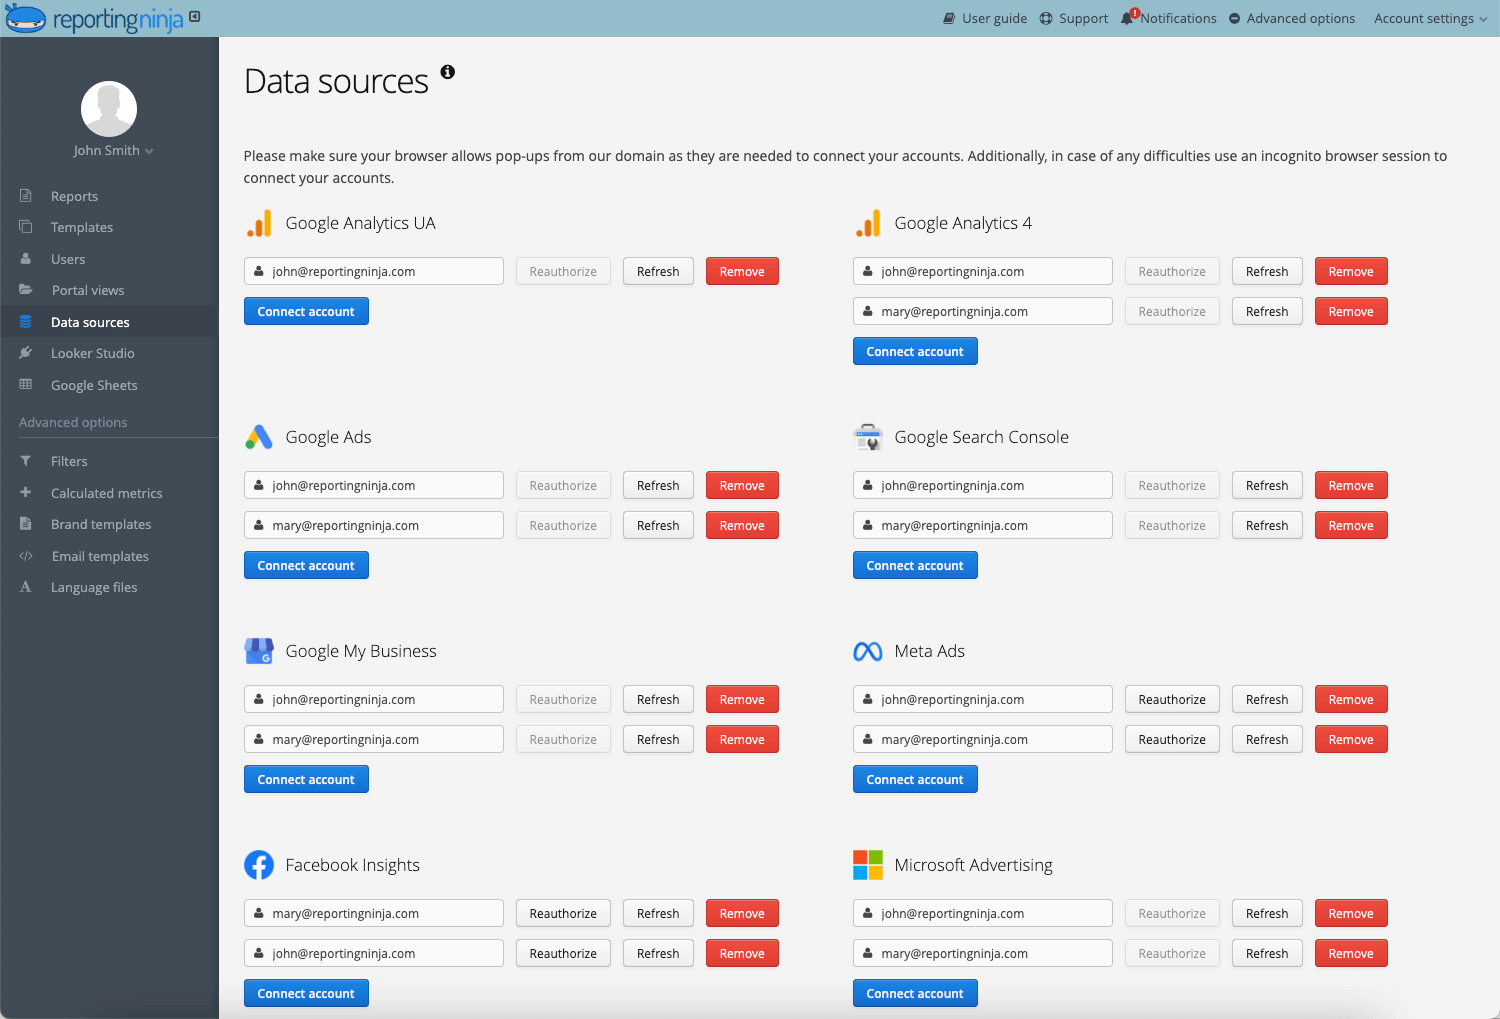
Use an account with full Meta Business admin access when authenticating, not a personal profile with limited permissions. This single step causes most of the "Why is my data missing?" tickets connector support teams receive.
Select only the metrics and dimensions you've identified as important, rather than importing every available field. Over-selecting fields slows report load times and buries the metrics your client actually asks about.
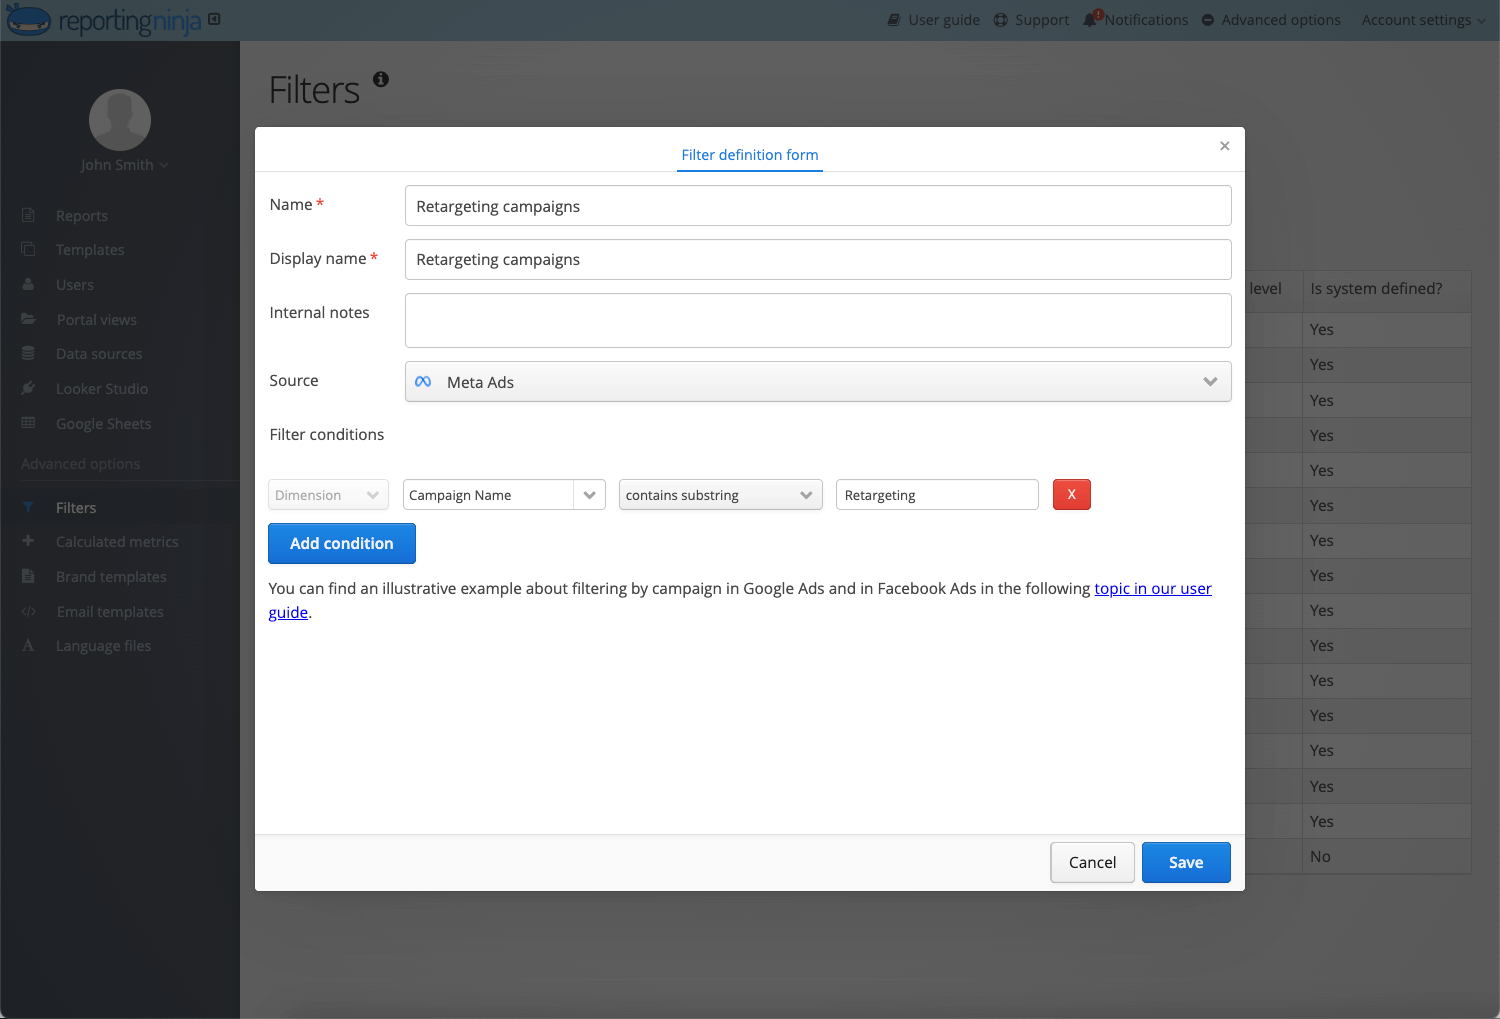
Starting from a pre-built template saves significant setup time versus building a report from a blank canvas, and it makes future edits easier since you only update the template once. Reporting Ninja's Facebook Ads report template and Facebook Insights template cover both sides of this without a rebuild.
Set the report to refresh automatically and deliver by email on whatever cadence fits the client relationship, weekly or monthly. This is also where a tool like Reporting Ninja fits naturally. It connects Facebook Ads and Insights data directly into a scheduled, branded report, so you skip the extra step of exporting into a separate BI tool entirely.
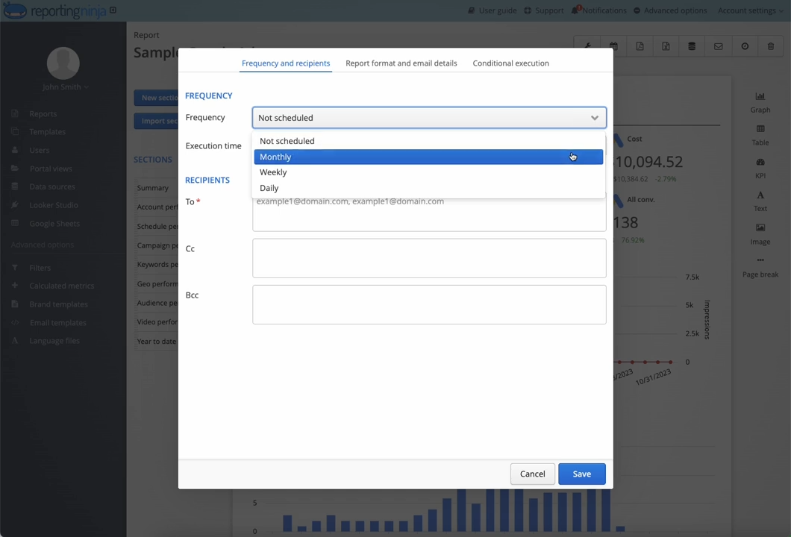
If you're reporting for multiple clients, duplicating a proven template across accounts saves far more time than rebuilding each one individually.
Once your refresh and delivery schedule is set, you won't touch a templated report again until something changes on the client's end. Sign up for Reporting Ninja with your free 15-day trial and get started on your first automated report.
Manual CSV export is still technically an option, but it doesn't scale past one or two clients before it becomes the bottleneck in your reporting process. Here's how the main automated options compare.
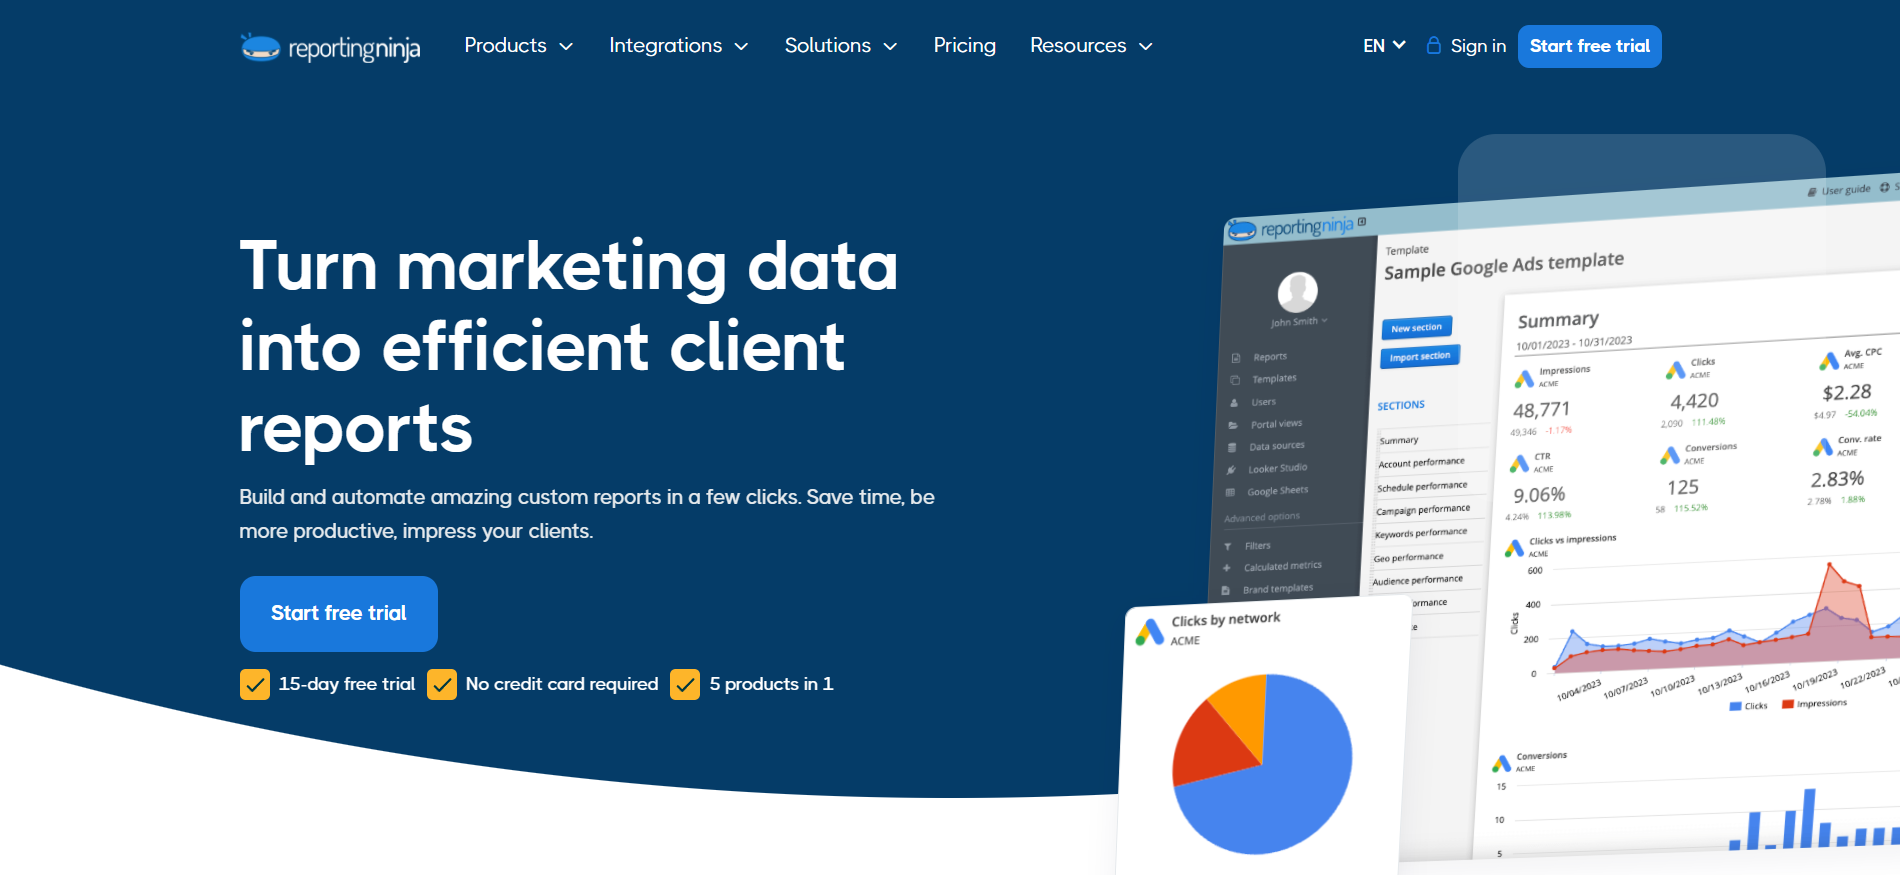
Reporting Ninja gives you three ways to work with Facebook data on a single plan: a custom reporting platform, Data Studio connectors, and a Google Sheets add-on, alongside REST API and MCP access for teams building their own integrations. Every paid plan includes the same features and integrations, so you don't have to upgrade to unlock Facebook Insights reporting or the client portal.
You can build reports from scratch or start with a ready-made template, then automate delivery through scheduled PDFs or a white-label client portal. Some standout capabilities include:
Plans start at $20/month (billed annually) for 10 reports and four users, scaling to $120/month for 150 reports and 16 users. Reporting Ninja is built specifically for marketing reporting rather than warehouse pipelines, making it a strong fit for freelancers, agencies, and in-house marketing teams.
It doesn't offer done-for-you report builds, so teams looking to move raw data into a warehouse will be better served by an ETL platform. For agencies blending Facebook with other channels, cross-platform reporting in the platform lets you report insights alongside Google Ads, GA4, and more in one view.
Explore Reporting Ninja’s integrations to see which marketing channels you can combine with your Facebook data.
{{cta-block-v1}}
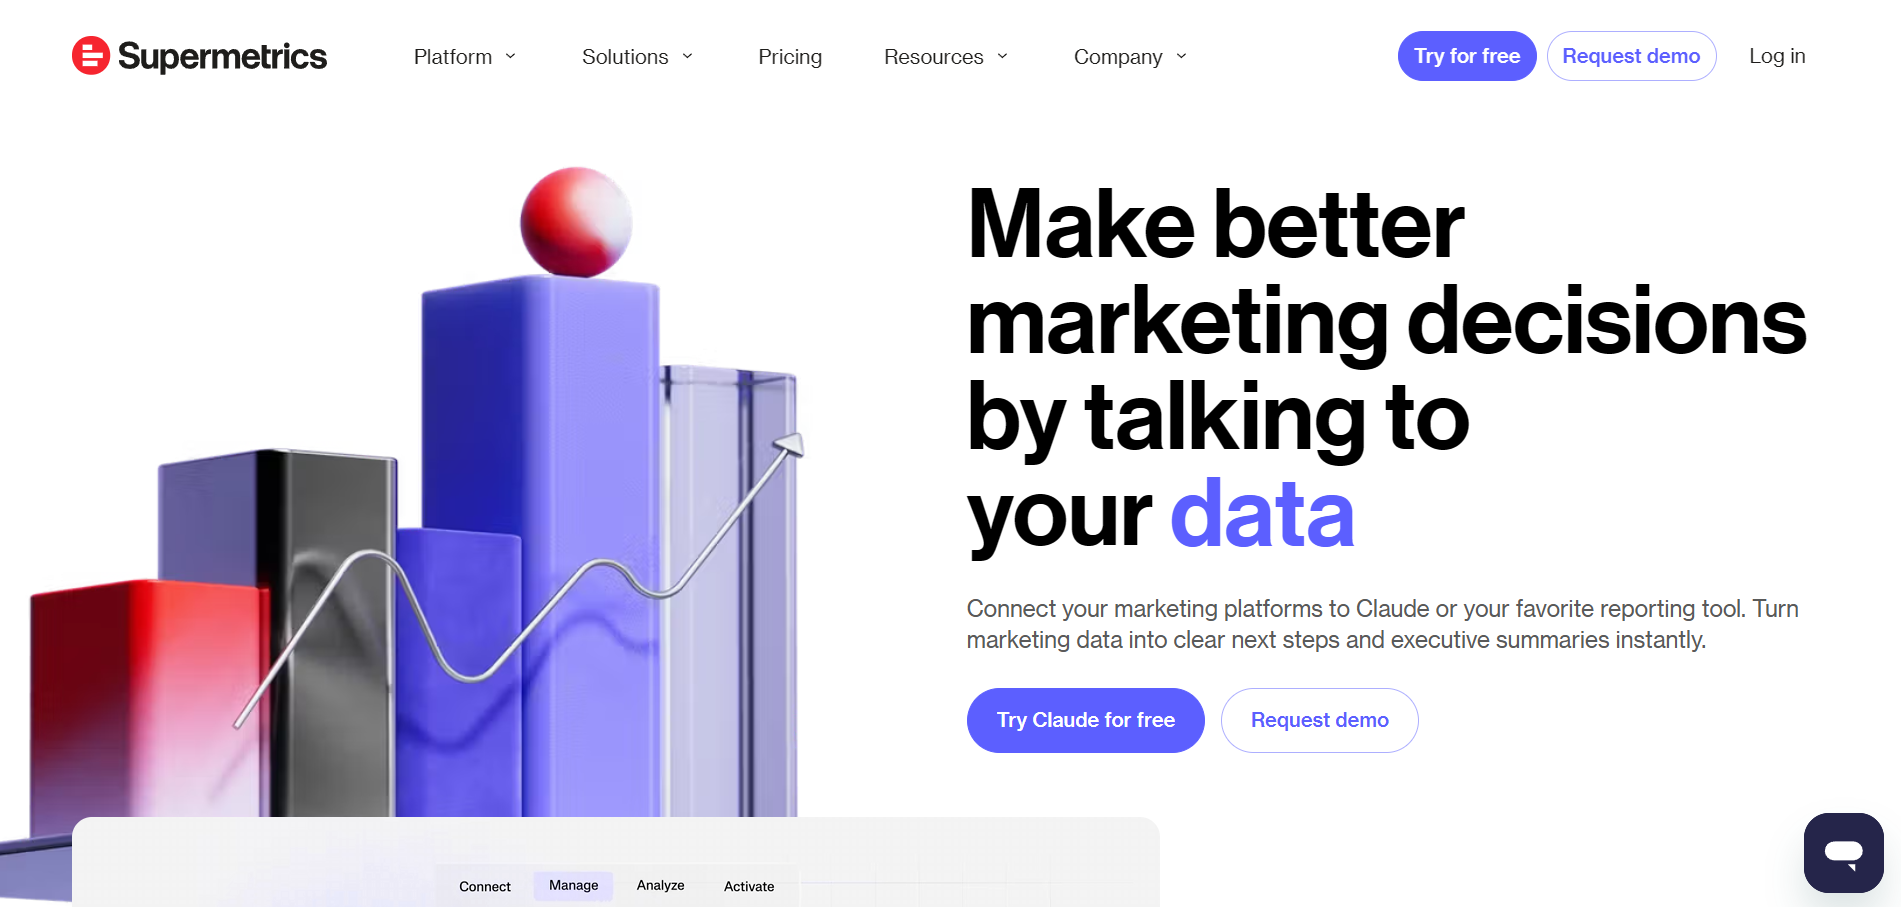
Supermetrics runs Facebook and Instagram Ads through a single connector, so paid data from both platforms arrives as one data source. The field list covers spend, reach, engagement, creative-level breakdowns, and audience performance. Campaign, ad set, and creative-level metrics can be combined with audience and placement data in the same query.
Organic Page data is available in a separate Facebook Insights connector, which pulls page and post level data. If a client report needs paid and organic side by side, that means connecting two separate sources.
The platform offers a wide range of destinations. The same Facebook data can go to Data Studio, Google Sheets, Excel, Power BI, BigQuery, Snowflake, or Amazon Redshift. This best suits teams that report from a data warehouse rather than a dashboard.
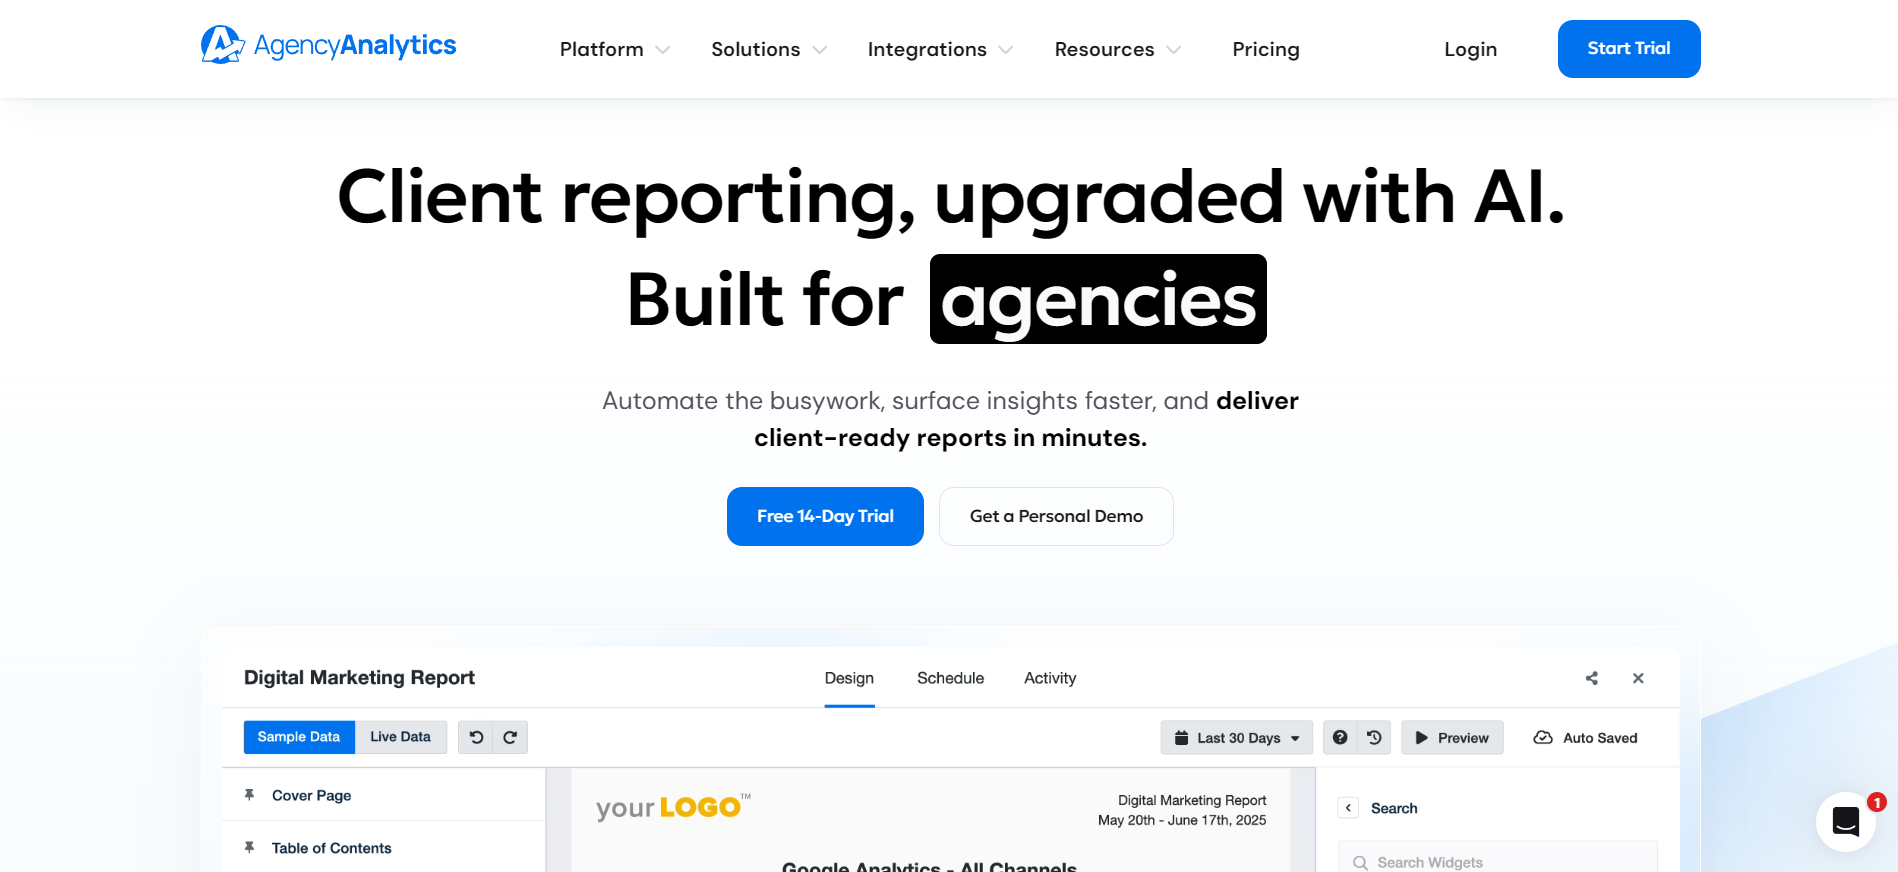
AgencyAnalytics publishes its full Facebook Ads field list on the integration page, grouped into ad analytics, conversion analytics, and event analytics. The list runs deep on cost-per-result variants and video completion metrics.
Results can be viewed by campaign, ad set, or ad name, with demographic breakdowns by age, gender, and location. Organic Page data comes through a separate Facebook integration that merges into the same report.
Agencies, freelancers, and in-house teams all use Facebook connectors for the same reason: eliminating the manual work of building the same report repeatedly. Here's how that plays out across three common scenarios.
The problem: Building individual Facebook Ads reports by hand for each client every month, which is roughly a full day of work per cycle.
What they connected: A combined Ads and Insights connector feeding a reusable template across all 12 accounts.
The result: Reporting time drops from a full day to under two hours per cycle, giving the account team more time to focus on client strategy instead of report preparation.
The problem: Clients expect polished, branded reports, but manual formatting in a spreadsheet wastes billable hours weekly.
What they connected: A dedicated reporting platform with a Facebook Ads template and their own logo applied.
The result: The reports are now generated and delivered automatically, reducing admin work and freeing up more time for client work each month.
The problem: Facebook, Google Ads, and GA4 data live in three separate exports, making a unified performance view impossible without manual stitching.
What they connected: A cross-channel dashboard combining all three sources in one view.
The result: Weekly leadership reviews moved from a manually assembled slide deck to a live dashboard that updates itself.
Building one reusable Facebook Ads template instead of rebuilding reports per client is the single biggest time-saver agencies report.
Try Reporting Ninja for free and build your first template today.
No Facebook connector is completely maintenance-free. Because connectors rely on third-party APIs, changes to available metrics, permissions, or reporting endpoints can occasionally cause discrepancies or temporary interruptions until providers roll out updates. User feedback reflects this reality.
Reddit user Digitxl_agency observed, "The biggest issue with social connectors is that platforms keep changing APIs, deprecating metrics, or restricting access, and some connector providers keep up better than others."
The takeaway is to choose a provider with a strong track record of responding quickly to API changes and to periodically validate your most important metrics.
Stop rebuilding the same Facebook report from a CSV export every cycle. Reporting Ninja connects your Facebook Ads and Facebook Insights data straight into automated, branded, cross-channel reports, so the only manual work left is reviewing the insights with your client.
Every plan includes both integrations alongside four others on one plan. Start your free trial and get a connected, up-to-date report in minutes.
{{cta-block-v1}}
Yes. Google's native Data Studio connector for Facebook Ads is free, though it offers fewer fields than paid third-party or platform connectors.
Yes. Combined setups, including Reporting Ninja's, can pull both types of data into one surface.
No. Both native and third-party connectors are built for no-code setup through account authentication and a menu of fields.
It depends on the tool and plan; most range from weekly to daily, with some offering on-demand refresh for real-time checks.
Yes, most connectors support multiple ad accounts in one setup, though the number allowed depends on your plan or tier.
Sign up for a 15 days free trial. No credit card required.

Build and automate amazing custom reports in a few clicks. Save time, be more productive, impress your clients.