Analytics
May 16, 2026

Cross-channel marketing reporting: how to, what to track & more

Fran Sánchez
Head of Marketing at Reporting Ninja
Cross-channel marketing reporting: how to, what to track & more

Key takeaways

  • Cross-channel marketing reporting unifies data from platforms like Google Ads, Meta, LinkedIn, email, and SEO into one performance view, so you can stop guessing which channels actually work
  • A strong report tracks spend, conversions, revenue, ROAS, CPA, CTR, traffic quality, and channel-level trends (not just vanity metrics)
  • The best reports connect marketing activity to real business outcomes: leads, sales, and revenue
  • Tools like Reporting Ninja automate data collection, dashboard building, and scheduled client reporting: across every channel, in one place

Managing campaigns across five platforms, but still unsure which one is driving revenue? 

That's the core problem cross-channel marketing reporting solves.

Cross-channel marketing reporting is the process of pulling data from all your active marketing channels—paid search, paid social, SEO, email, and ecommerce—into a single, unified view. 

Instead of jumping between dashboards, you can compare channels, evaluate spend, and make smarter budget decisions using one report.

In this guide, you'll learn what a great cross-channel report includes, how to build one step by step, which metrics to track, and how Reporting Ninja makes the whole process faster.

What should a good cross-channel marketing report include?

A good cross-channel marketing report shows how every channel contributes to traffic, leads, and revenue. It goes beyond what any single platform can tell you. 

At a minimum, your report should cover:

  • Channel performance—paid search, paid social, organic, email, and referrals
  • Spend and efficiency—ROAS, CPA, CPL, and conversion data
  • Funnel metrics—impressions through to sales
  • Audience and campaign breakdowns—to identify which segments respond best
  • Time-based comparisons—week-over-week, month-over-month, or campaign-over-campaign
  • Clear visual summaries—for clients or stakeholders who need fast answers
Reporting element What it shows Why it matters
Traffic by channel Where visitors come from Identifies which channels attract attention
Spend and CPA What each result costs Shows budget efficiency
Conversions and revenue Which channels drive outcomes Connects activity to business results
Engagement metrics How users interact Adds context beyond clicks
Trend comparisons How performance shifts over time Flags growth, decline, or seasonality
Recommendations What to do next Turns the report into a decision tool

For more on structuring reports that actually get read, see our guide to creating effective marketing reports.

Step-by-step guide to building a cross-channel marketing report 

Here's how to build a cross-channel report that answers real business questions—without drowning in data.

Step #1: Define the reporting goal 

Before pulling any data, decide what question the report needs to answer.

A paid media agency report looks very different from one built for an ecommerce brand. Your report might need to show:
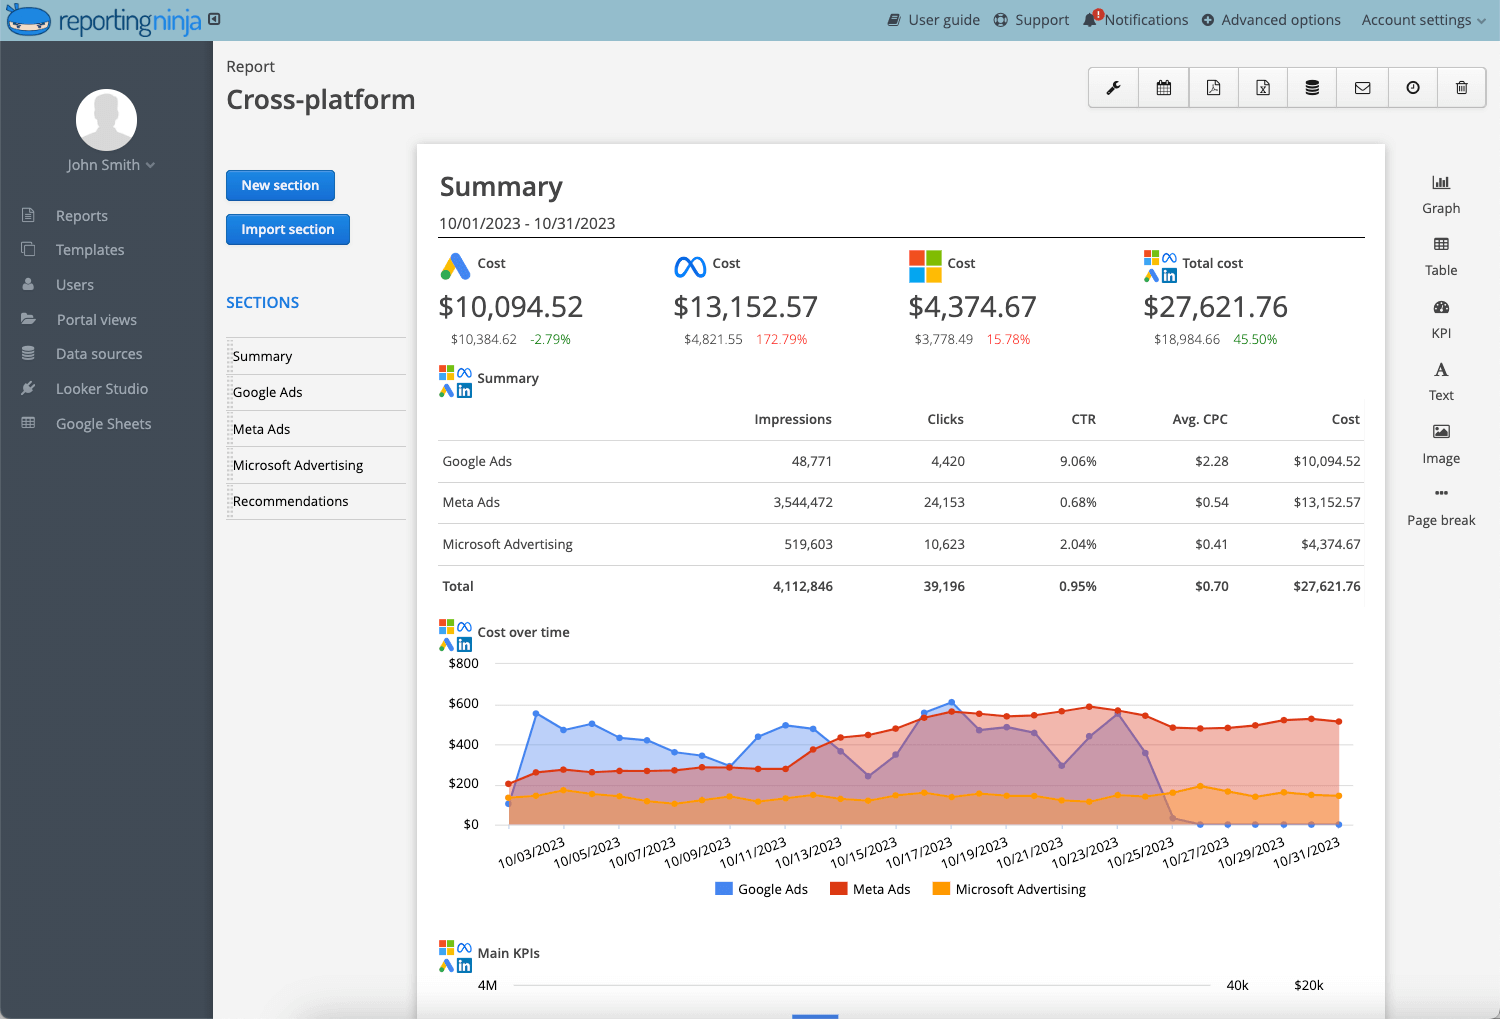
  • Which channels generate the most qualified leads
  • Which campaigns have the lowest CPA
  • How performance changed month-over-month
  • Where budget should increase or decrease
Pro Tip: Start with the decision the report should support. If the client needs to know where to invest next month, lead with cost, conversion, and revenue metrics. Everything else is supporting detail.

Most reports fail not because of bad data but because they lack a clear goal. Define the question first.

Step #2: Connect your marketing data sources 

Once the goal is clear, identify every platform contributing to the result you want to measure. For most cross-channel reports, this means a mix of:
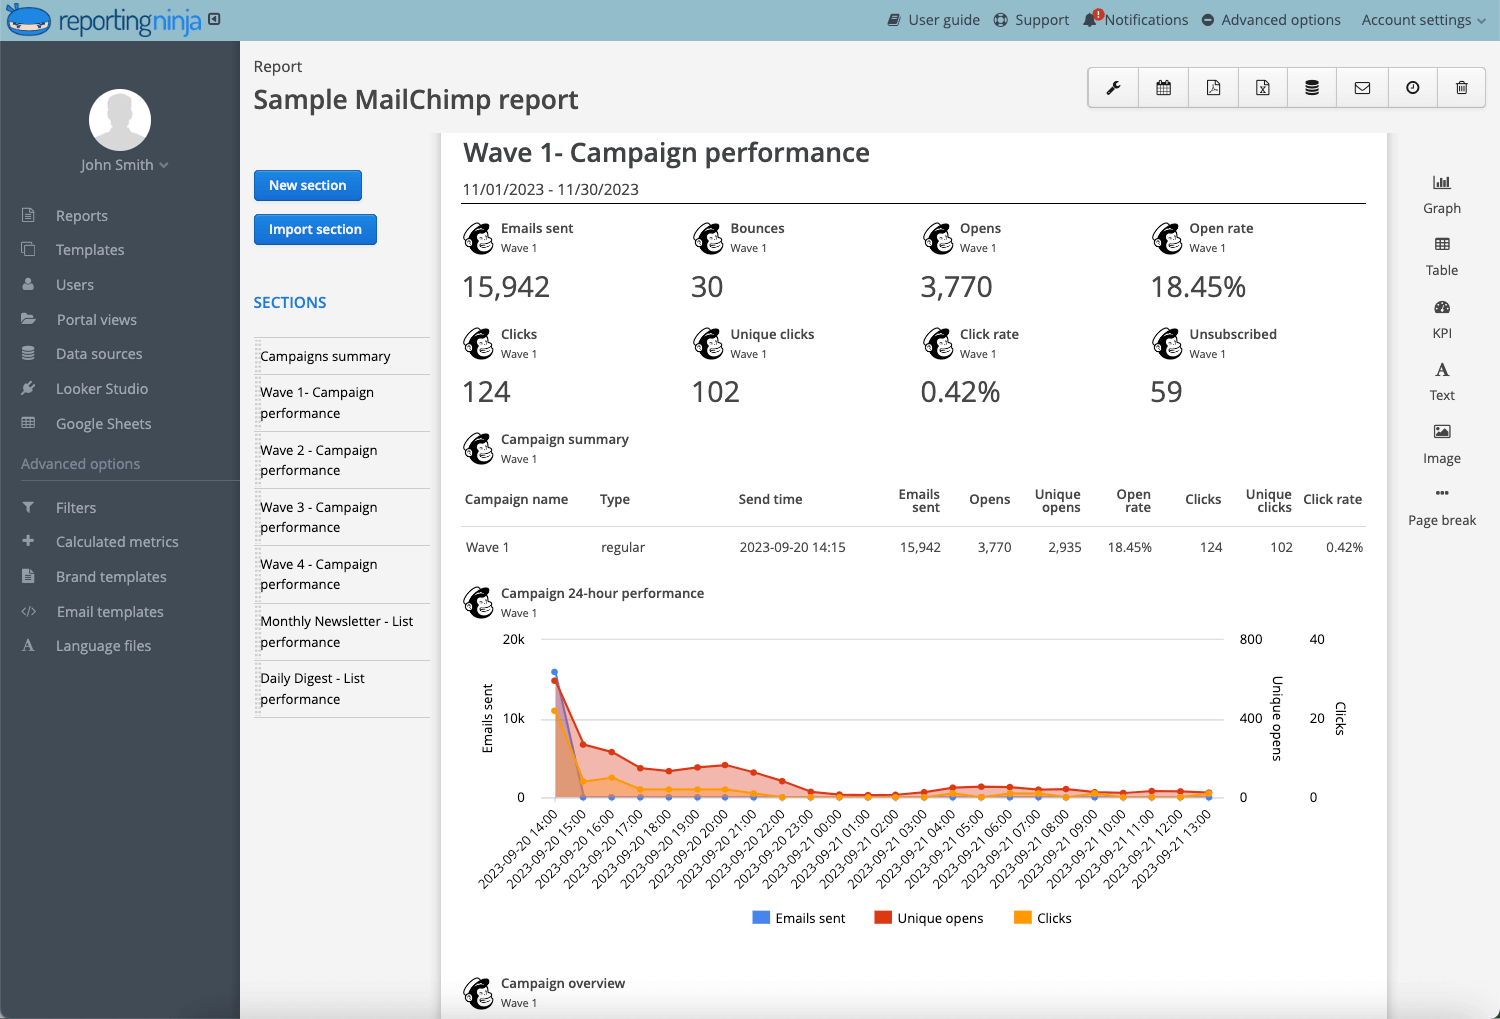
The key is to avoid reporting each source in isolation. A Google Ads dashboard shows campaign performance inside Google Ads; it won't show the full picture across paid social, organic, and email. 

Understanding marketing data integration is essential here. With Reporting Ninja, you can pull all these sources into a single report instead of exporting CSV files and rebuilding charts manually each month.

Common Mistake: Connecting data sources before agreeing on the report structure. This leads to messy dashboards with too many widgets and no clear story.

Step #3: Choose the right cross-channel marketing metrics 

Don't track every available metric. Focus on the numbers that explain performance, cost, and outcomes.

For most reports, that means a mix of:

  • Visibility: Impressions, reach
  • Engagement: Clicks, CTR
  • Behavior: Sessions, bounce rate, time on site
  • Conversions: Leads, purchases, sign-ups
  • Efficiency: CPA, CPL, ROAS
  • Revenue: Pipeline value, order revenue

The strongest reports separate primary KPIs from supporting metrics. For an ecommerce report, ROAS might be the headline number (while CTR and conversion rate explain why it went up or down). Check our breakdown of how to analyze marketing data for a deeper look.

Red Flag: If every metric has equal visual weight, the report becomes hard to read. Put the main KPI at the top. Use supporting metrics to explain it.

Step #4: Build a clean report layout 

Organise your metrics into a report that shows the main result first, then explains what caused it.

A simple structure that works well:

  1. Executive summary—the main result and recommendation
  2. Channel overview—performance by source
  3. KPI section—conversions, spend, CPA, ROAS, revenue
  4. Campaign-level breakdowns—for deeper analysis
  5. Trend charts—performance over time
  6. Recommendations—next steps tied to the data

Keep the layout consistent from one report to the next. This makes it easier for clients, managers, or stakeholders to understand performance without relearning the report every month. 
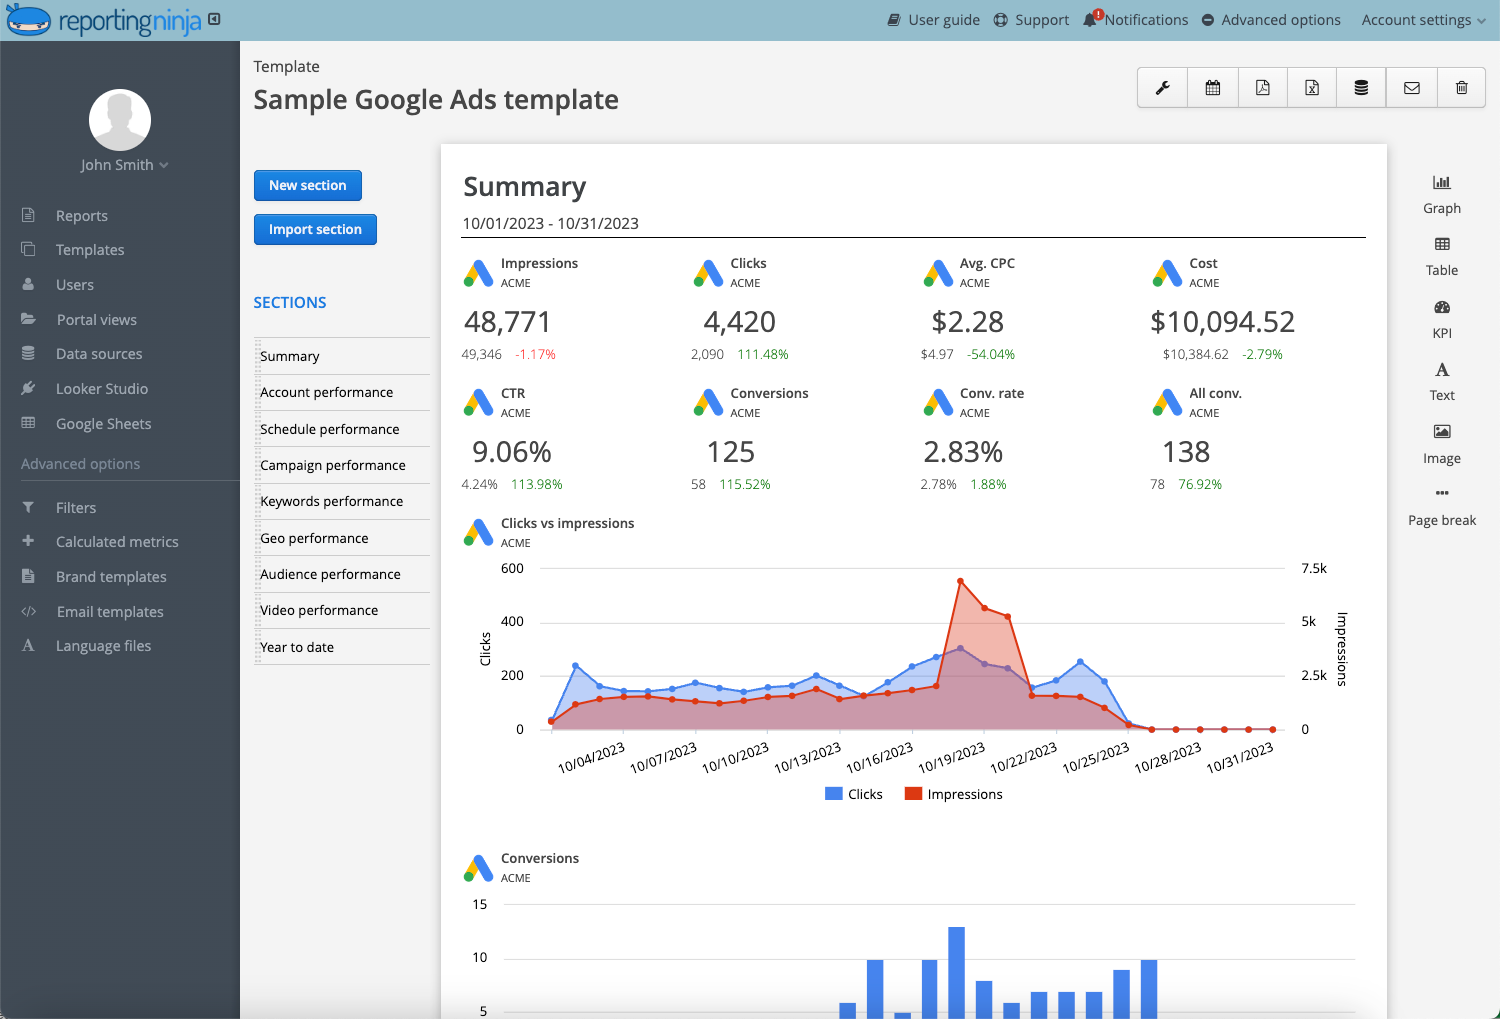
Did You Know? Reporting Ninja lets you build reusable report templates following the same structure across all clients, with custom data sources, branding, and metrics for each.

Step #5: Review, automate, and improve the report 

A cross-channel report is most valuable when it's consistent, repeatable, and tied to actual decisions.

Before sending any report, check that:

  • All data sources are connected and updating
  • Date ranges match across every platform
  • Channel and campaign names are consistent
  • The main KPI is visible within the first few seconds
  • Recommendations are tied to the numbers

Then automate. 

Manual reporting creates outdated numbers, broken formulas, and inconsistent formatting. With Reporting Ninja, you can schedule recurring reports, automate data refreshes, and deliver client-ready dashboards without rebuilding from scratch. 

For agency teams, white-label marketing tools and PPC reporting software make this even faster.

Pro tip: Always add a short written summary. Charts show what happened; your analysis explains why it matters and what to do next.

{{cta-block-v1}}

3 examples of cross-channel marketing reports 

Here's how the same reporting framework adapts to three different use cases.

Paid media performance report 

This report compares results across Google Ads, Meta Ads, LinkedIn, and TikTok. It covers spend, clicks, conversions, CPA, ROAS, and campaign-level performance, so you can see which platform is driving the cheapest leads or the strongest revenue.

It's most useful when the budget is split across multiple ad platforms, and you need to decide where to increase or pull back. Include notes on audience, creative, and landing page performance to explain the numbers, not just report them

Ecommerce revenue report 

This report connects traffic, ad spend, orders, revenue, and ROAS across every active channel: paid search, paid social, organic, email, affiliates, and referrals.

The goal isn't just to show who's sending traffic; it's to show who's converting it. Meta Ads might dominate top-of-funnel, while Google Shopping or email drives higher purchase intent. Include AOV, conversion rate, CAC, and revenue trends to give a complete picture of profitability.

Client-facing agency report 

This report turns raw performance data into a clear story for the client. It typically includes:

  • A short executive summary
  • Channel-by-channel performance
  • Campaign highlights
  • Budget and efficiency metrics
  • Month-over-month comparisons
  • Clear next steps

Clients don't need every metric from every platform. They need to know if performance is improving, which channels are leading, and what happens next.

How to simplify cross-channel marketing reporting with Reporting Ninja 

Reporting Ninja brings your data sources, report templates, dashboards, and scheduled delivery into one workflow. Here's how it works in practice:
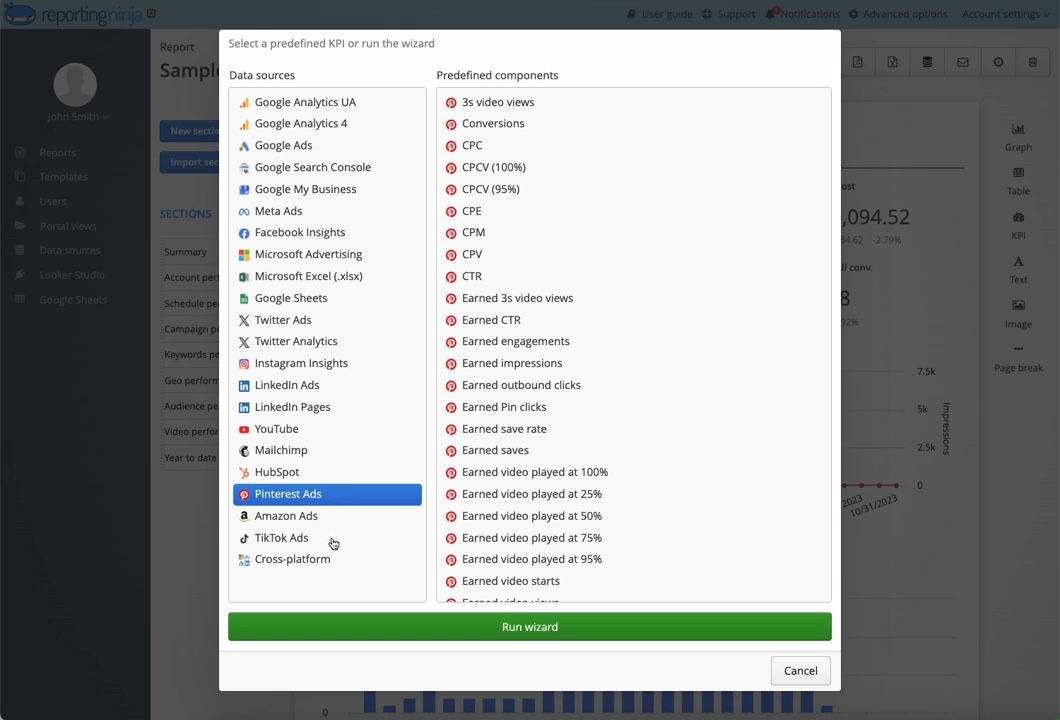
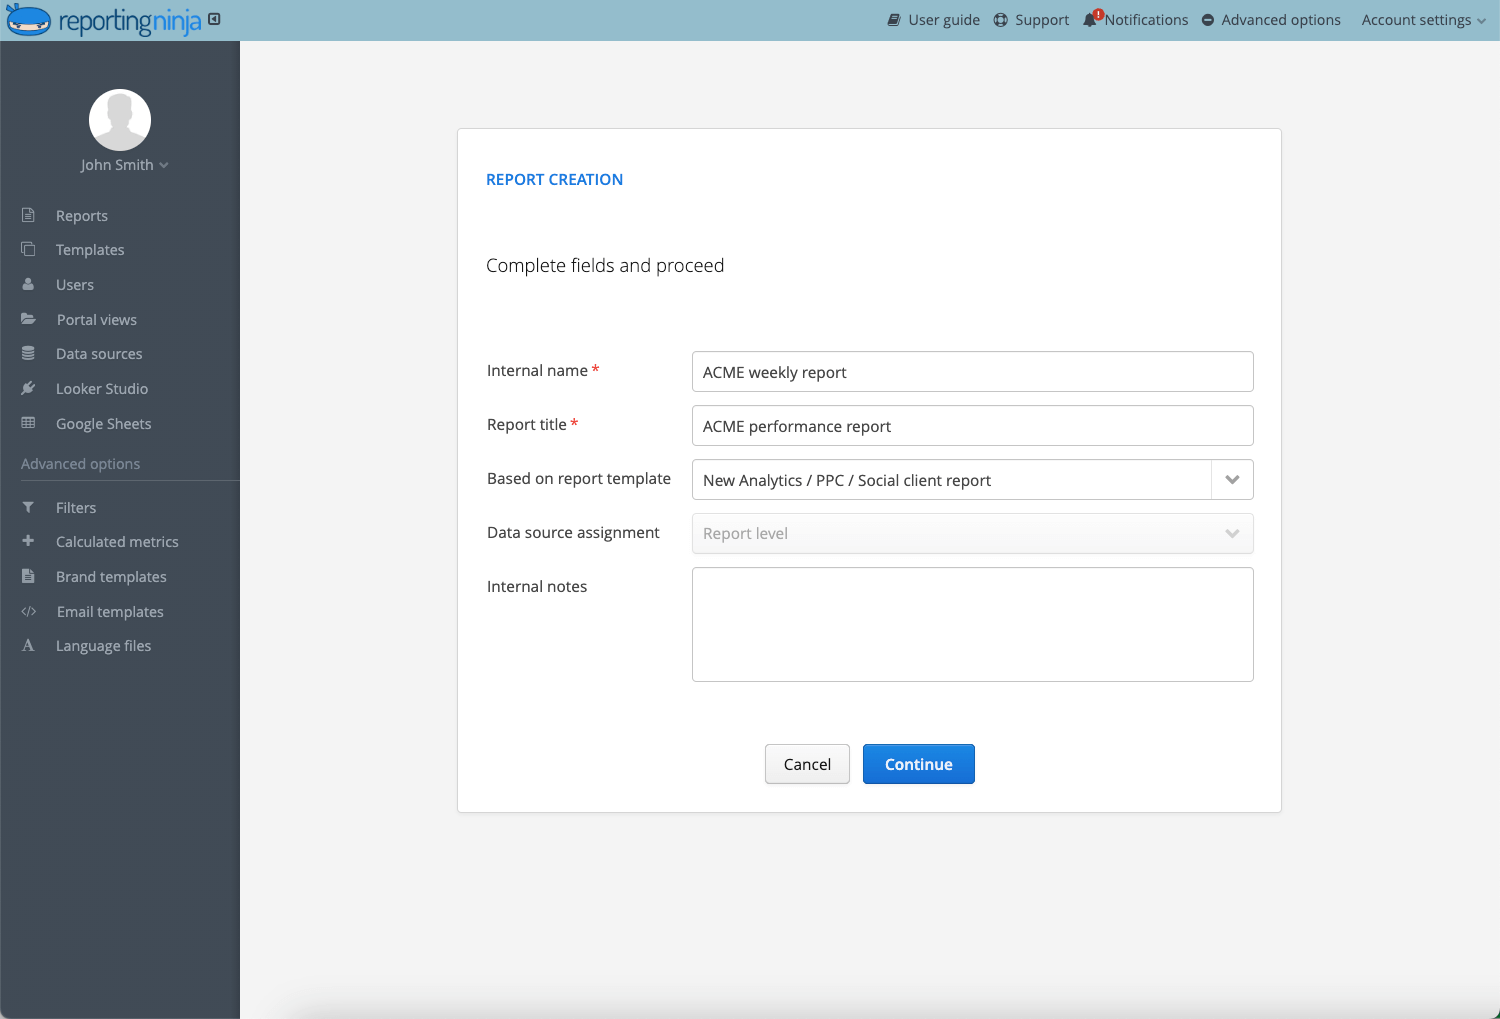
  • Connect your marketing platforms: Link your ad platforms, analytics tools, ecommerce platforms, and SEO tools. Reporting Ninja pulls everything into one report: no exports, no manual copy-paste. 
  • Build a reusable template: Create a report structure that matches how you present performance: KPI summary, channel breakdown, campaign table, trend charts, and written notes. Once it's built, reuse it across every client.
  • Customize per client or campaign: Adjust metrics, sections, branding, and data views per client. You get consistency without generic, one-size-fits-all dashboards.
  • Automate updates and delivery: Schedule recurring reports so dashboards stay current without manual rebuilding each cycle. Useful for weekly updates, monthly reviews, and client-facing summaries. Works especially well for ecommerce reporting and SEO reporting.
  • Add context before sharing: Automation handles the data. Your analysis adds the value. Add a short summary explaining what changed, why it matters, and what should happen next.

{{cta-block-v1}}

Reporting Ninja vs other cross-channel reporting methods 

Feature Manual reporting Reporting Ninja
Data integration Manual exports from each platform into spreadsheets or slide decks Connects multiple sources into one unified reporting workflow
Time required High—reports need rebuilding weekly or monthly Low—templates, data refreshes, and recurring reports are automated
Automation Limited to spreadsheet formulas or separate tools Built-in automated updates and scheduled delivery
Client reporting Requires extra formatting, screenshots, and manual commentary Client-ready dashboards with reusable, branded layouts
Real-time updates Difficult—exported data goes stale quickly Reports stay fresh with connected, auto-refreshing data sources

Set up cross-channel marketing reporting in minutes with Reporting Ninja 

Cross-channel reporting shouldn’t take hours of exports, spreadsheet cleanup, and manual chart building.

With Reporting Ninja, you can connect your marketing platforms, build reusable report templates, automate updates, and deliver clearer reports to clients or stakeholders without rebuilding the same dashboard every reporting cycle.

Use it to create reports that show what happened, why it matters, and where to focus next.

Start your free 15-day trial today.

FAQs

What is cross-channel marketing reporting?

Cross-channel marketing reporting is the process of combining performance data from multiple marketing platforms into one unified report for clearer analysis and decision-making.

How often should you update cross-channel marketing reports?

Weekly or monthly works for most teams, depending on campaign velocity, budget size, and client or stakeholder reporting needs.

What is the difference between cross-channel and multichannel reporting? 

Multichannel reporting tracks performance on each platform separately. Cross-channel reporting combines that data into one view, so you can compare channels and see how they work together. 

How does cross-channel marketing automation improve reporting? 

Automation keeps campaigns running consistently across channels. Reporting on those campaigns in one place lets you see which touchpoints convert, where to adjust spend, and how the full funnel performs together. 

Elevate your marketing reports to the next level

Sign up for a 15 days free trial. No credit card required.

Instagram custom report
Fran Sánchez