Social
July 14, 2026
Automated social media reports: how to, tools, & more


Automated social media reports eliminate the repetitive work of exporting CSVs from multiple platforms and turning them into client-ready dashboards.
Instead of spending your whole day pulling data from different ad managers, you can connect your accounts once and let reports refresh and deliver automatically. The goal is to save time and make reporting consistent such that adding another client doesn't add another reporting day to your month.
In this guide, you'll learn why automation matters, which platforms and report types to prioritize, how to set everything up, and which tools can automate the process.
Manual reporting wastes hours you could spend on strategy, and it becomes harder to scale as your client list grows. With automated reporting, your workweek improves in the following ways:
According to Asana's Anatomy of Work Index, knowledge workers spend 58% of their workday on "work about work"—coordinating tasks, searching for information, switching between apps, and other administrative work instead of high-value work. Manual social media reporting is a perfect example of this. Instead of analyzing campaign performance or refining strategy, marketers spend hours collecting data from multiple platforms like Meta Ads Manager, LinkedIn Campaign Manager, and TikTok Ads and formatting it into client-ready reports.
Automating those repetitive steps frees up time for the parts clients actually value most, such as concise summaries, recommendations, and strategic insights.
When you manually copy metrics into a spreadsheet, small differences may show up across reports. Mismatched date ranges, missed platforms, or inconsistent filters can all lead to reports that tell different stories.
Automated dashboards eliminate many of those issues by pulling the same data fields, using the same reporting periods, on the same schedule every time.
Shared templates and standardized reports help multiple account managers measure performance the same way, making it easier to compare results across clients without second-guessing whether the data actually lines up.
Automation handles the repetitive work of collecting and formatting data, making more frequent reporting practical when it's needed. Rather than forcing every client into the same reporting schedule, you can match your cadence to campaign activity, stakeholder preferences, and business goals.
With manual reporting, every new client means another few hours of collecting and formatting data, so growth forces you to either hire more people or overwork your team.
Automated dashboards break that cycle. Once the integrations and templates are set up, adding a new client is a one-time setup rather than a recurring weekly cost. This lets small teams handle more accounts without the reporting load climbing at the same rate.
Most agencies and freelancers report on a core set of platforms, though the exact combination depends on where a client's audience actually spends time. Here's what each one typically contributes to a report.
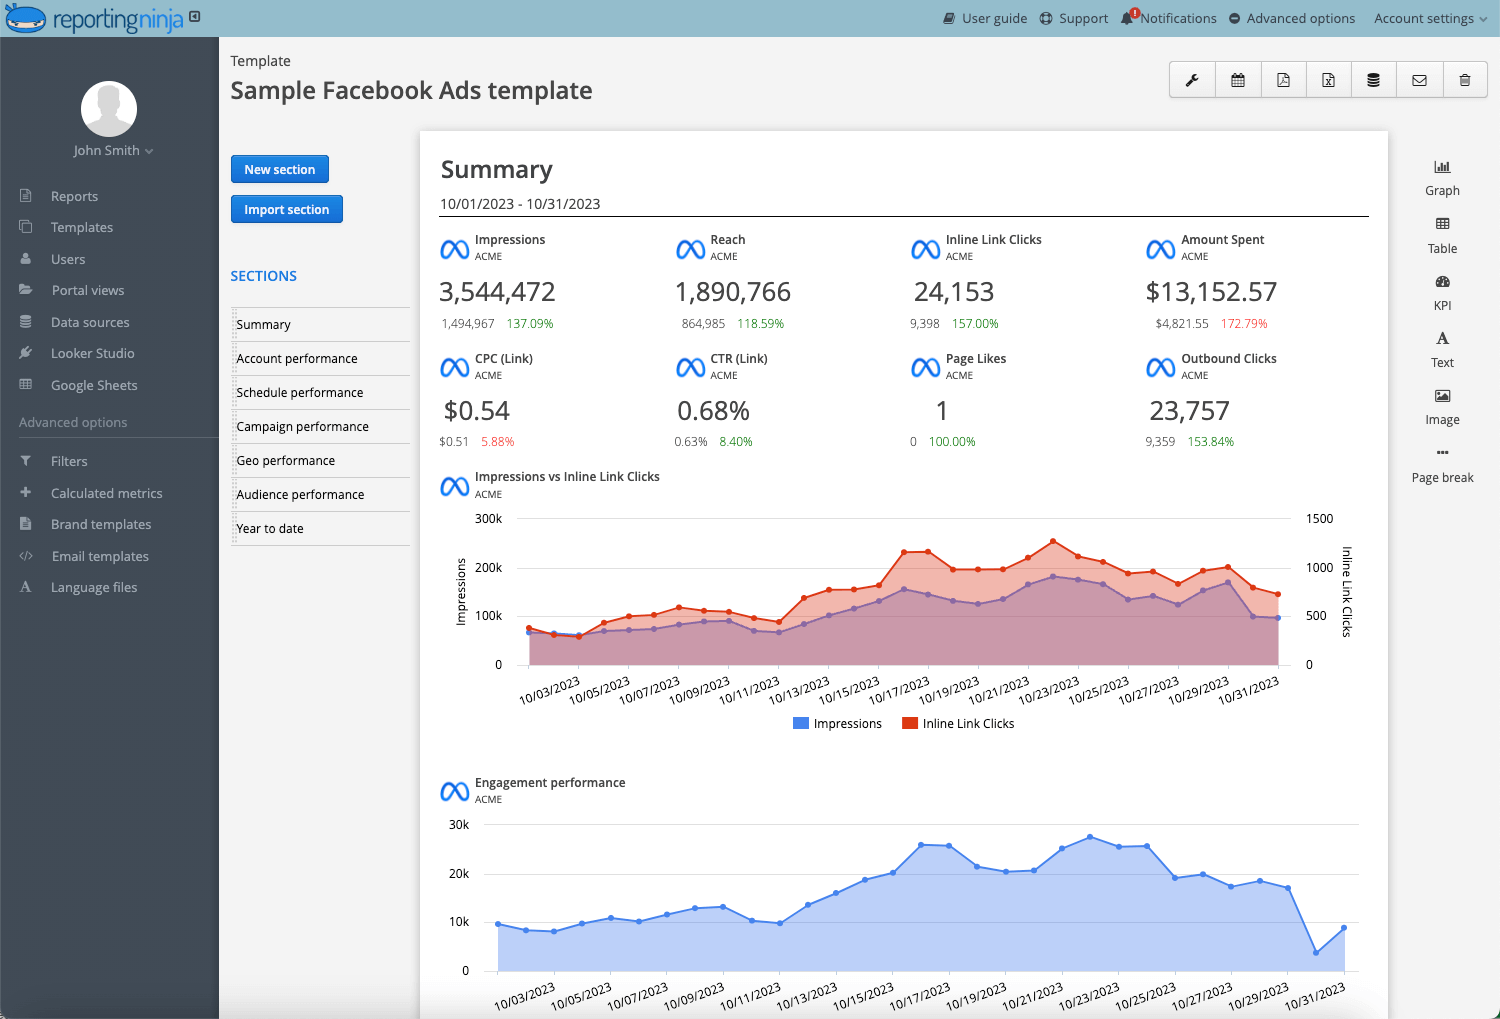
Meta reporting usually covers organic performance (reach, engagement, and follower growth) from Facebook Ads and Instagram Insights and paid performance (spend, CPC, and ROAS) from Meta Ads. Most clients want both in the same report, since organic and paid content often run side by side on the same pages.
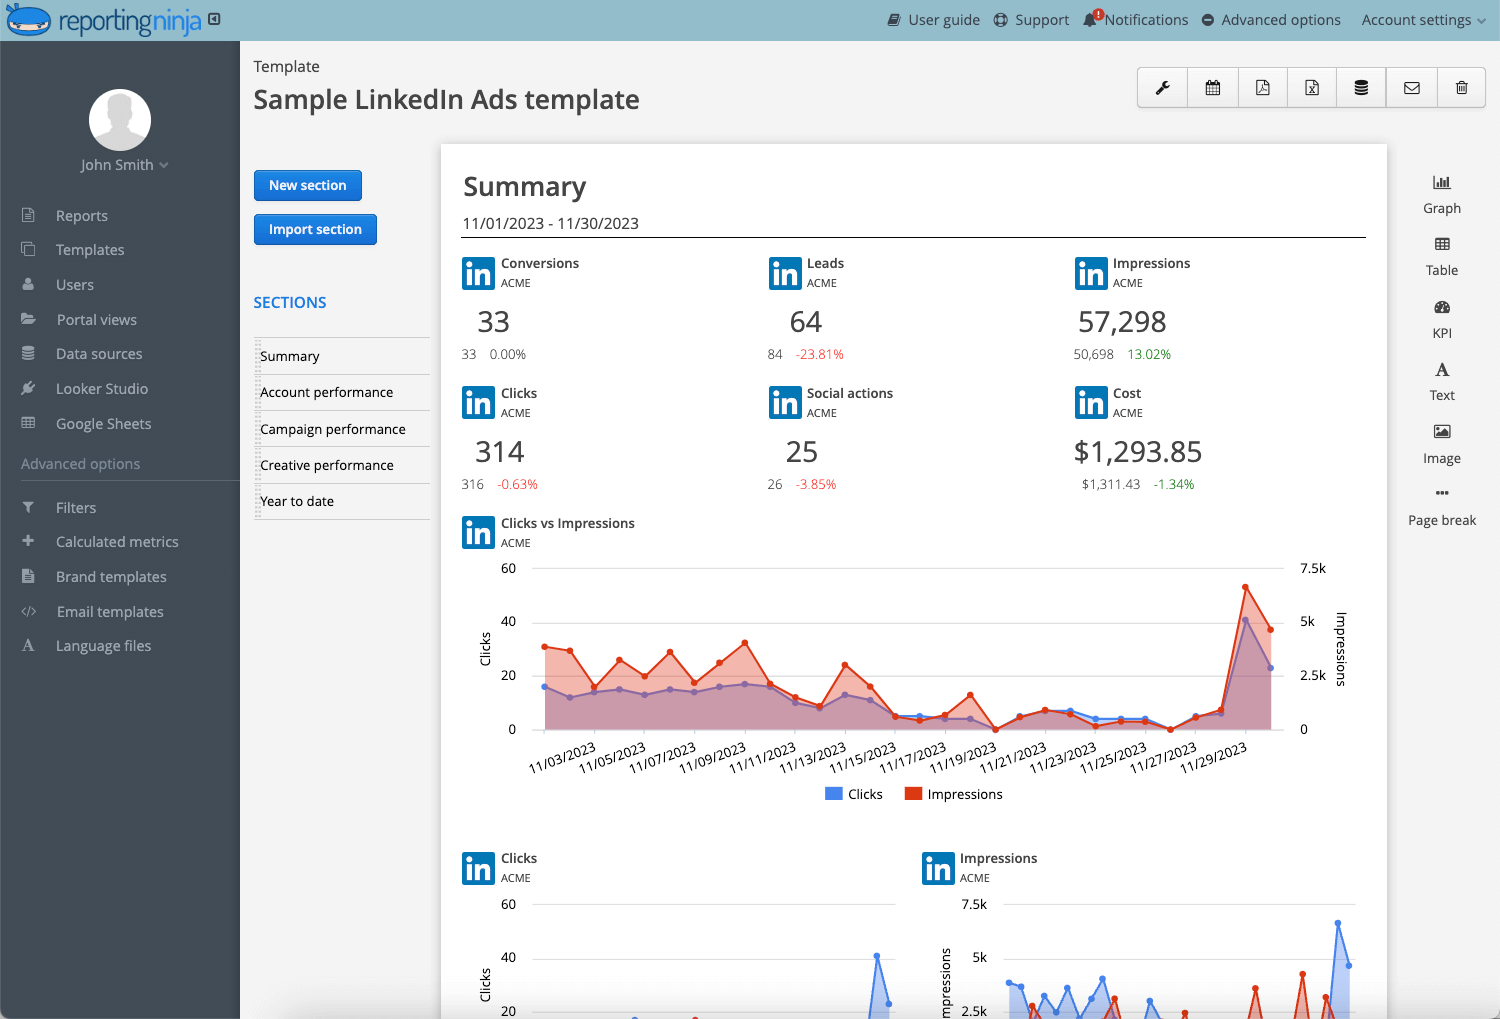
LinkedIn reporting matters most for B2B clients and centers on page followers, post engagement, and, if they're running ads, cost per lead and click-through rate. You can track both LinkedIn Ads and organic Page performance from the same connected account.
Want a repeatable way to organize LinkedIn audience and engagement data? Try a Linkedin analytics report template.
Success on LinkedIn is often measured by lead quality rather than audience size. For example, a company generating 40 demo requests from a LinkedIn campaign may consider it a stronger result than reaching 100,000 people on Facebook, none of whom contribute to the pipeline.
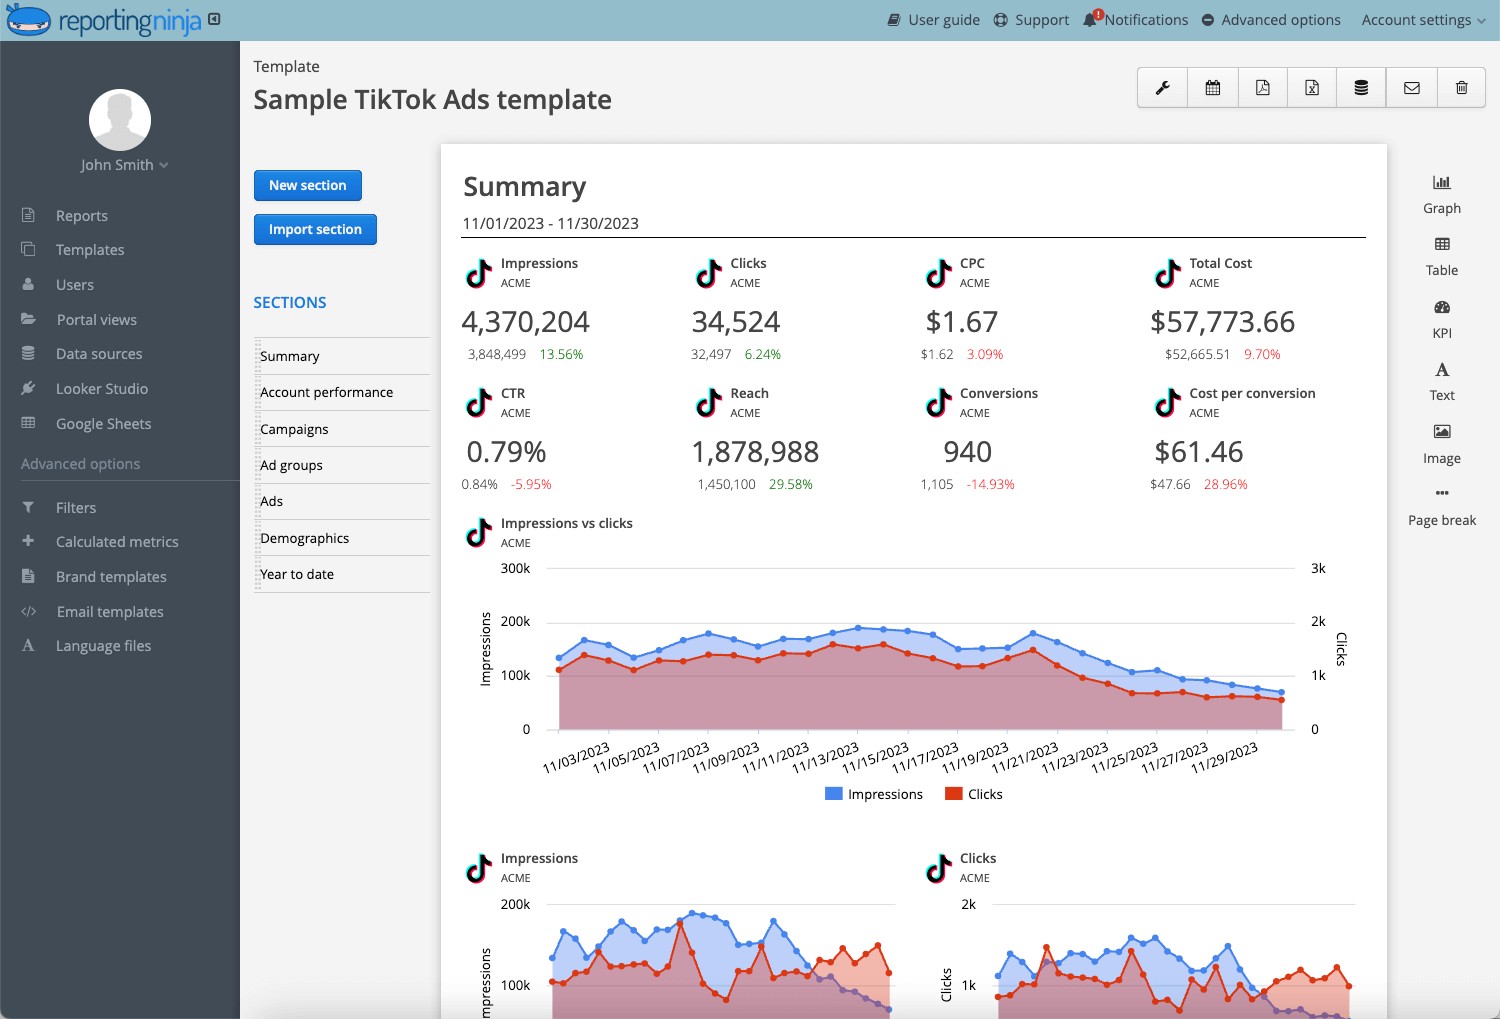
TikTok reporting should separate organic video performance (views, average watch time, shares) from TikTok Ads (spend, CPM, conversions), since they often support different goals.
TikTok frequently generates strong awareness and engagement at the top of the funnel, but users may convert later through another channel, making its direct conversion numbers look weaker than its overall business impact. Reporting TikTok alongside broader customer journey or cross-platform data provides a more complete picture of its contribution.
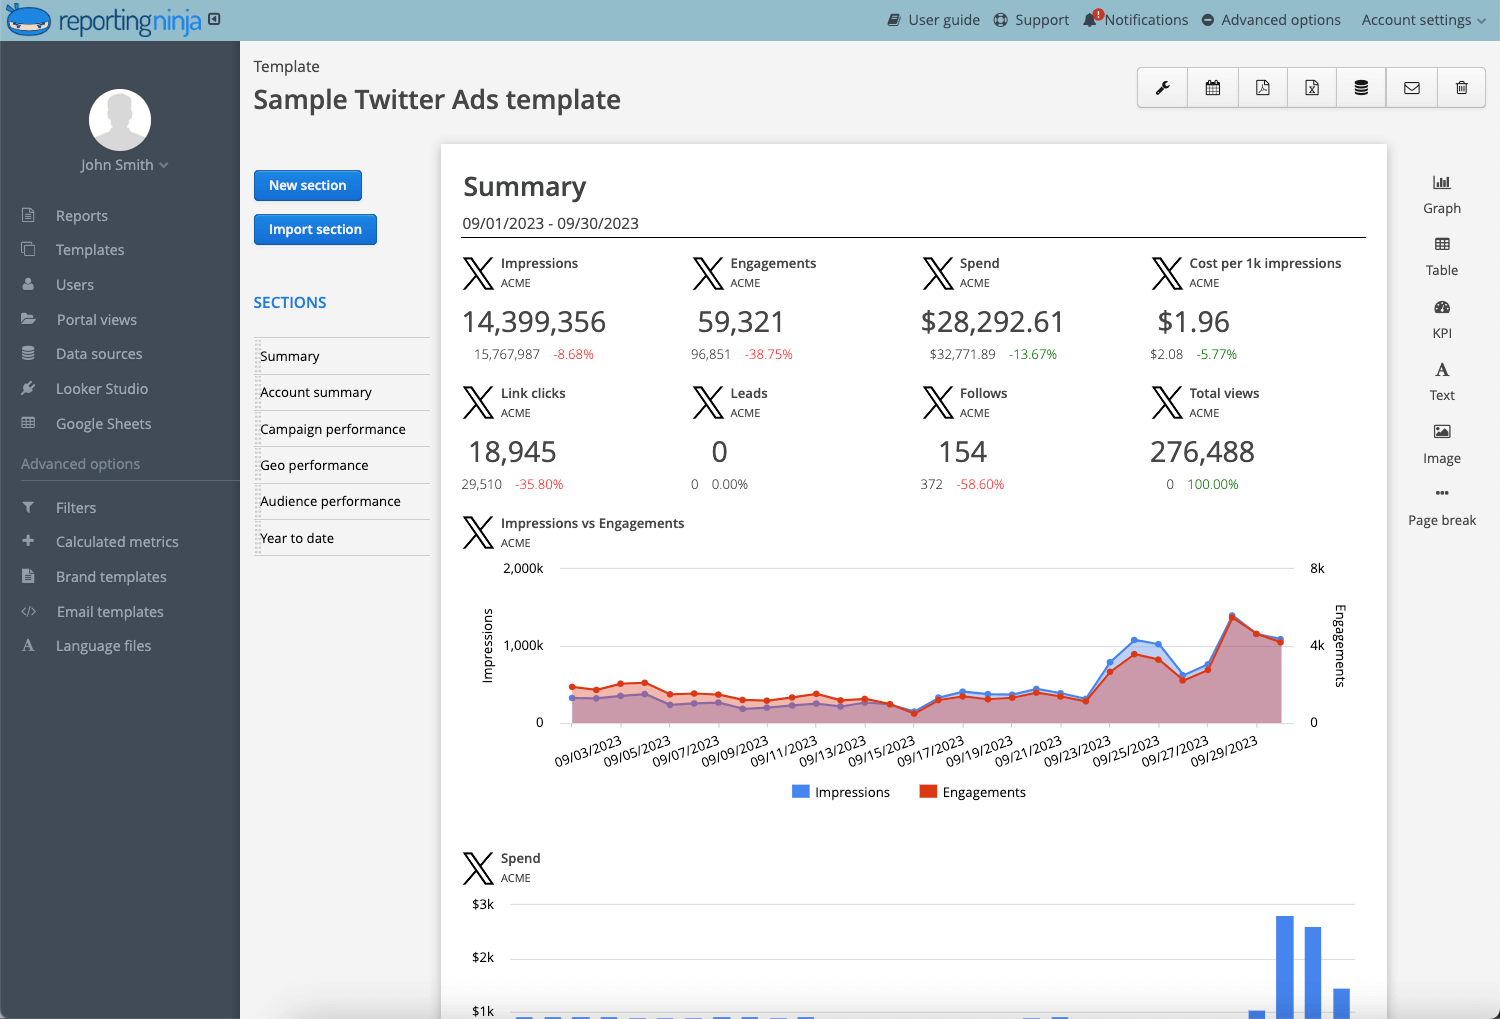
X reporting is usually the smallest section of a social report unless a client runs an active ads program there. Organic metrics (impressions, engagement rate, follower growth) still matter for brand monitoring and customer service visibility, even for clients who aren't posting daily.
Pulling X Ads and X Analytics into the same dashboard as your other platforms avoids the need to log into a separate account just to check spend.
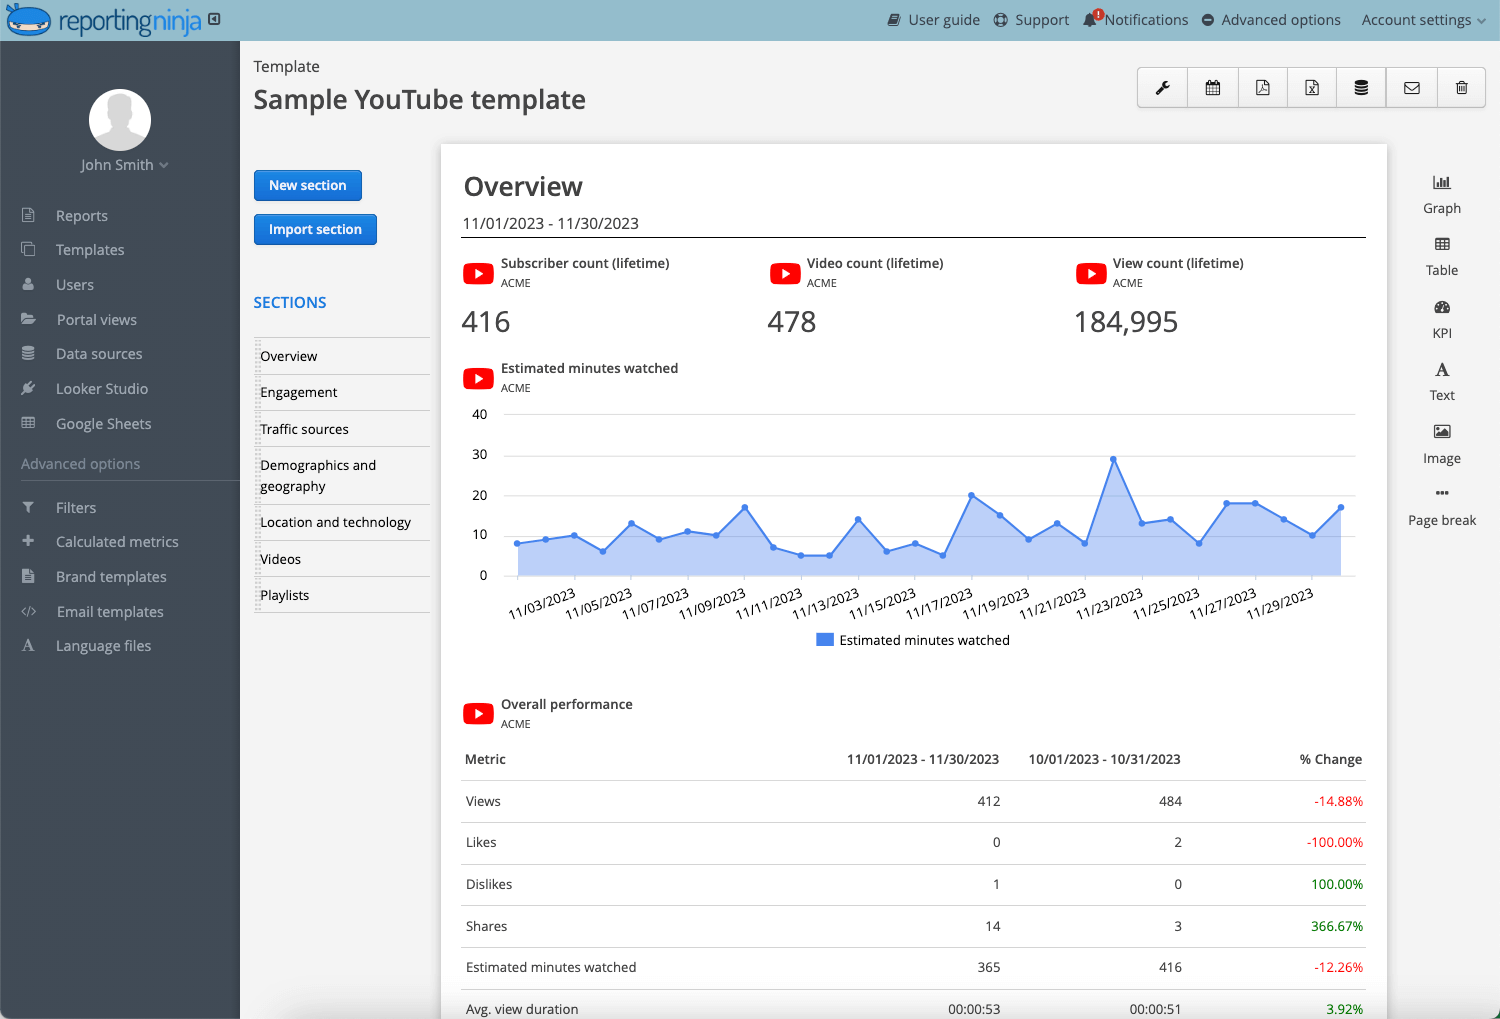
Unlike short-form social platforms, YouTube content often compounds over time as older videos continue attracting views through search and recommendations. Instead of focusing only on recent uploads, compare long-term trends such as watch time, subscriber growth, and top-performing evergreen videos to understand sustained performance.
{{cta-block-v1}}
The best report is usually the one that helps its audience make decisions. Here's how the most common formats differ and when to use each one.
Organic reports track reach, engagement, follower growth, and post-level performance without touching ad spend. They're the right starting point for clients who are focused on brand building or community management rather than direct-response advertising.
Paid reports focus on spend, cost per click, cost per result, and return on ad spend across Meta Ads, LinkedIn Ads, TikTok Ads, and X Ads. Clients running any kind of budget want this separated from organic metrics, since mixing the two makes it harder to judge whether the spend is actually working.
Cross-platform comparisons are most useful when comparing business outcomes rather than identical metrics. They place organic and paid data from every connected platform side by side so a client can see at a glance which channel is driving the most engagement or the least cost per result.
They're especially useful heading into a quarterly budget conversation when the client is deciding where to shift spend next. If you're also reporting on search spend, an SEM report example shows how the same side-by-side format works for paid search.
White labeling is about more than swapping in a logo. Consistent layouts and terminology help clients recognize trends faster, because every report follows the same structure month after month. Automation benefits this format more than any other, since the branding and scheduling only need to be set up once.
Setting up automated reporting usually takes less time than people expect. The real work lies in deciding what to report, how to structure it, and when to deliver it.
Before automating anything, list every metric you currently share with a client and where it comes from. This step usually reveals metrics you're including out of habit that nobody actually reads and gaps you've been meaning to add but haven't had time for.
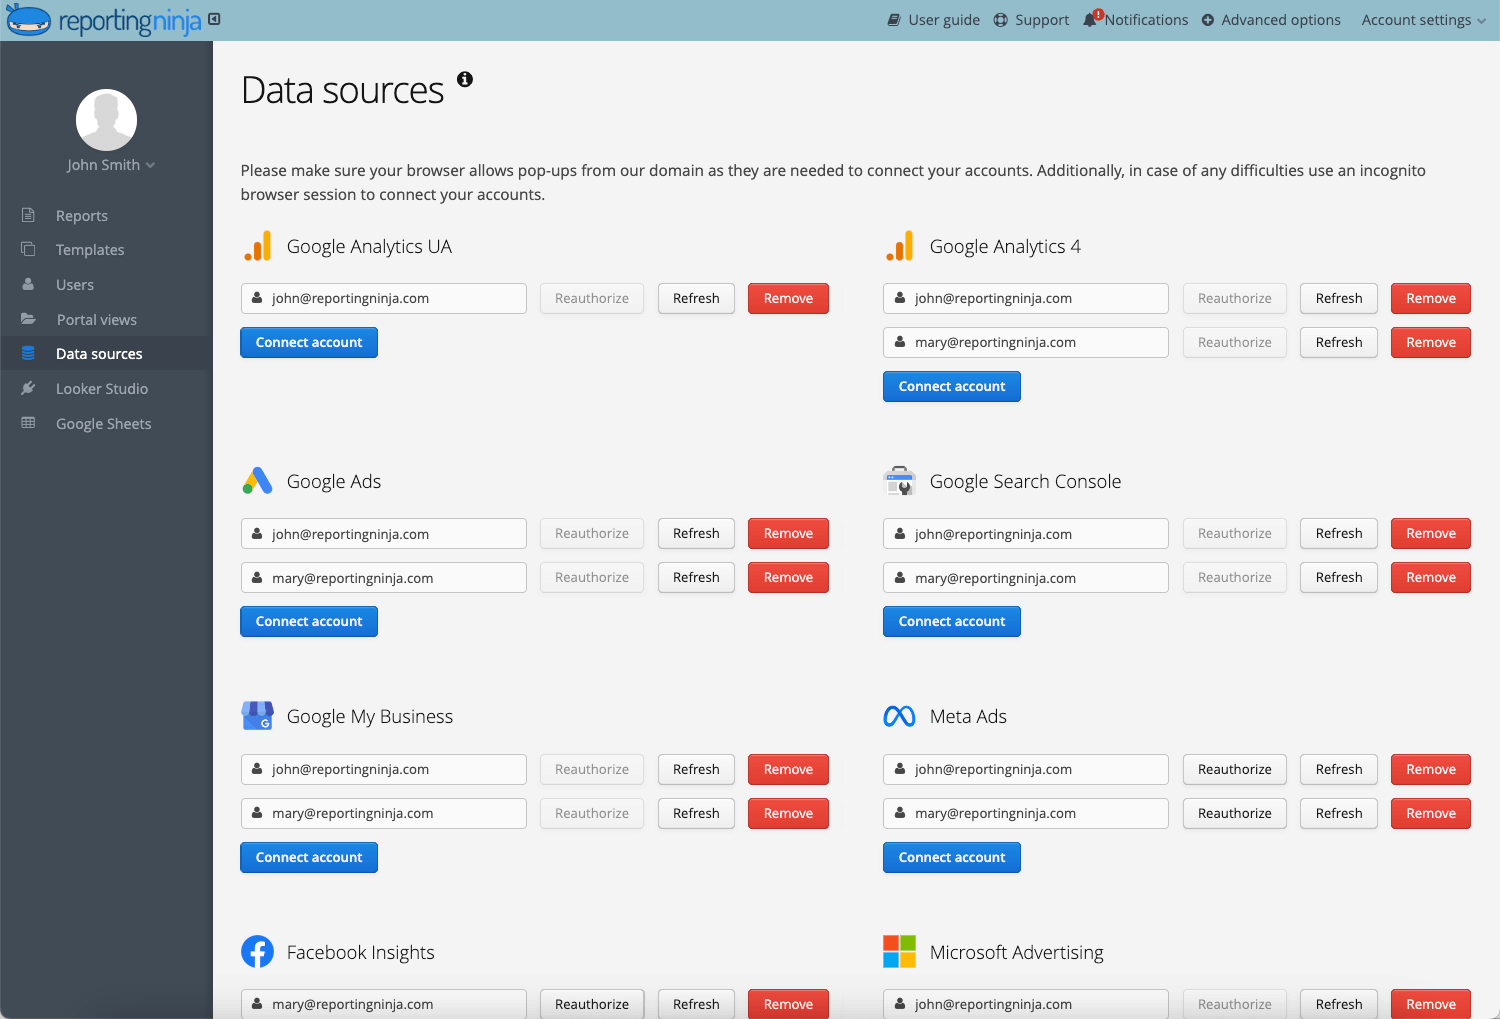
Link each platform's account (Meta, LinkedIn, TikTok, X, and any others in scope) to your reporting tool through its native integration. Most tools authenticate through the platform's own login, so you're not handing over passwords, just granting read access to the data.
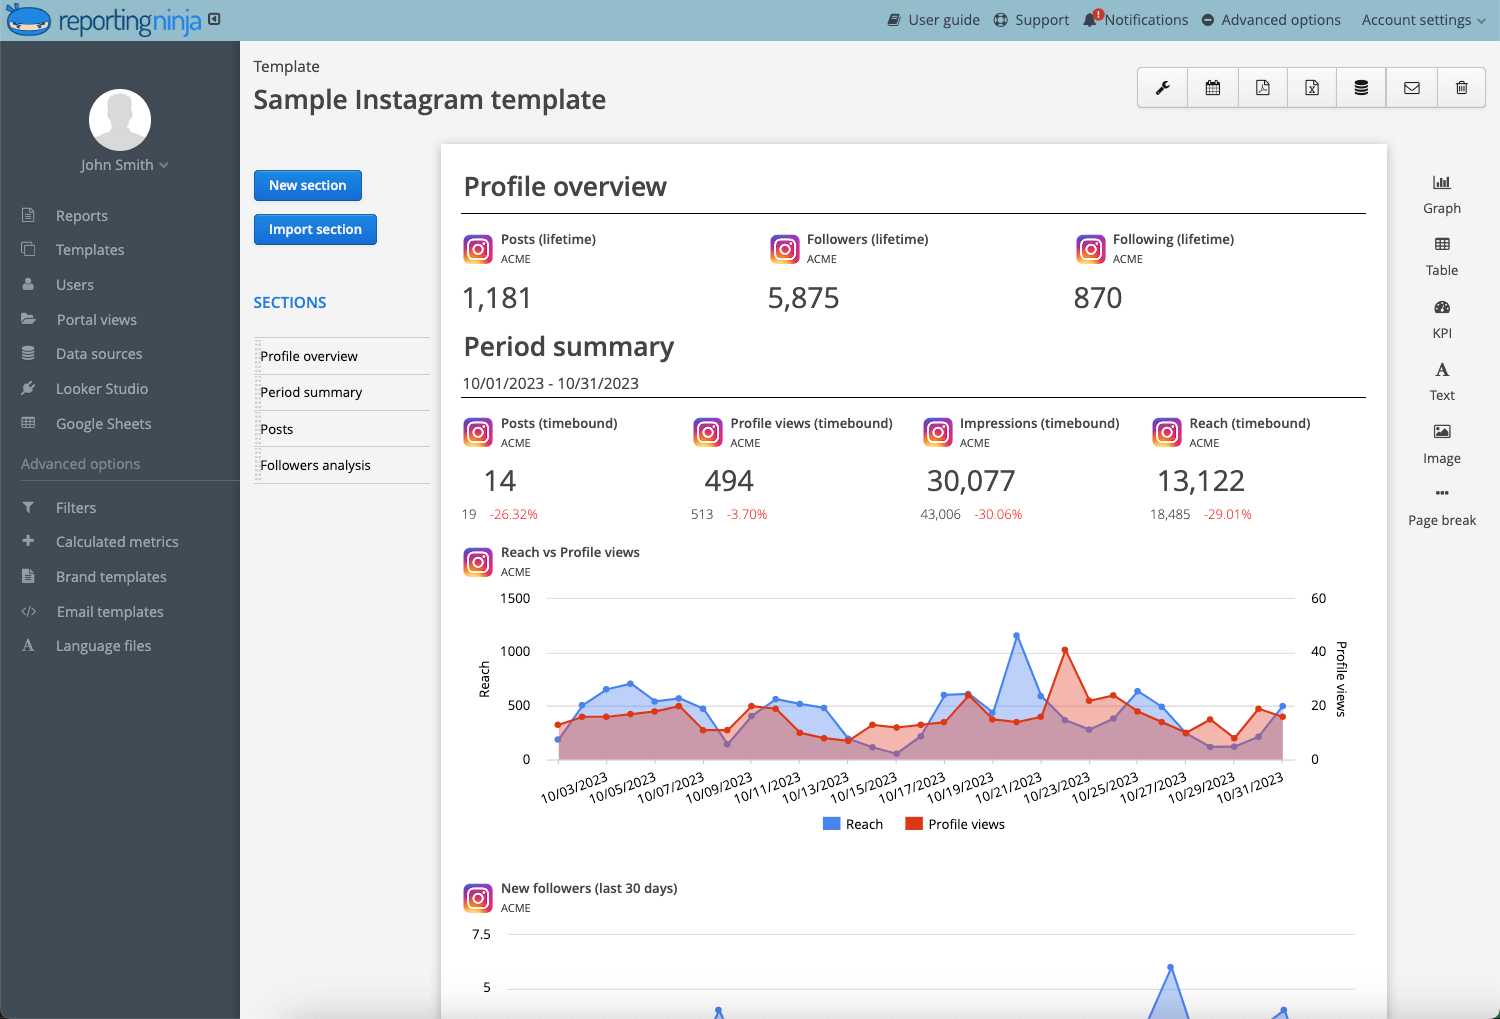
Start from a pre-built template for the report type you need (organic, paid, or cross-platform), then adjust the metrics and layout to match what the client actually asked for. Building from a template instead of a blank canvas is usually the difference between a 20-minute setup and a multi-hour one.
Focus the template on the metrics that drive a client decision, not on however many fields the platform happens to expose.
Decide how often the report needs to reach the client (weekly, biweekly, or monthly) and set that cadence once inside the tool. Most platforms let you schedule delivery as a PDF, an email, or access to a live client portal, so pick whichever matches how that specific client prefers to review data.
Automation handles the data collection, but it can't explain why the numbers changed. Before sending a report, spend a few minutes reviewing unusual results and adding brief context where needed. For example, if Meta ad spend doubled because of a planned product launch, a one-line annotation prevents clients from assuming the increase was accidental.
Once you've identified the reports worth automating, test the workflow with a single client before rolling it out across your entire portfolio. Reporting Ninja makes this easy with its custom reports platform, Looker Studio connectors, and Google Sheets add-on, REST API, and marketing data MCP all included in every plan.
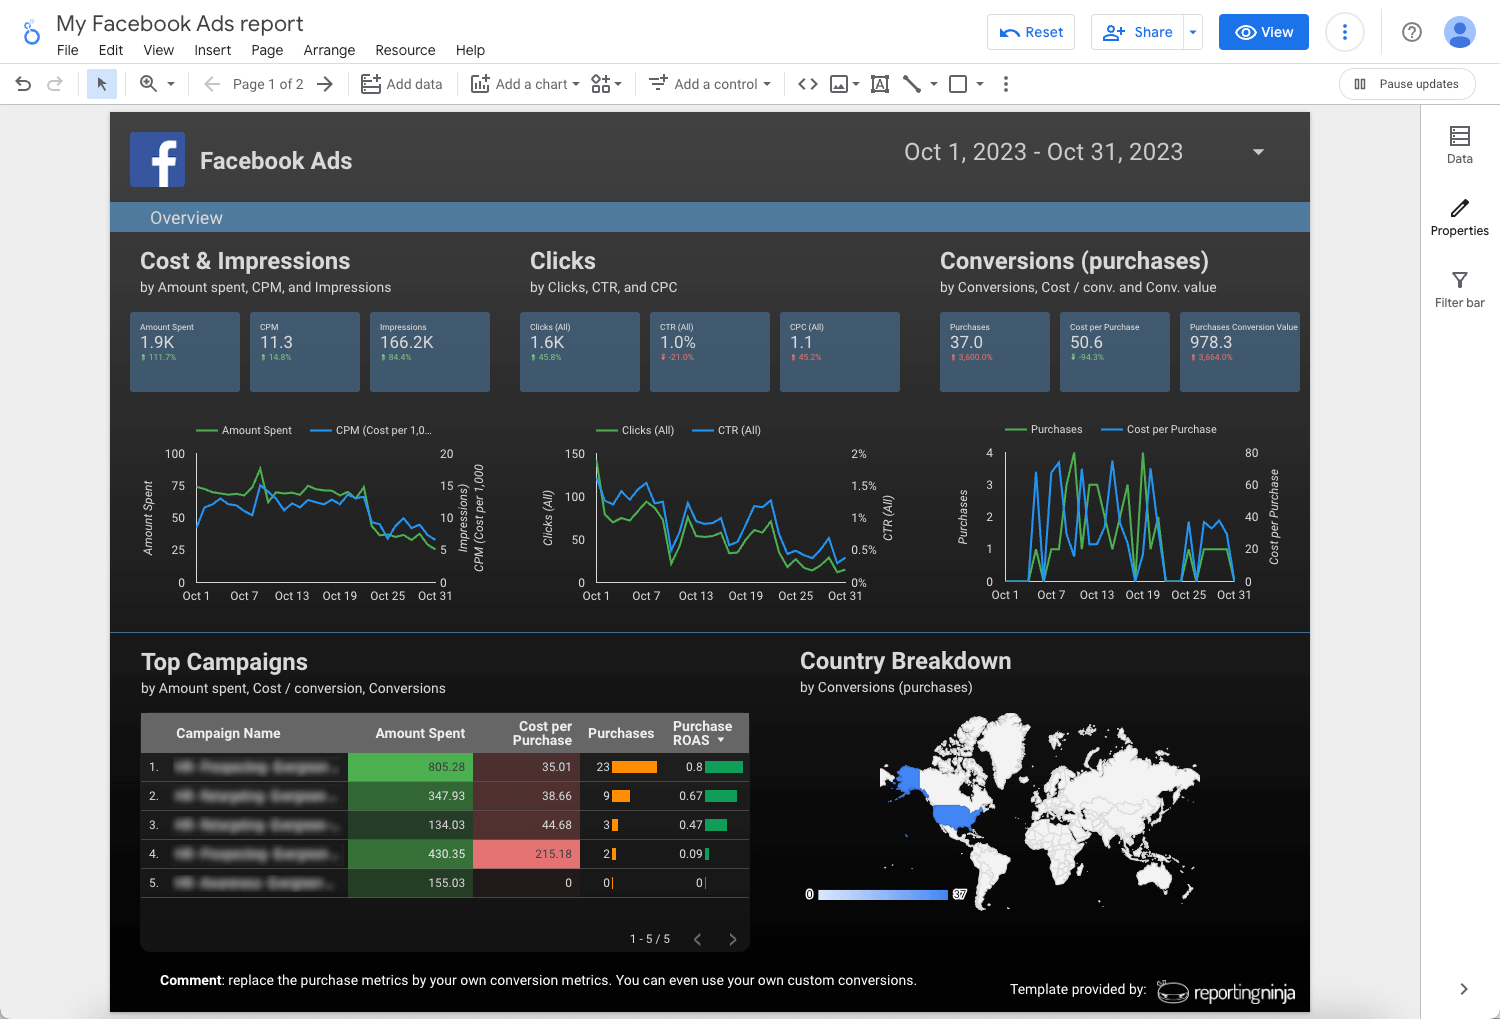
Setting up automation is the easy part. Keeping it accurate and useful over time takes a few habits that stop small problems from reaching your clients.
Organic and paid performance answer different business questions, and blending them in the same section makes it harder for a client to tell what their budget is actually buying. If clients regularly compare paid and organic performance, include a combined executive summary, but keep the detailed breakdowns separate further down the report.
If every client's report tracks a different set of metrics, you lose the ability to reuse templates or spot patterns across your book of business. Pick a core metric set per platform and only add client-specific KPIs on top of that baseline.
A weekly report that nobody opens is wasted automation. Check open rates or portal logins periodically and scale back the cadence for clients who only engage with the monthly summary, so your reporting effort matches actual demand.
Stakeholders have a tendency to stop reading reports when they receive more data than they can act on. Matching reporting frequency to decision-making cycles leads to more engagement than simply increasing report volume.
Automated reports depend on platform connections staying active. Expired authentication tokens, API changes, or renamed campaigns can interrupt data collection without immediately being obvious. Schedule a quick monthly review to confirm your integrations are syncing correctly before reports go out automatically.
Once you know what to automate, the type of tool you pick determines how much setup time and ongoing maintenance it takes. Here's how three common categories compare.
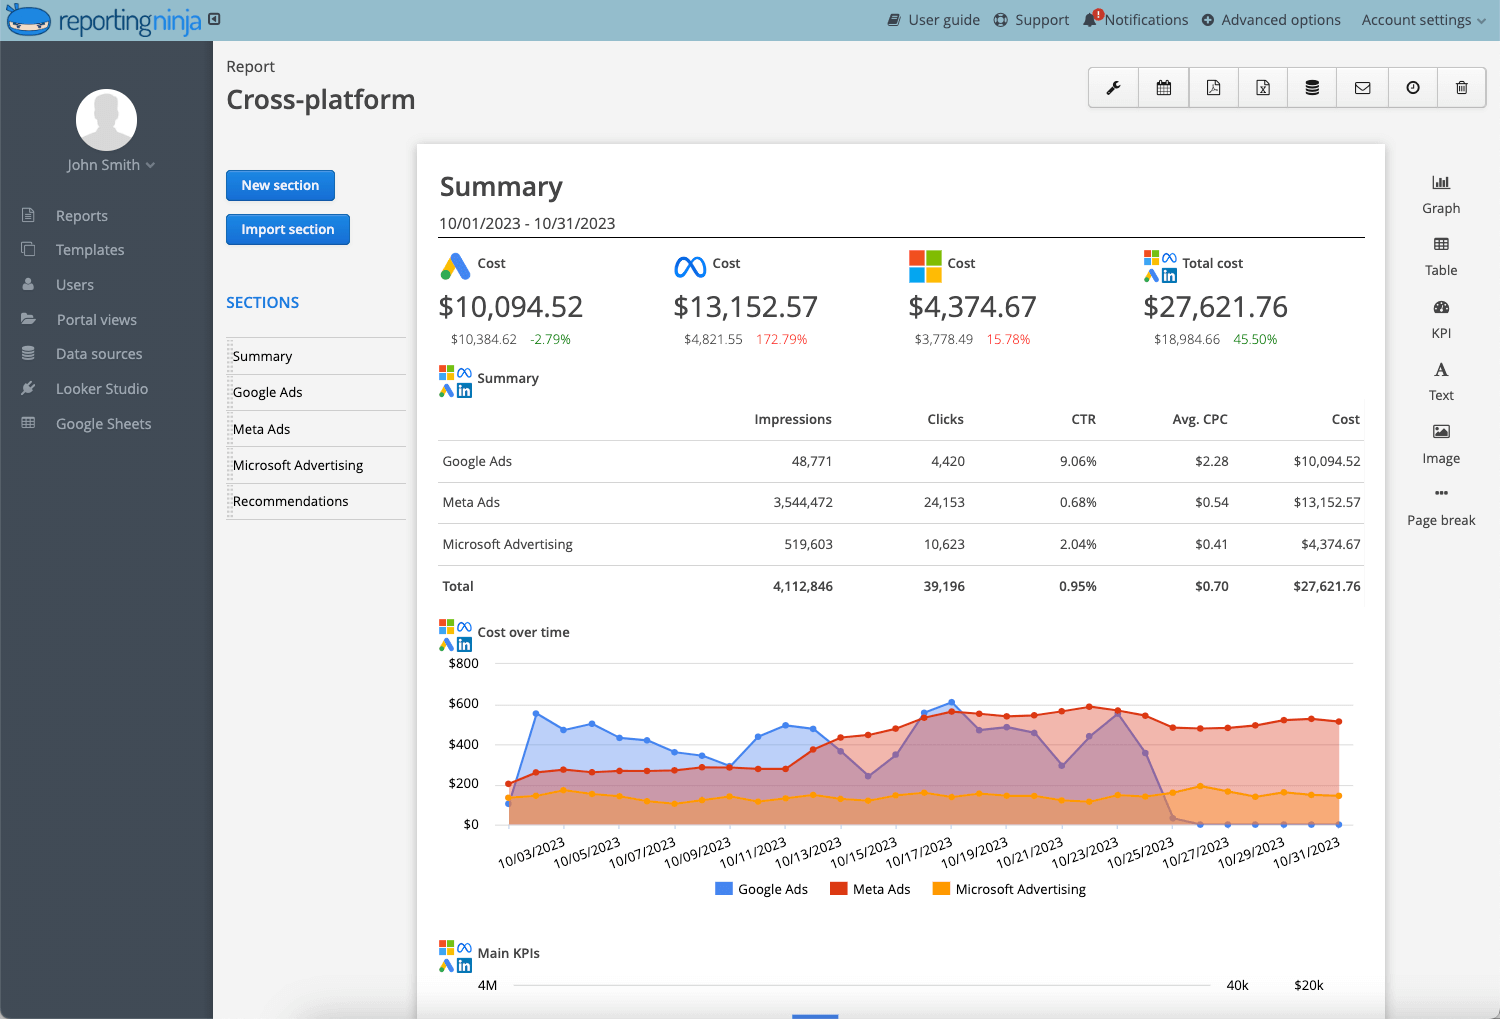
A dedicated reporting platform handles the full loop, connecting to your channels, building the report, and delivering it on a schedule.
Reporting Ninja is one example. It connects to Meta, Instagram, LinkedIn, TikTok, X, YouTube, Pinterest, Snapchat, and Reddit, alongside Google Analytics, Google Ads, and other non-social sources. That way, social reporting doesn't require a separate tool from the rest of your marketing reports.
Every plan includes the custom reports platform, Looker Studio templates and connectors, Google Sheets add-on, and API access, with no features locked behind a higher tier. Plans, billed annually, start at $20 a month for 10 reports with unlimited users, which covers most freelancers and small agencies without the per-client pricing jumps that show up on other platforms.
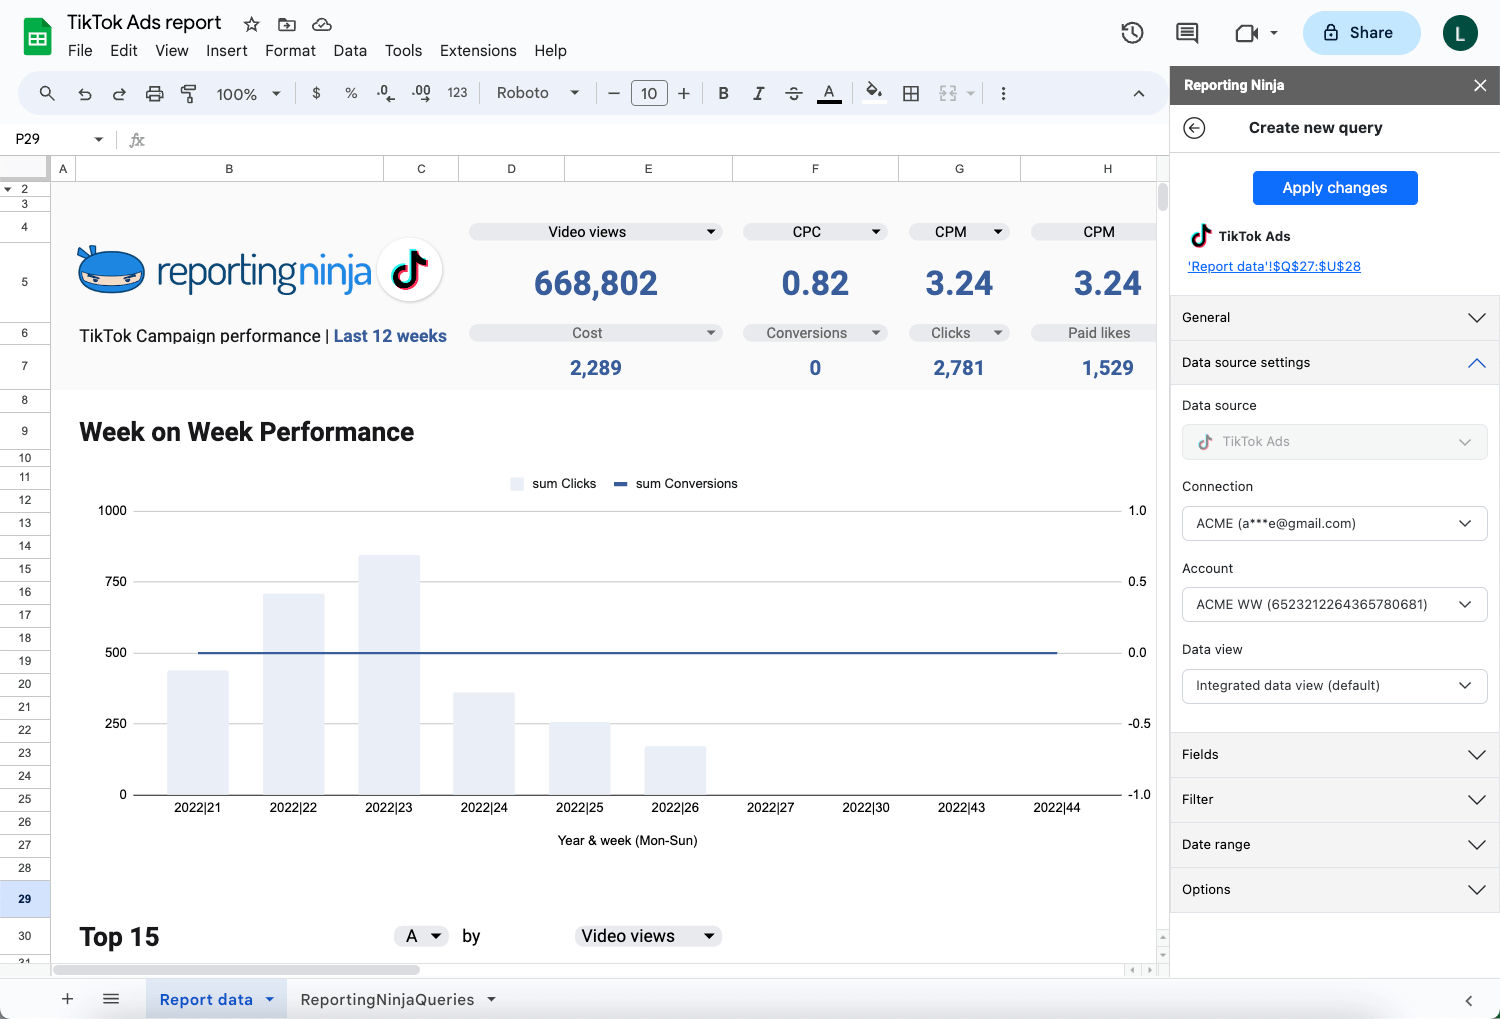
If your team already builds reports in Google Sheets or Looker Studio, a connector pulls platform data straight into those tools rather than giving you a separate dashboard. This suits teams that want to run their own custom analysis, blend social data with other sources, or keep everything inside a familiar interface.
The tradeoff is that the report layout is on you. Connectors move the data, but you still design, build, and maintain the visualizations yourself, which takes more upfront work than a platform with pre-built templates.
These platforms focus on polished, highly visual output and are positioned toward larger teams with bigger reporting budgets. For a solo freelancer or a two-person agency, the depth of features can be more than a typical client report actually requires.
Teams managing large enterprise marketing programs often value the presentation-ready visualizations, while smaller agencies may find themselves paying for capabilities they rarely use.
If a flat-rate platform sounds like the right fit, you can see every social and marketing channel Reporting Ninja connects to and start building reports on a free trial before you commit to a plan.
{{cta-block-v1}}
Pick one recurring report you're still building by hand and start there. Once it's running automatically, expanding to additional platforms and report types is a much smaller jump.
Reporting Ninja supports that gradual rollout with a custom reports platform, where you can connect your social accounts, build reusable templates, and schedule recurring deliveries in the format that fits each client.
Explore Reporting Ninja to see the full platform, or start your free 15-day trial and connect your first account today.
Automated social media reports are dashboards, PDFs, or scheduled documents that pull performance data directly from platforms like Meta, LinkedIn, TikTok, and X, so the numbers update without manual exports.
Connect your platform accounts to a reporting tool, choose or build a report template, and set a delivery schedule. When creating a social media dashboard, start by selecting the metrics and views your audience needs most. The tool then refreshes and sends the report automatically going forward.
Yes. Reporting Ninja connects to multiple platforms, including Meta, LinkedIn, TikTok, and X, combining organic and paid data from each one into a single dashboard or report.
It depends on campaign activity. Weekly reports are often best for active paid advertising campaigns, while monthly reports usually provide enough data to evaluate organic social media performance and broader marketing trends.
Sign up for a 15 days free trial. No credit card required.

Build and automate amazing custom reports in a few clicks. Save time, be more productive, impress your clients.