Social
August 11, 2026
Social media analytics report template for agencies and freelancers



It's the last day of the month, and you're exporting the same five CSV files you exported last month. Then you rebuild the same charts, and the client replies with one question you can't answer directly from any of it: What actually worked?
A social media analytics report template ends that cycle by fixing the structure once, so only the data changes each month. The eight sections below cover what a monthly report needs, from the executive summary through to your recommendations.
You'll also find five channel templates for Instagram, Facebook, LinkedIn, TikTok, and YouTube, a three-step framework for building reports in Reporting Ninja, along with the common mistakes that lose client trust.
A social media monthly report template needs eight sections. Each one answers a question a client will ask and supports a different decision. Use the checklist below before you send anything out:
The executive summary answers three things in under 100 words:
Most stakeholders read this section and skim the rest, so it should sit at the top of your report.
Pull one headline number from each connected channel rather than every metric available. Choose reach, follower growth, or spend depending on what the client hired you to improve. This section tells the client whether they need to read further or can go straight to your recommendations.
The channel performance overview breaks the summary into per-platform detail. If you run Instagram, Facebook, LinkedIn, and TikTok for one client, each channel gets its own row so the client can see which one is producing results.
Avoid comparing absolute numbers across channels. A LinkedIn page with 2,000 followers and a 4% engagement rate can produce a stronger response than an Instagram account with 20,000 followers and 0.5% engagement. That’s because the platforms attract different audience sizes. Structuring this layer well is one of the first steps to building a social media analytics dashboard.
Report engagement as a rate, not only as a raw count. Isolate likes, comments, shares, and saves by post type, because a single blended engagement rate hides which formats produced the response.
A post with 500 likes on an account with 100,000 followers is underperforming. The same 500 likes on a 5,000-follower account is a strong result. Always show interactions next to an engagement rate or a period-over-period comparison.
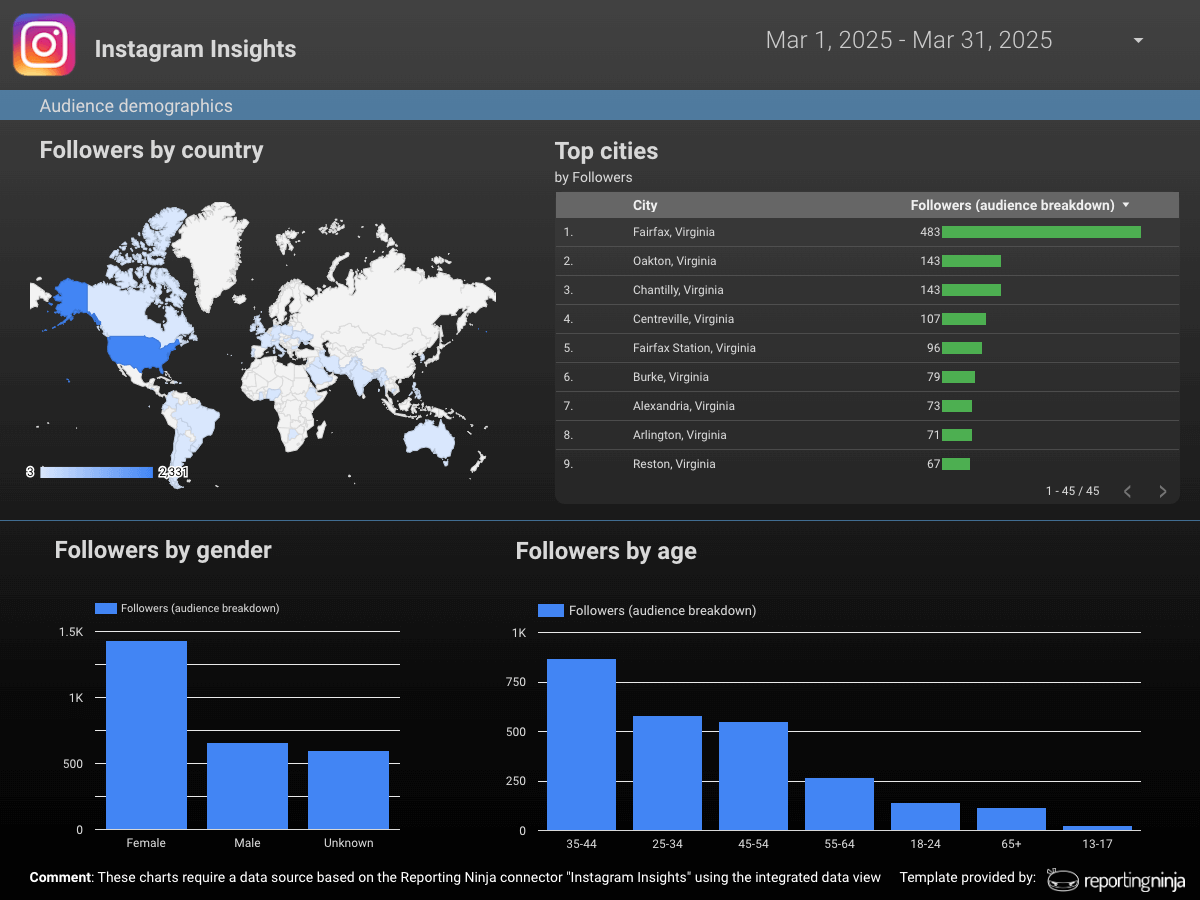
Audience growth needs the same treatment as engagement. Track new followers and lost followers separately rather than reporting a net figure. A page that gained 500 and lost 300 has a different problem from a page that gained 200 and lost none, even though both show net growth of 200.
This section supports a content and community decision. It tells you whether recent posting is pushing existing followers away, rather than only failing to attract new ones.
Name specific posts in the content performance section instead of describing categories. For example, a report stating that "Reels reached three times as many accounts as static posts this month" is more useful to a client than a simple "content performed well."
Then explain what produced the difference, whether that was format, posting time, or topic. That detail is what changes next month's content plan. Deciding which numbers belong here and which belong in the executive summary is easier once you know how KPIs and metrics differ.
Keep paid social in its own section, separate from organic, if your client runs both. Social media campaign reporting needs spend, impressions, clicks, cost per result, and return on ad spend (ROAS) where the client tracks it.
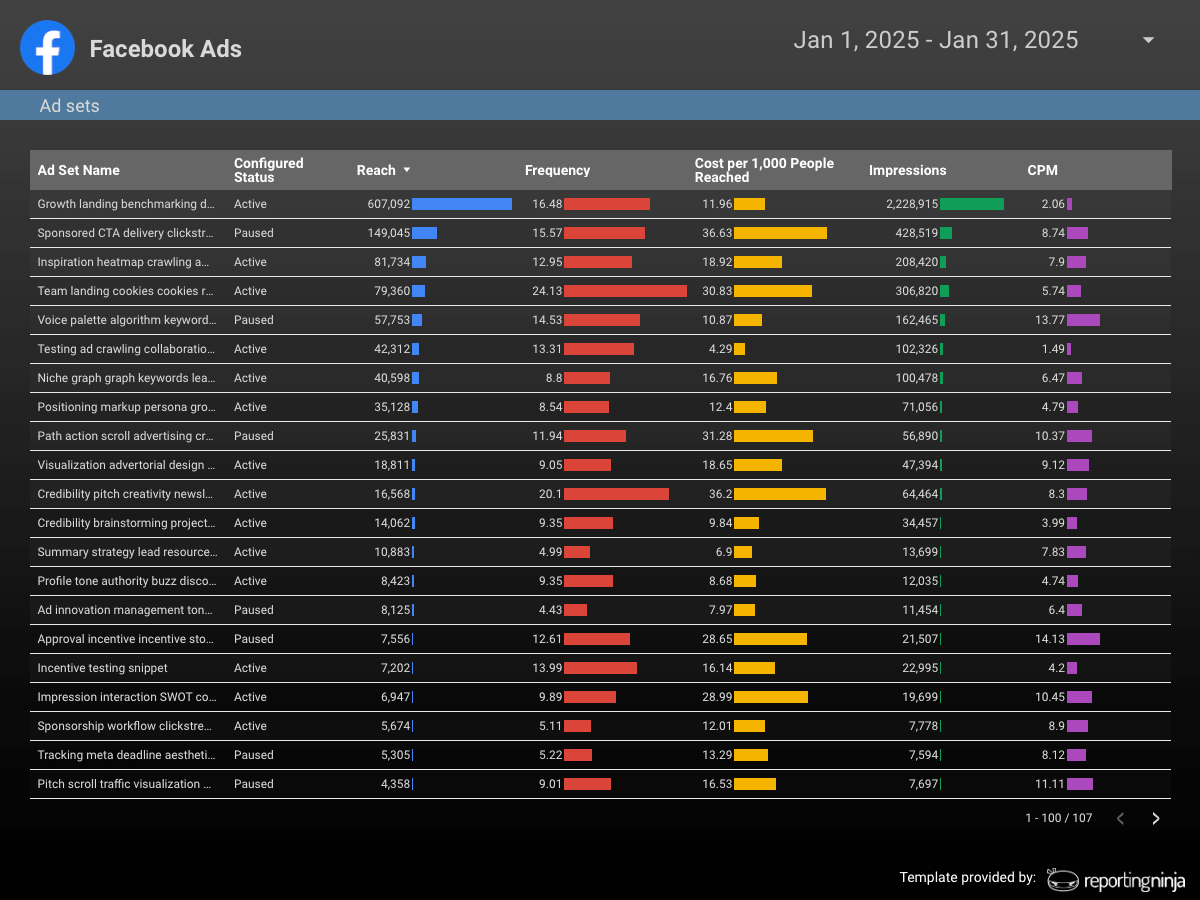
The separation is important because paid spend makes an account look stronger than its organic content is. If the client reduces the budget, a blended report gives you no way to explain the drop that follows.
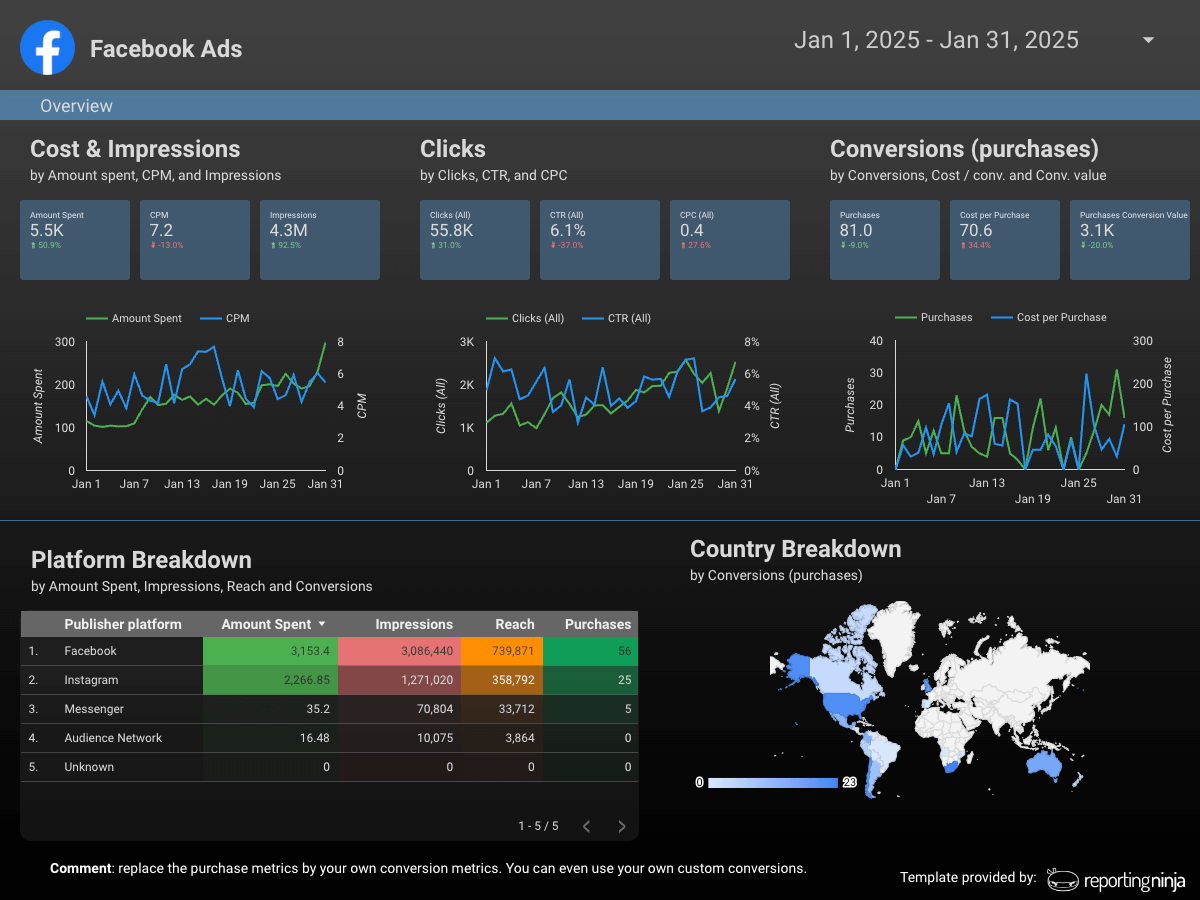
This section connects social activity to what happened after the click, whether that was a website session, a form fill, or a purchase. Pulling conversion metrics from Google Analytics is what makes this section possible, since social platforms often only show you activity up to the click.
Close every report with two or three recommendations tied to the data above them. Each recommendation should identify the exact change you want to make, not a vague direction. Most templates skip this section, yet it’s one that turns a data dump into an effective marketing report.
Example: "Increase Reels from two to four posts a week, based on the engagement gap in section three" is a recommendation. "Post more video content" is not.
Below are five ready-to-use report structures, including a social media report example for each major channel and a consolidated version for agencies running several platforms. Every metric listed comes from the live template pages.
{{cta-block-v1}}
Use this template when you need to show how Instagram content performed and how the audience changed.
Included metrics:
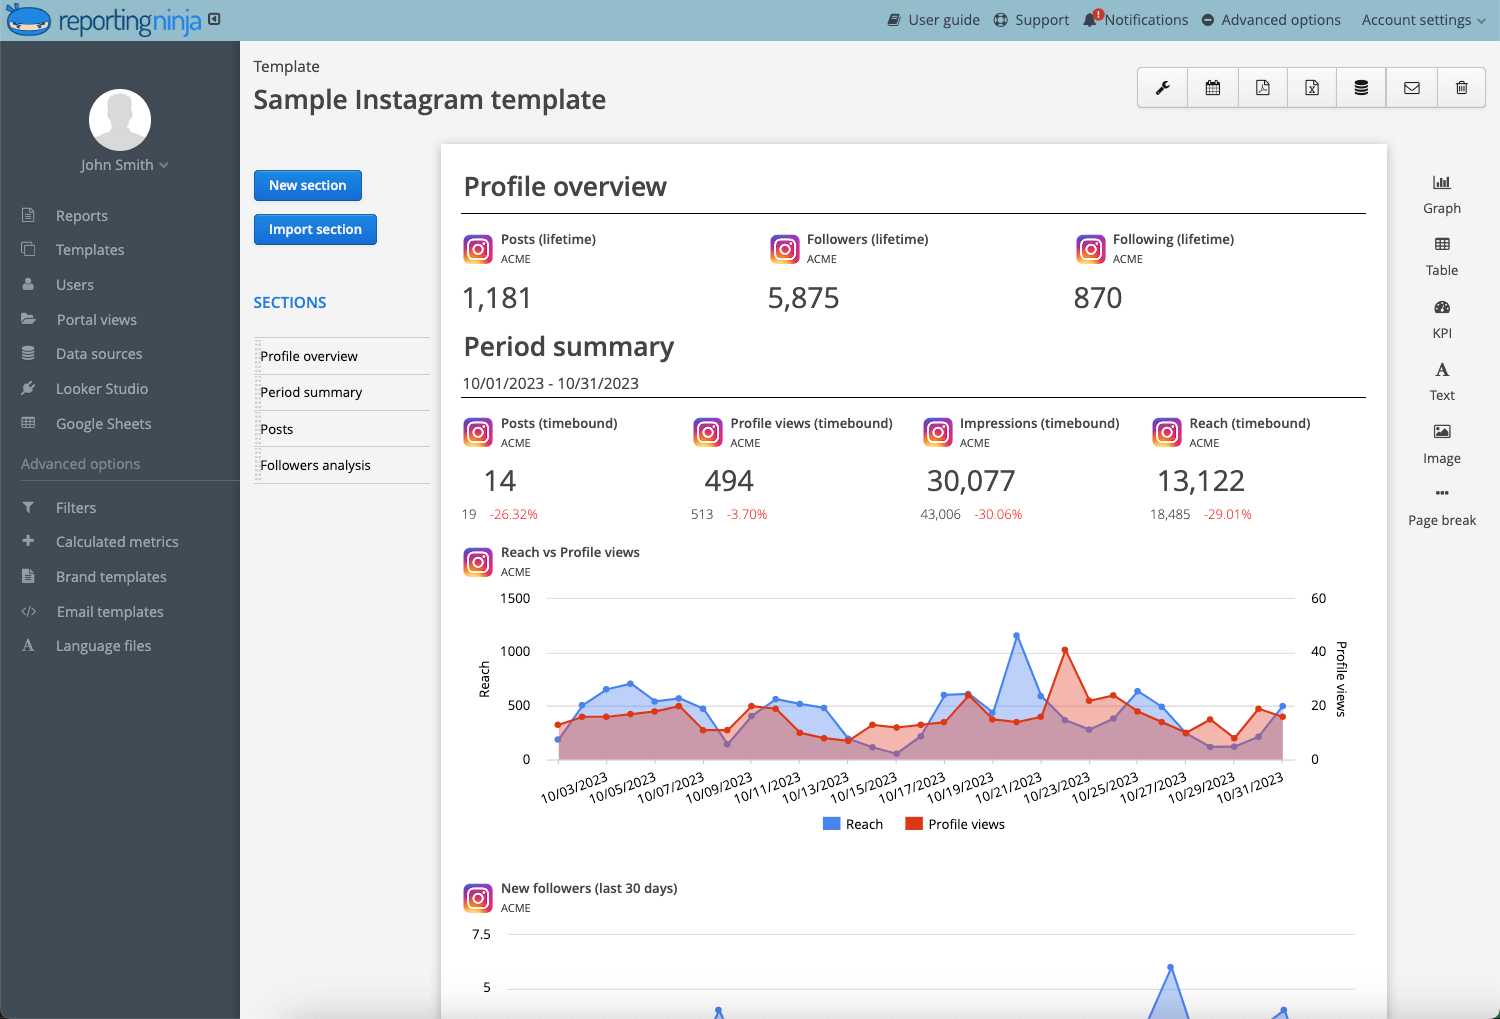
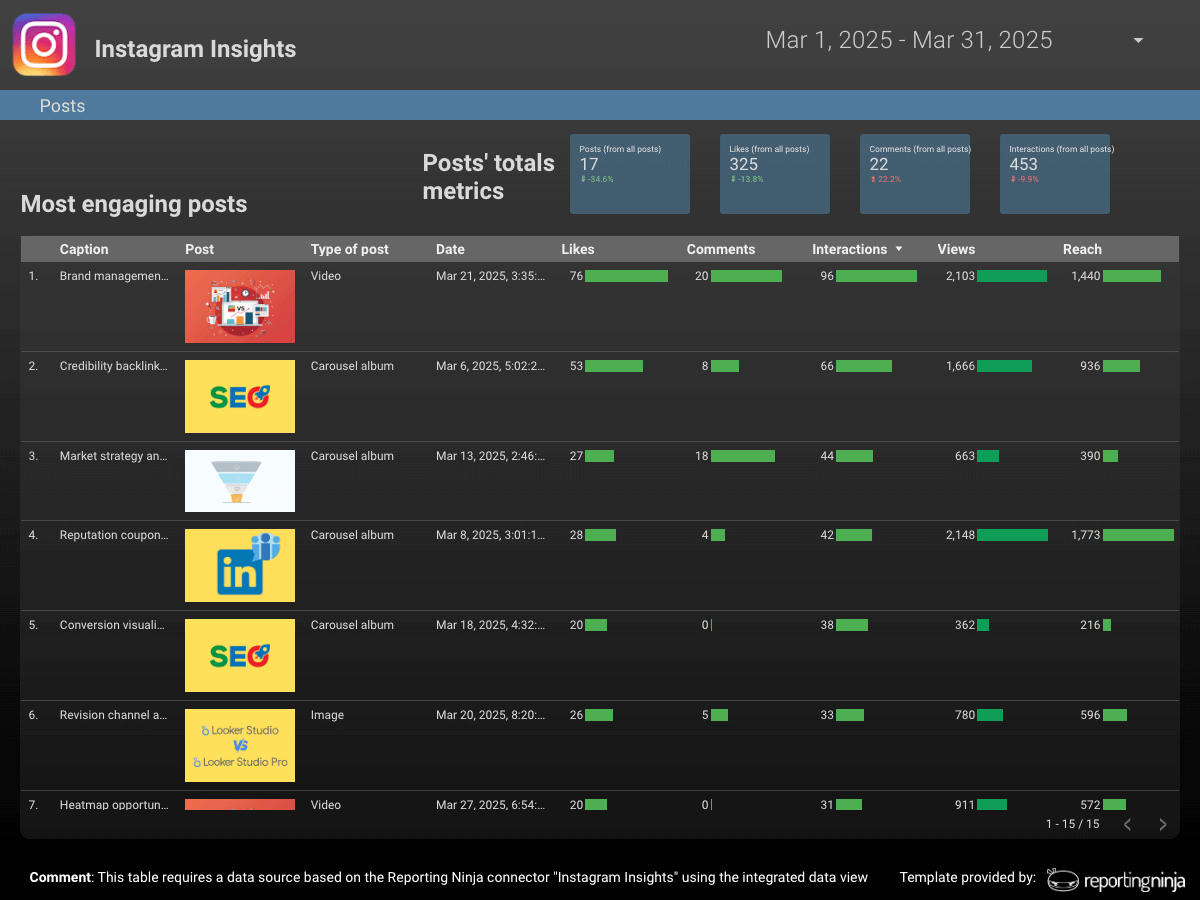
Read saves and shares separately from likes when you use this template. A high like count with low saves points to content people enjoy once and do not return to. High saves on a lower-reach post often points to content worth boosting or reposting.
For an agency, that split answers the question clients ask most often, which is what they should make more of. Reporting Ninja's free Instagram Insights report template connects to Data Studio once your Instagram Insights account is linked, so the dashboard refreshes without a manual export.
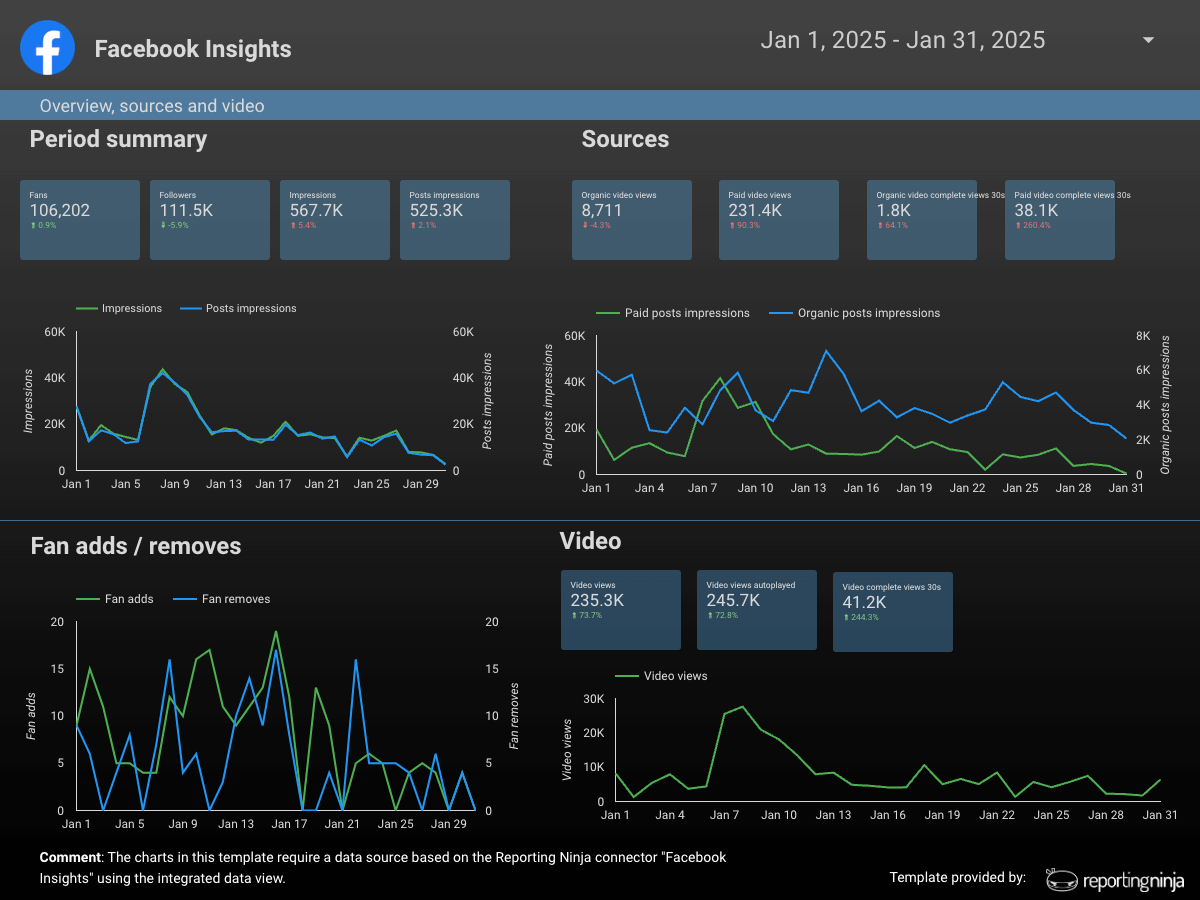
Use this template when video makes up a meaningful share of the content and you need to separate it from static posts.
Included metrics:
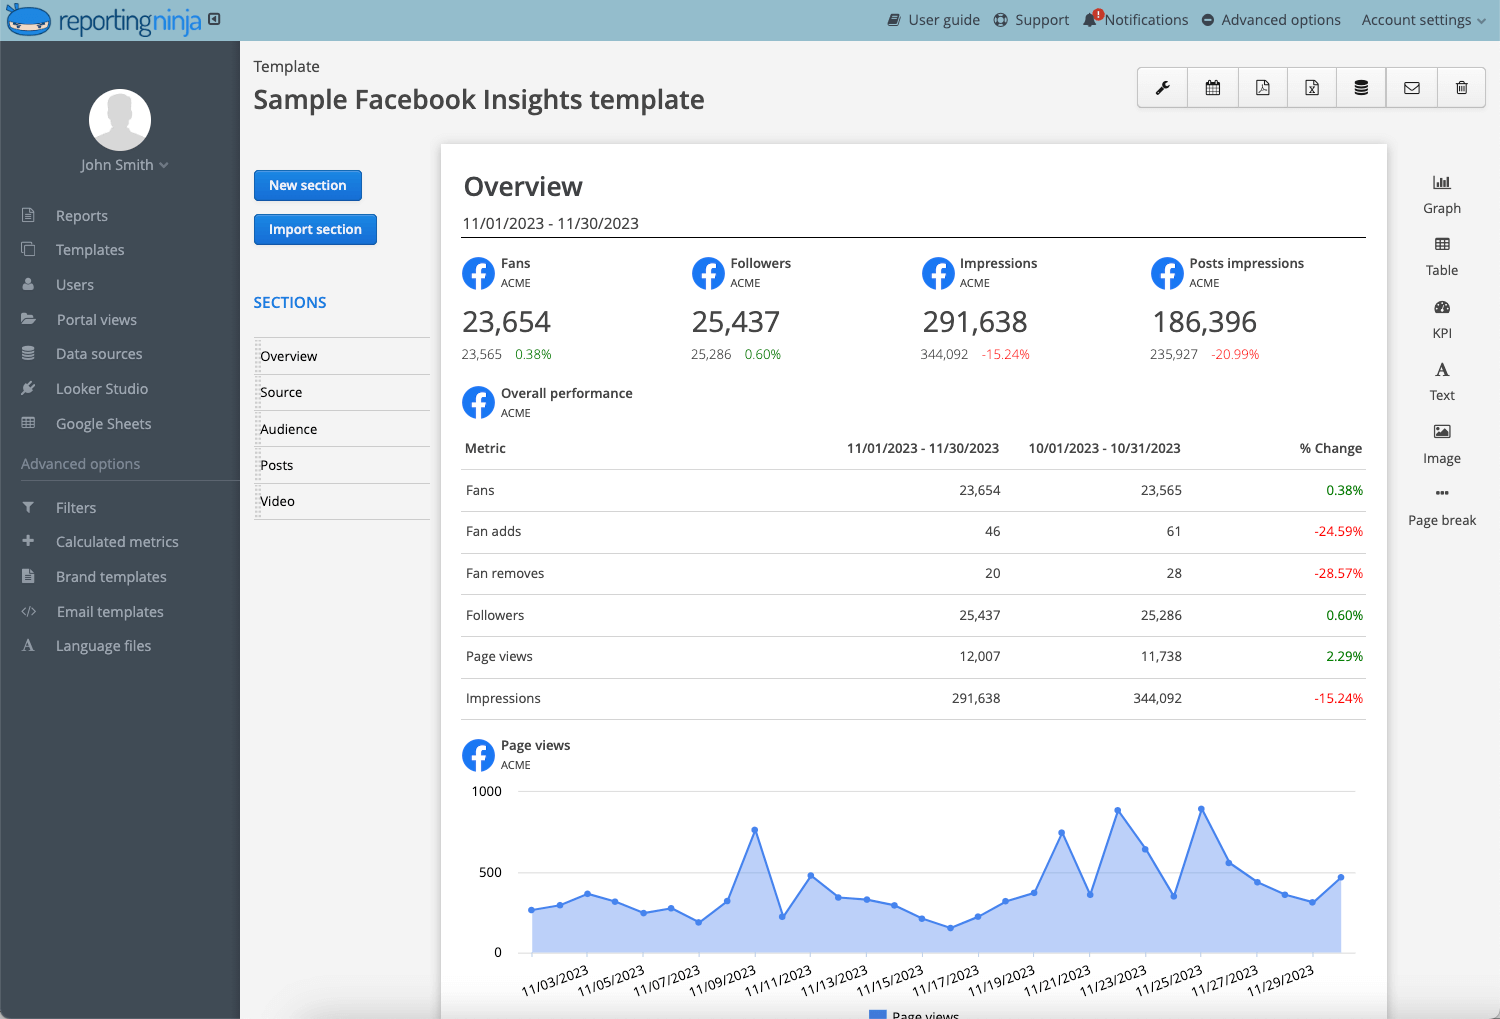
This is the one template that answers how video content compares with image posts rather than blending the two into one figure. It also separates organic impressions from paid impressions.
Reading video and static performance side by side tells you whether a reach drop came from the content or the format, and those two findings lead to different recommendations. The Facebook Insights report template pulls the data in automatically once you authorize the page, which helps when clients check performance mid-month.
Use this template when who saw the post matters as much as how many people saw it.
Included metrics:
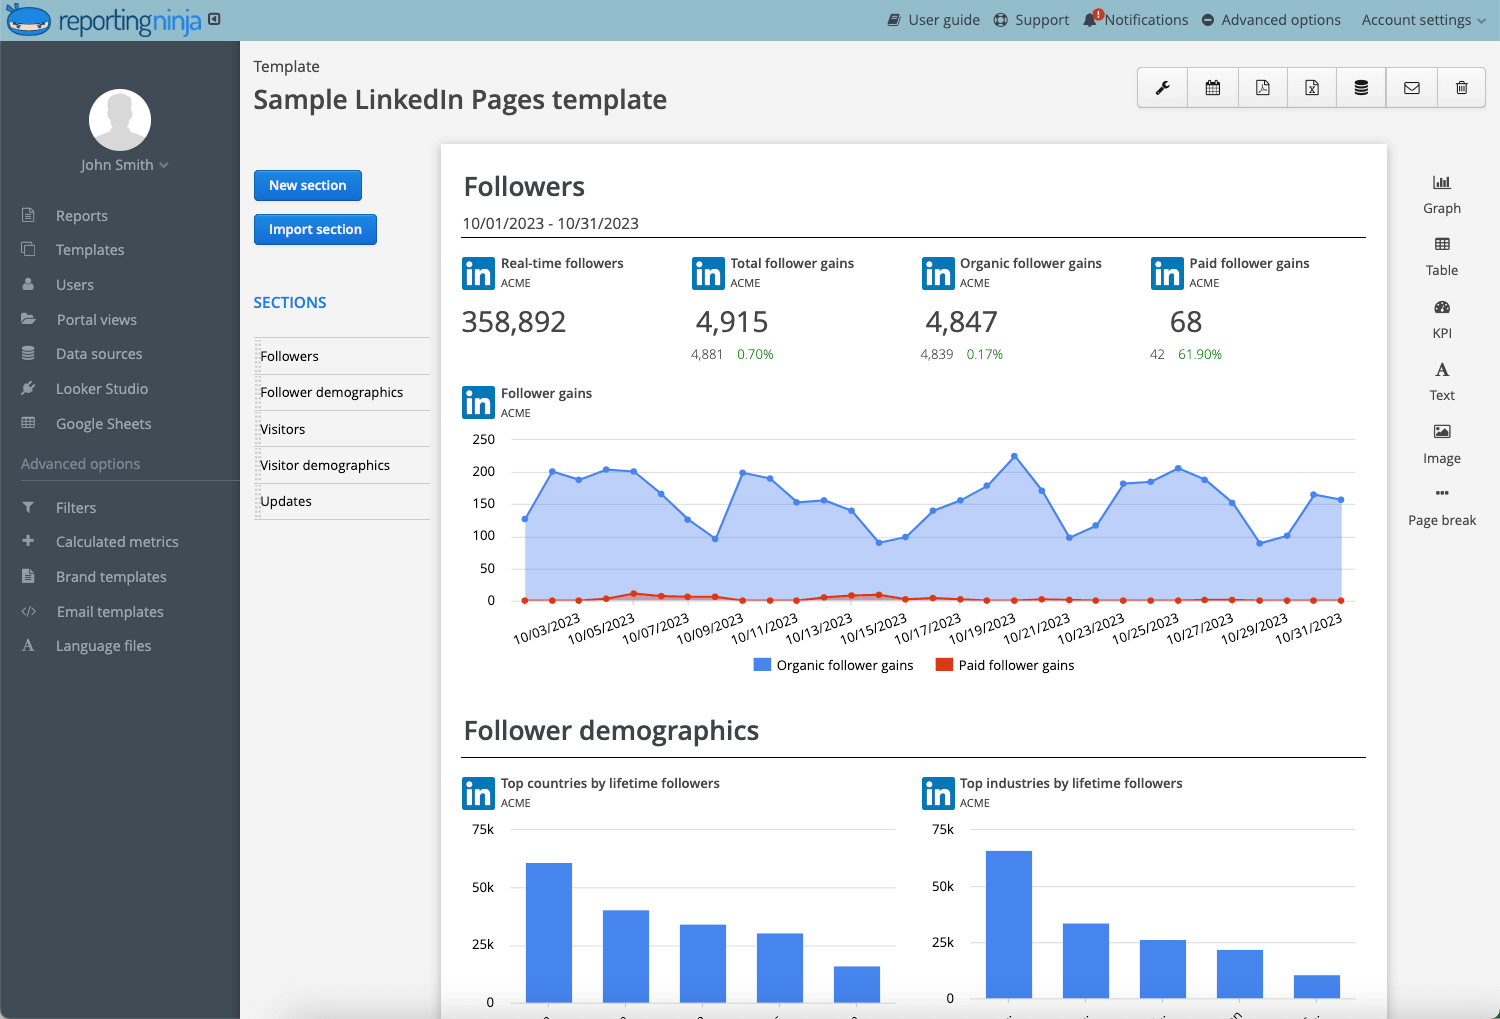
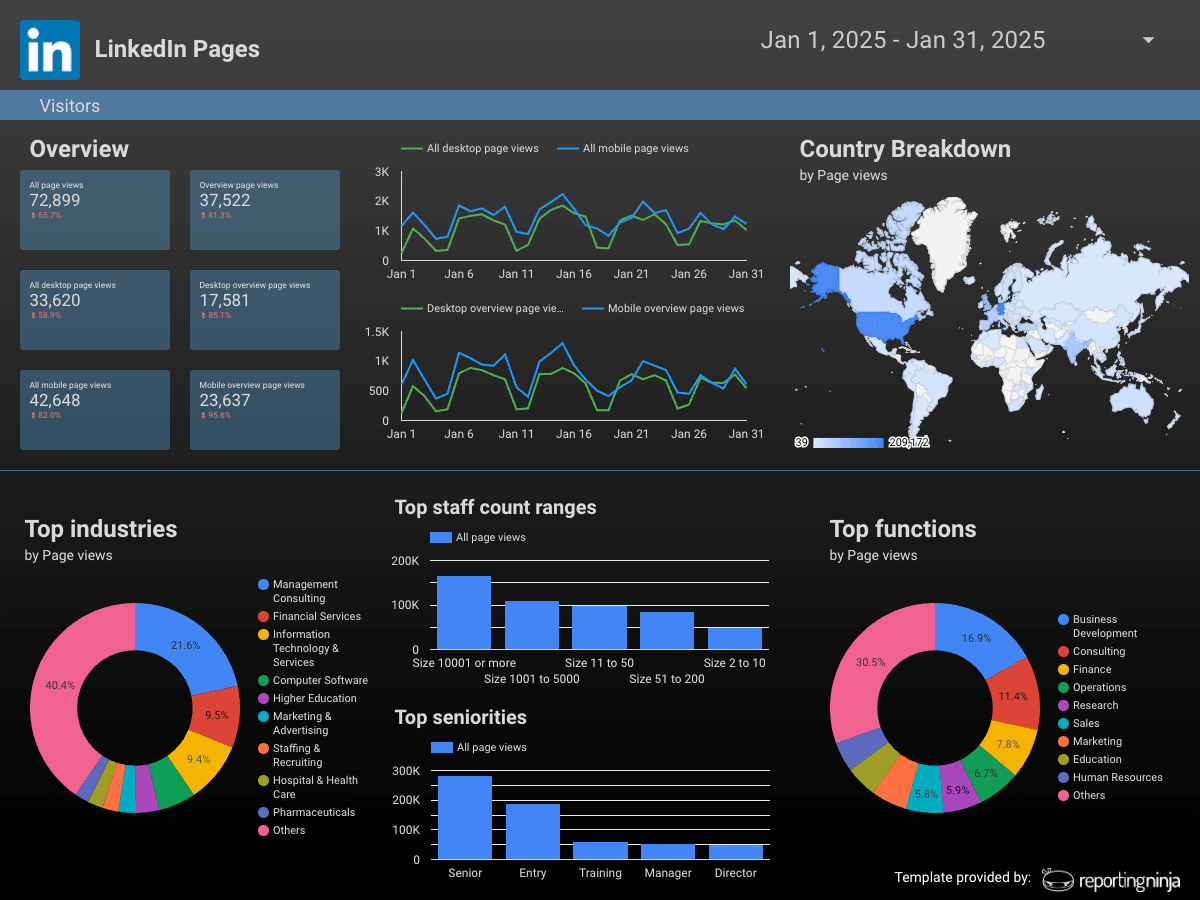
For B2B clients, the audience breakdown is often more useful than the engagement numbers. A post reaching 400 decision-makers at target accounts can be worth more than a post reaching 4,000 people outside the buying committee.
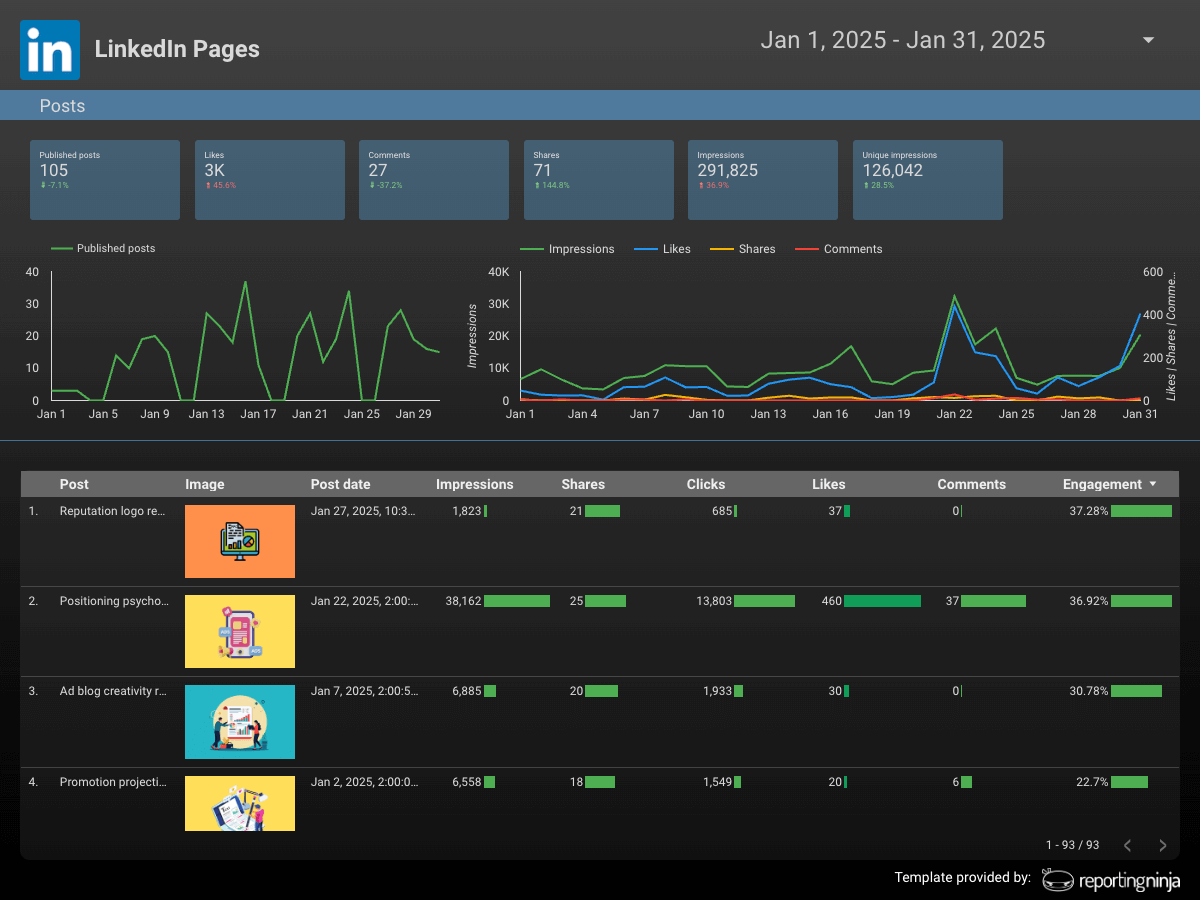
That data supports targeting and content-topic decisions rather than a simple verdict on whether a post did well. Reporting Ninja’s free LinkedIn Pages report template surfaces the breakdown automatically, which otherwise means manual work inside LinkedIn's own analytics.
Want a repeatable way to organize LinkedIn audience and engagement data? Try a Linkedin analytics report template.
Use this template when you need to identify which specific videos drove views and follower growth on TikTok.
Included metrics:
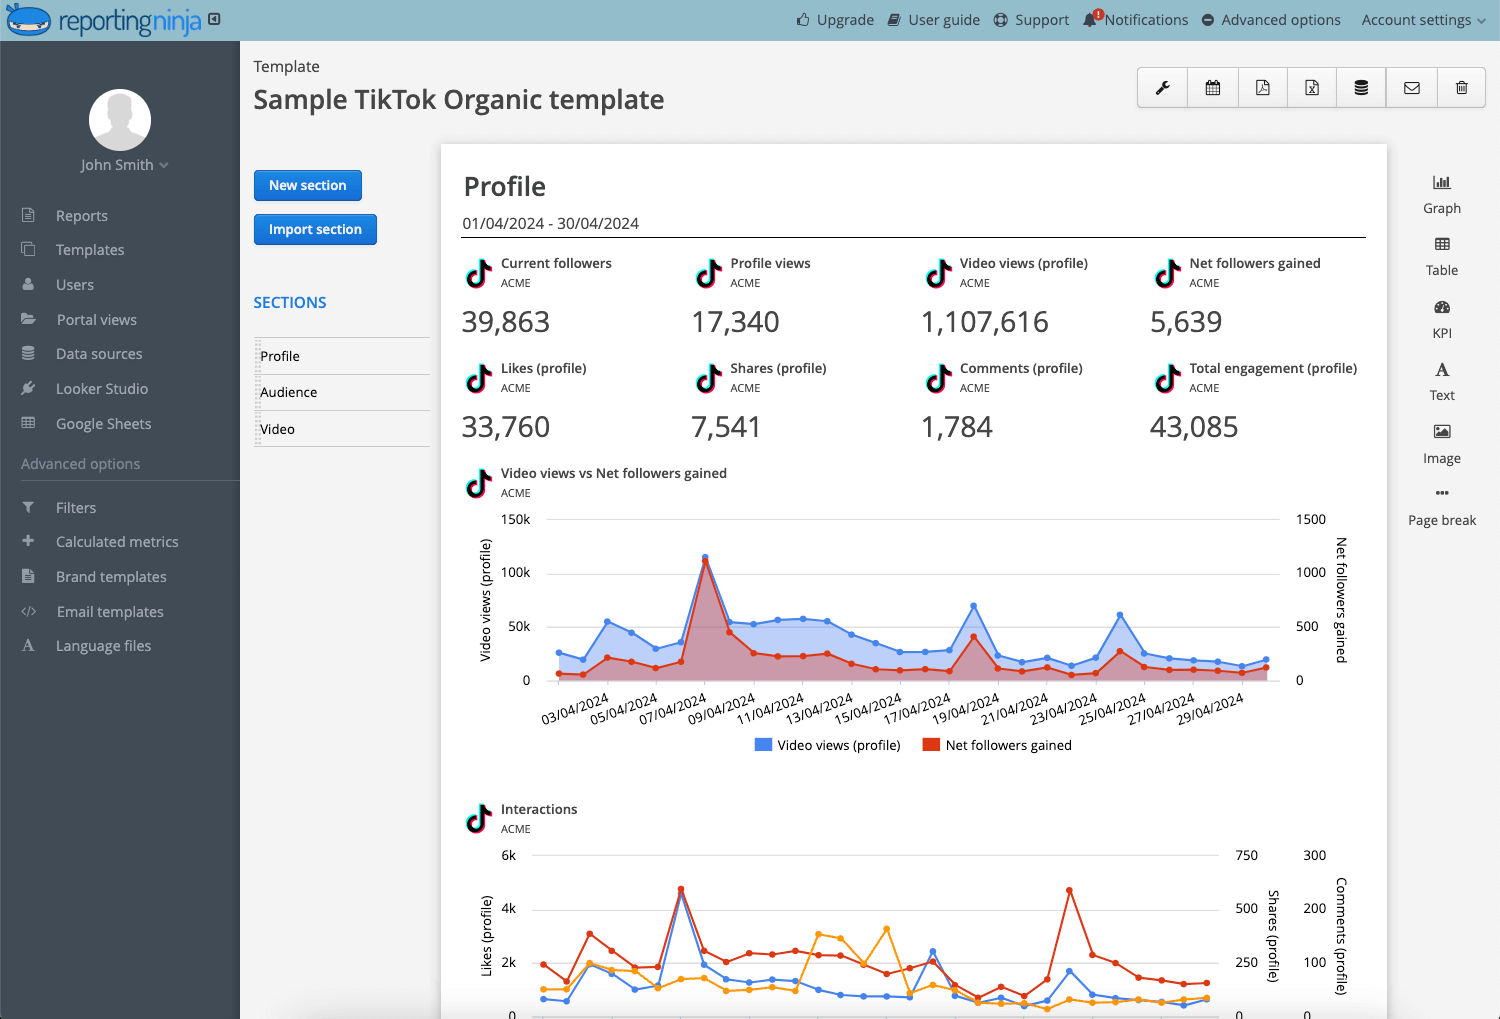
Watch rate carries more weight here than on other platforms. A video with modest views and a high full-watch rate tells you the opening seconds worked. A video with high views and a low watch rate was distributed widely without holding attention.
That difference tells a client which video to repeat and which one to treat as a one-off. The TikTok Organic report template by Reporting Ninja is free and covers those metrics without a separate export from TikTok's creator tools.
Use this template when a client publishes video on YouTube and needs watch time, retention rate, traffic sources, and other insights reported alongside views.
Included metrics:
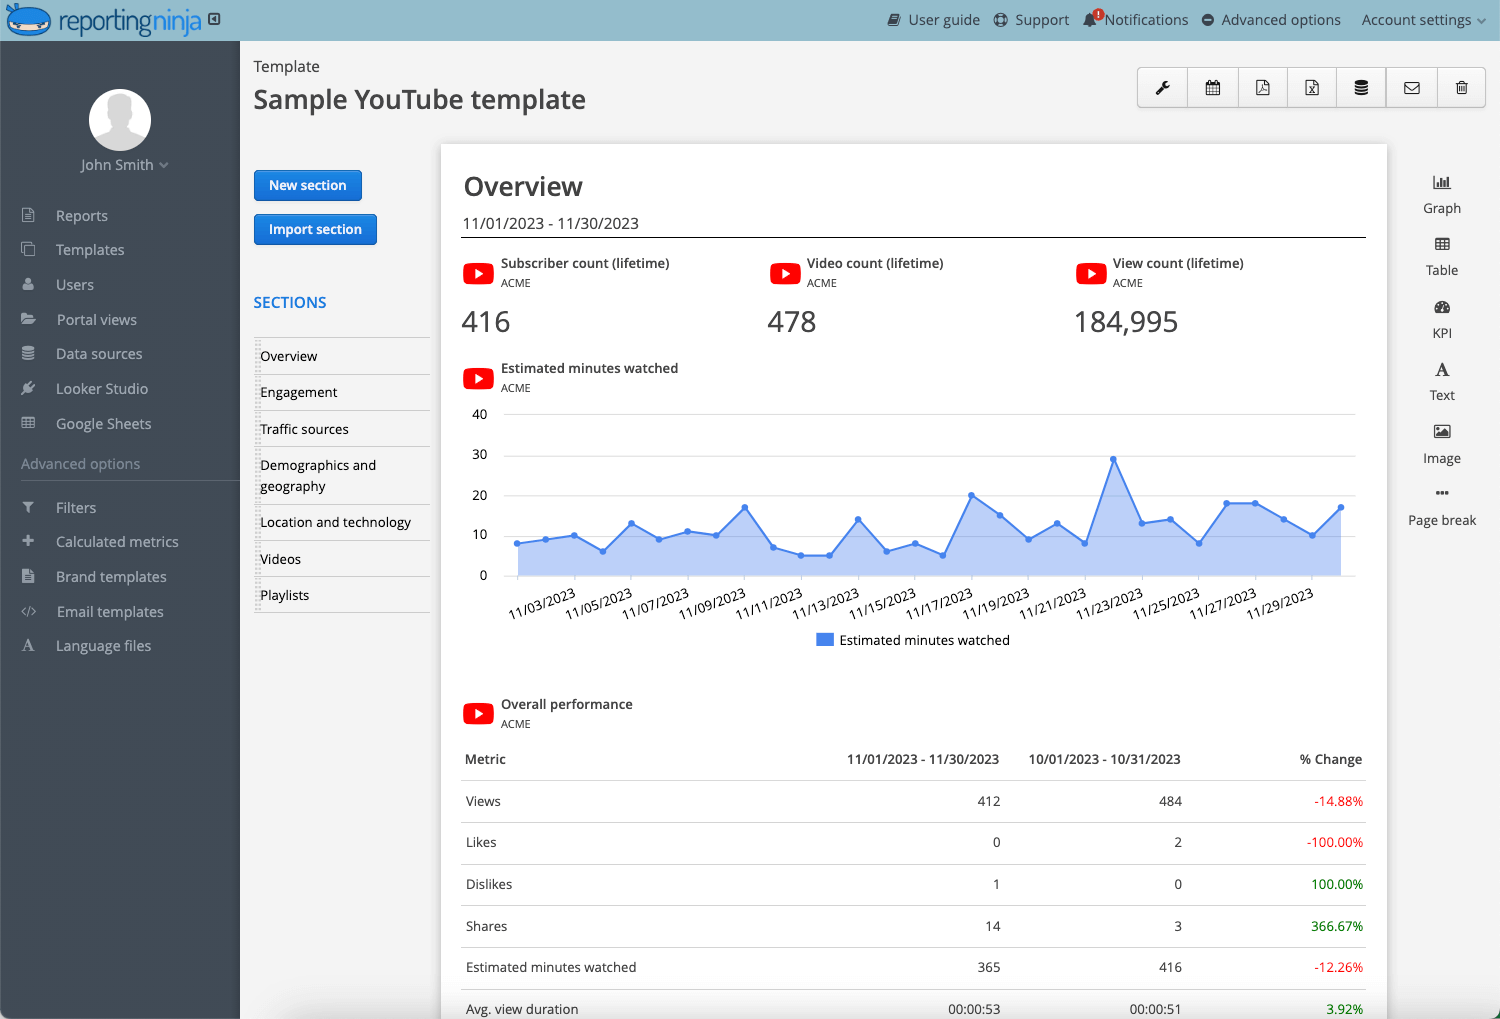
Just like TikTok, watch time is the metric to keep track of, because views alone will mislead a client. The traffic source breakdown answers a separate question. Views from YouTube search mean the titles and descriptions are working, while views from suggested videos mean the recommendation system carried the video, leading to different next steps for both findings.
Reporting Ninja's free YouTube report template covers all of the above in Looker Studio.
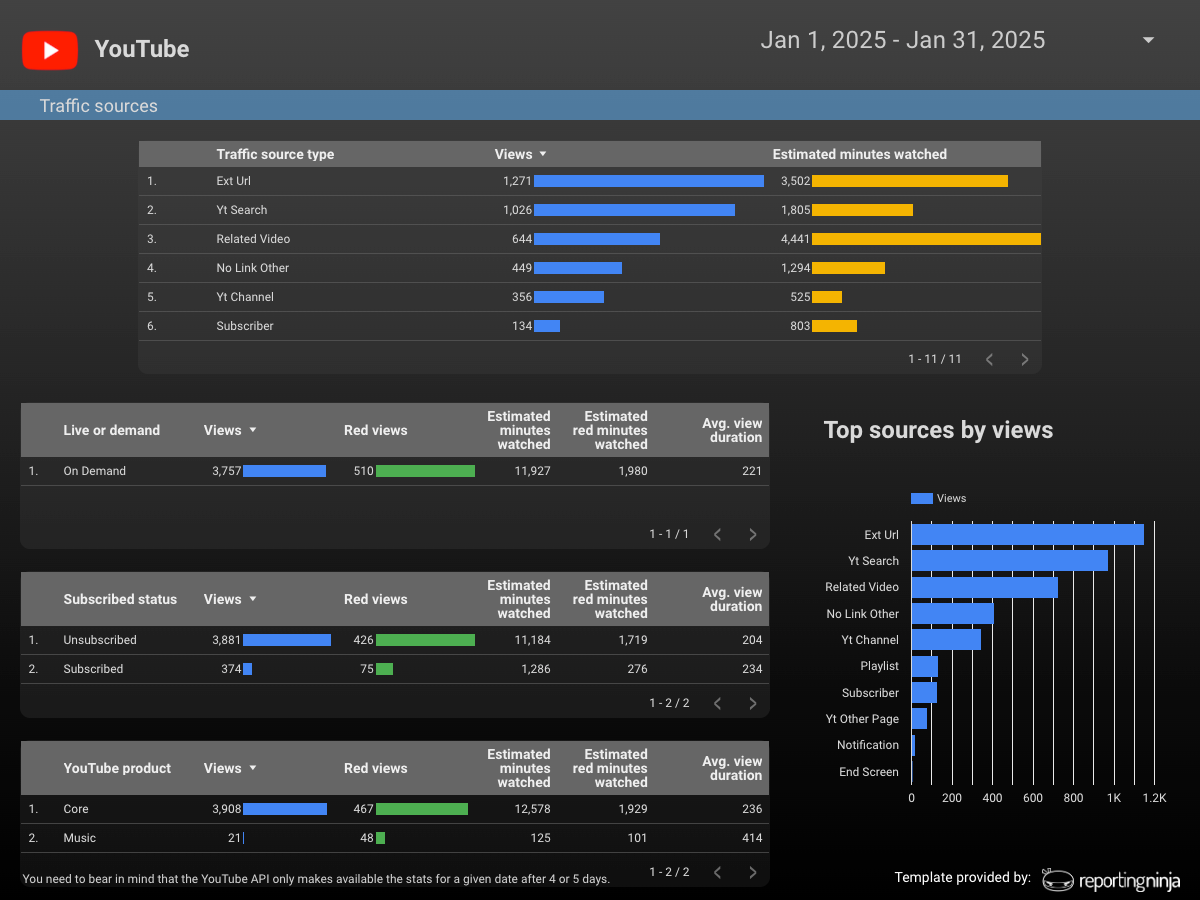
Our YouTube analytics reporting tool carries the same data in the custom reports platform, with a period-over-period comparison table showing percent change on views, shares, watch time, and average view duration.
Explore Reporting Ninja’s custom reports platform.
Use this template when the client wants one view across all social channels and the channel detail stays in the individual reports.
This one is a build pattern rather than a fixed template. Reporting Ninja's cross-platform reporting lets you combine widgets from the Instagram, Facebook, LinkedIn, and TikTok connectors into one report, and a wizard walks you through building custom widgets.
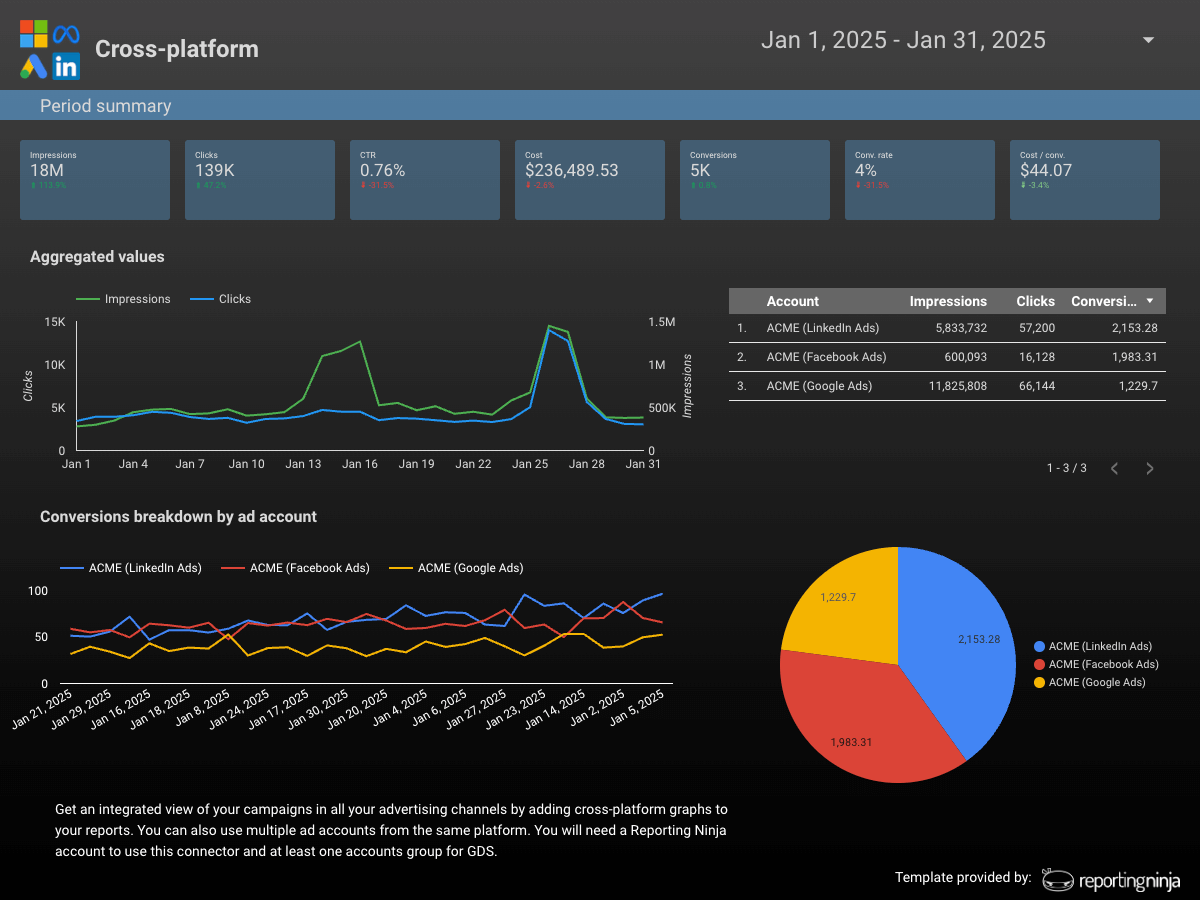
Standardize the metrics that mean the same thing on every channel, such as total reach, engagement, and follower growth. Leave watch rate, save rate, and job-function breakdowns in the individual channel reports. Forcing them into a shared table produces comparisons that are accurate but not useful.
Every reporting template is free, and connecting one takes a few minutes. Download your free Data Studio templates, then start your free trial to connect the account
Once you've picked a structure, building the report takes three steps. Here's how it compares with doing the same report by hand.
In your Reporting Ninja account, connect each platform you report on, such as Instagram Insights, Facebook Insights, LinkedIn Pages, or TikTok Organic. Each connection authorizes access so the data refreshes on a schedule instead of arriving through a one-time export.
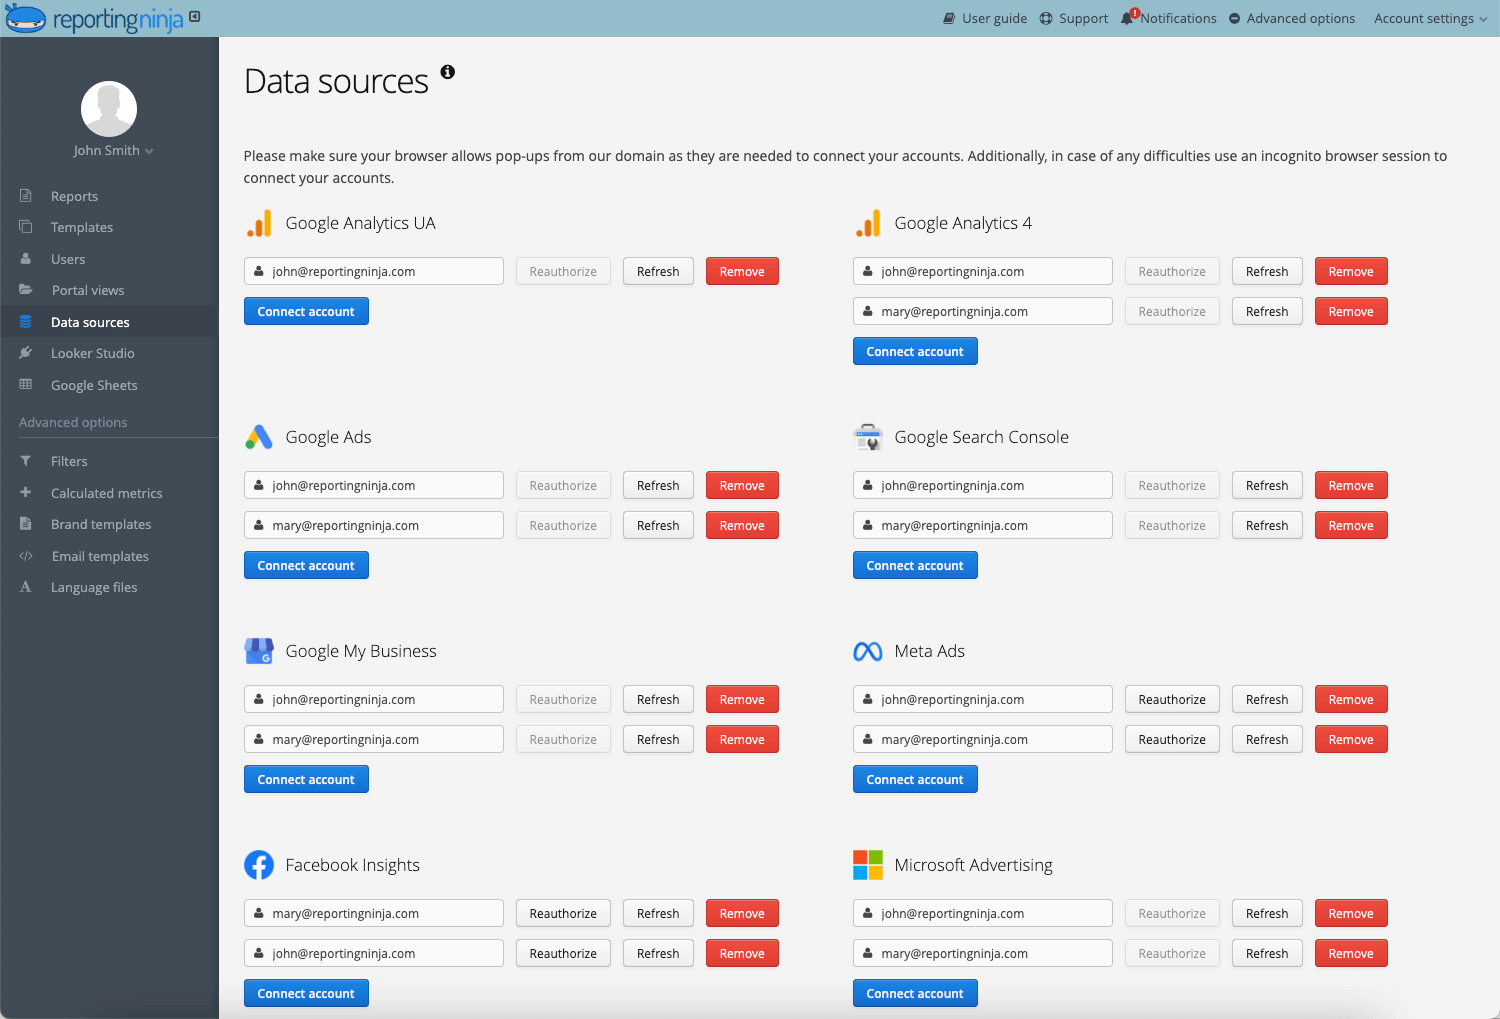
If you manage several clients, connect all their accounts in one sitting and use a consistent naming pattern such as client name plus platform. That saves time later when you're building or updating a report and need to find the right account.
Pick one of the Data Studio templates above, or build a custom layout in the social media reporting tool. This is the step where a generic report becomes a client report.
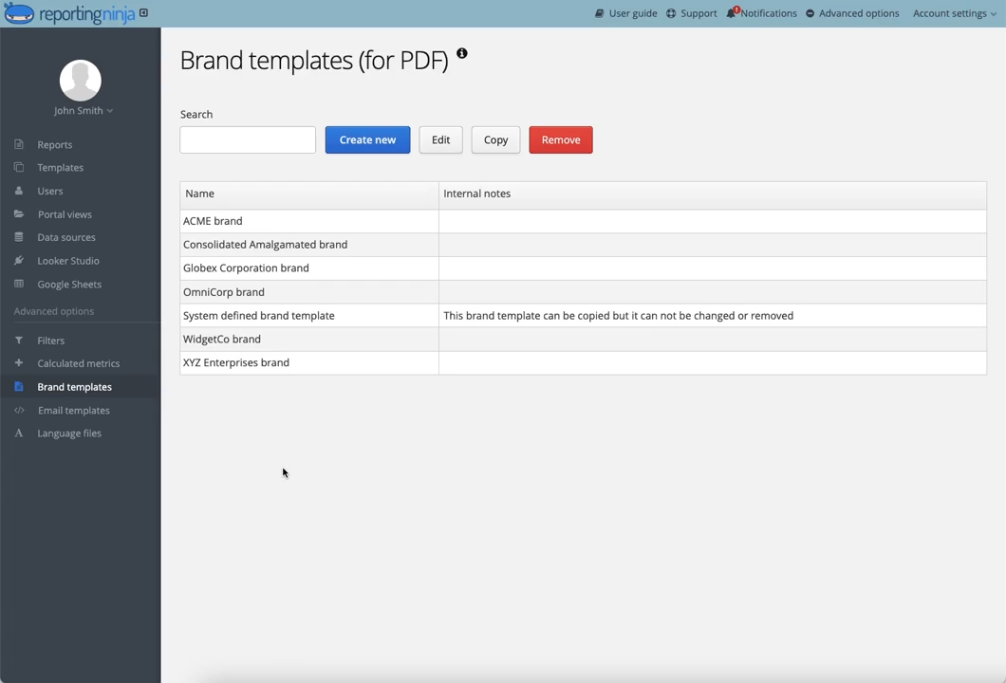
Set the date range to match the client's reporting cycle, then add or remove widgets based on the metrics they care about. You can apply their logo, brand colors, fonts, and graph styles, then add a cover page and a contents table.
If the client's goal is lead generation rather than brand awareness, reorder the report so the traffic and conversion section sits above the engagement sections.
Our guide on how to analyze marketing data covers how to pick that order.
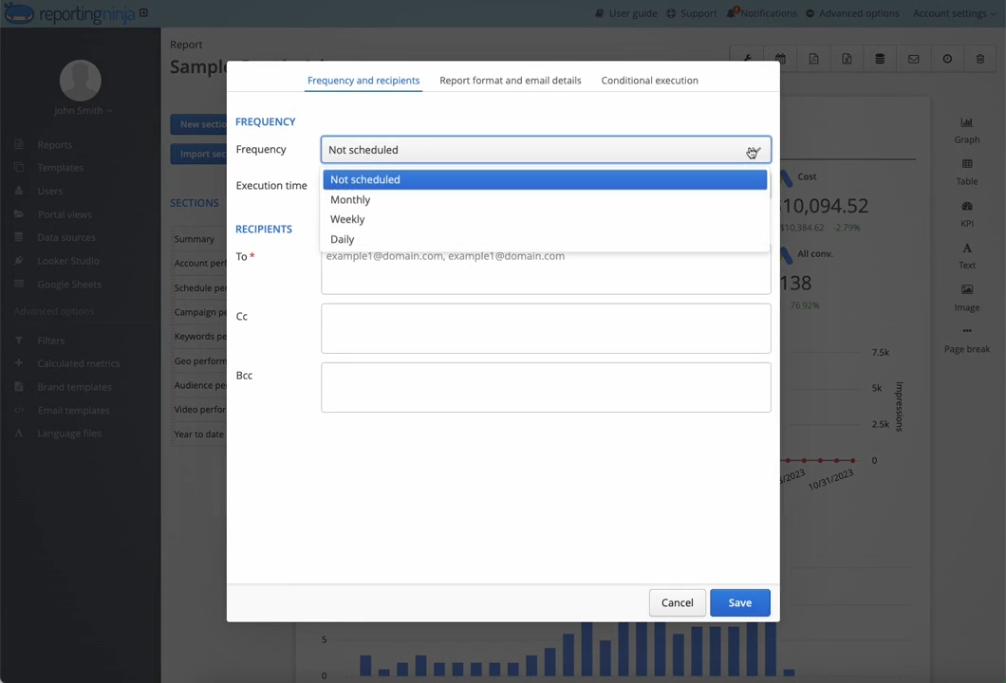
Set the report to refresh and send on its own, either as a scheduled email or through the client portal. After that, the data refreshes from each connected platform, the template auto-populates with current numbers, and delivery happens on the date you set.
With automated marketing reports, you only open the report again when something needs review. This eliminates the recurring manual work so you can focus on actual client work.
Each mistake below makes a report harder to act on. The most common one is a headline number that sets the wrong expectation before the client reads anything else.
HubSpot's 2026 State of Marketing report found that 37% of marketers plan to increase their social media marketing investment in 2027. Yet, 33% of respondents cite marketing ROI measurement as their number one challenge. That matters for your reports because a client who can't see the return will question the budget.
To fix this, report social contribution in three connected layers rather than one flat list of metrics:
Most reports stop at the first layer. That's the gap between showing activity and showing results, and it's the reason the ROI question keeps coming back.
Building the connection starts with attribution. Pull conversion data from your analytics tool alongside the social metrics, then apply an attribution model that matches how the client's customers buy.
The ROI section itself should show three figures: what the work cost, what it produced, and the return. Agreeing on those definitions before the first report is the point of a proper marketing measurement framework.
If you report on one channel for one brand, start with the single-channel template for that platform and skip the consolidated build. If you run three or more channels for several clients, build the consolidated report first and keep the channel templates for your own review.
Either way, the manual export is what you should really be removing. Reporting Ninja automates that process by connecting your accounts once and refreshing them on a schedule. Sign up for your free 15-day trial to get started today, no credit card required.
{{cta-block-v1}}
A social media report template is a reusable structure for presenting performance data. It usually covers reach, engagement, audience growth, and conversions, so the same format is refreshed with new data each period instead of rebuilt.
Monthly. A social media monthly report is standard for most agency and client relationships. Accounts running active paid campaigns often need a weekly summary alongside the monthly report.
Yes. Reporting Ninja's Data Studio templates for Instagram, Facebook, LinkedIn, and TikTok are free to use, though each one needs a connected data source before it shows anything.
A report covers a fixed period and is shared on a schedule. A dashboard updates continuously and is built for checking performance at any point. Our guide to creating a social media dashboard covers when each one fits.
Yes. Most templates can be filtered or duplicated to cover a single campaign's dates, separate from the account's regular monthly reporting.
Sign up for a 15 days free trial. No credit card required.

Build and automate amazing custom reports in a few clicks. Save time, be more productive, impress your clients.