Social
July 2, 2026
Creating a social media dashboard: steps, templates & examples



Every social platform you manage is another login, another export, and another chance for the numbers in your report not to match. If you piece together Meta, Instagram, and LinkedIn data by hand every week, a social media dashboard fixes that.
A social media dashboard is a single view that pulls engagement, reach, clicks, and conversions from every channel into one place, so you stop rebuilding the same report from scratch. Instead of logging into each platform and exporting data one at a time, you get every metric that matters in front of you at once.
This guide walks through what a good dashboard includes, the different ways to build one, a step-by-step process for setting yours up, and how to choose the right approach for your team.
The best dashboards help someone make a decision quickly and correctly. If a metric doesn't support a decision, it doesn't belong on the dashboard. A dashboard cluttered with irrelevant metrics makes the important numbers harder to find. These are the key details your social media dashboard needs to have:
Once you've decided what your dashboard should contain, the next decision is how you'll build it. The right approach depends largely on your reporting volume, technical resources, and how much ongoing maintenance you're willing to take on.
Before choosing a tool, consider how much manual work you're willing to take on as your reporting workload grows. The right dashboard for you is the one that matches your reporting needs.
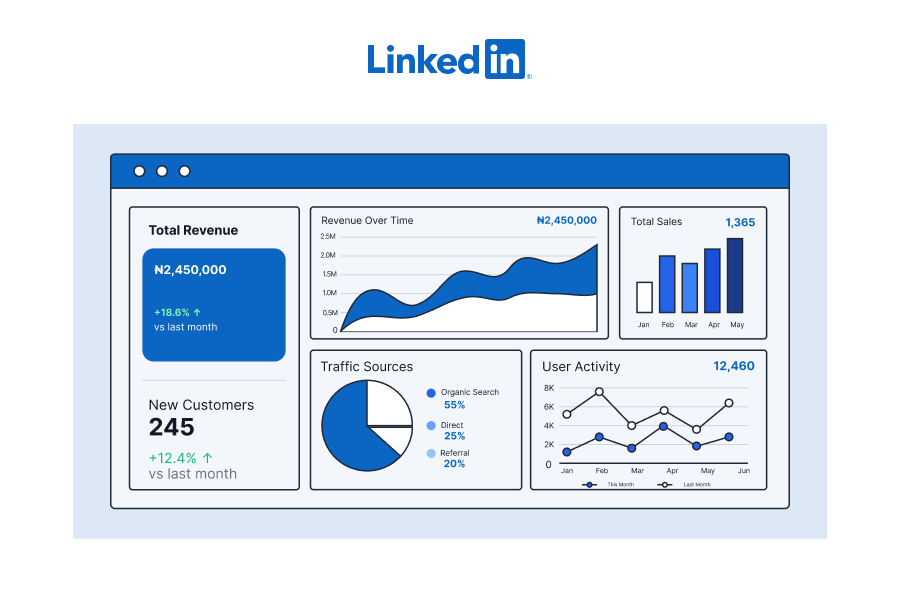
These are the built-in marketing analytics screens inside Meta Business Suite, LinkedIn Analytics, or TikTok's creator tools. They're free and immediate and are the best option for tracking performance on each platform individually.
However, if you manage more than one channel, they become inadequate when you need to compare campaigns across networks or deliver one consolidated report to stakeholders.
Pulling exported CSVs into Google Sheets gives you full control over formatting and formulas. It works well for a single account or a very small client list, but every refresh means re-exporting and re-pasting data. And that’s exactly the manual bottleneck most teams are trying to escape.
Another major concern is that spreadsheets introduce version control as reporting teams grow. This can make multiple editors, copied formulas, and manual imports have inconsistent reports over time.
Tools like Looker Studio connect to your data sources and refresh automatically, giving you a visual, shareable dashboard without manual re-entry. The tradeoff is the setup time, because connecting each data source and building the queries takes real effort, especially if you're new to BI tools.
Purpose-built platforms handle the data connections, refresh schedules, and client-facing delivery for you. You still get full customization, but without building the plumbing yourself. Most agencies end up on this format once they start managing more than a handful of clients, because it scales without adding manual work per account.
Dedicated reporting platforms like Reporting Ninja become increasingly valuable once reporting becomes a repeatable business process rather than an occasional task.
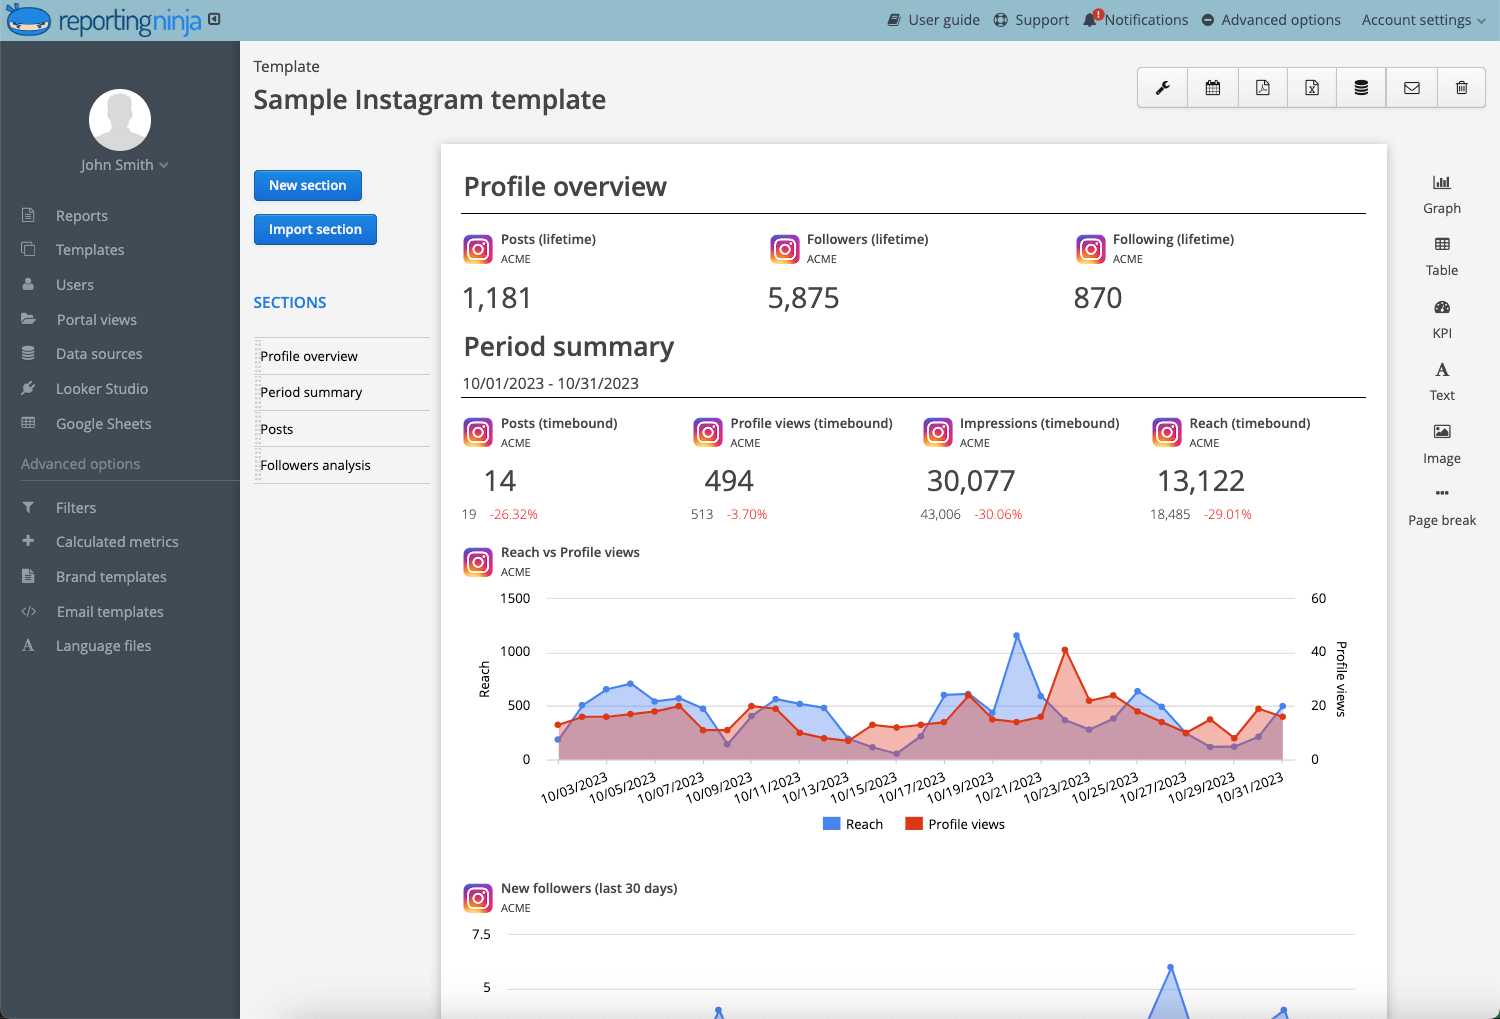
They centralize data from dozens of marketing platforms, provide customizable report templates, automate report generation and scheduled delivery, and support white-label branding so clients receive consistent, professional reports without manual work.
With such dedicated tools, teams can focus on interpreting results and communicating insights rather than piecing together scattered integrations.
Once you've chosen the right dashboard approach, the next step is building a reporting workflow that stays useful over time. Regardless of the tool you use, the process follows the same core principles.
Start by naming who reads which dashboard and what they need from it. An agency client wants proof of ROI and growth trends, while an internal marketing lead might want to know what to adjust next week. Trying to serve both audiences with one generic set of metrics usually means at least one party doesn’t get what they actually need.
Pick three to five KPIs per platform, tied to the goal that platform serves. If Instagram exists to build brand awareness, pay more attention to reach and follower growth compared to click-through rate. If LinkedIn is driving lead generation, clicks and conversions matter more than likes.
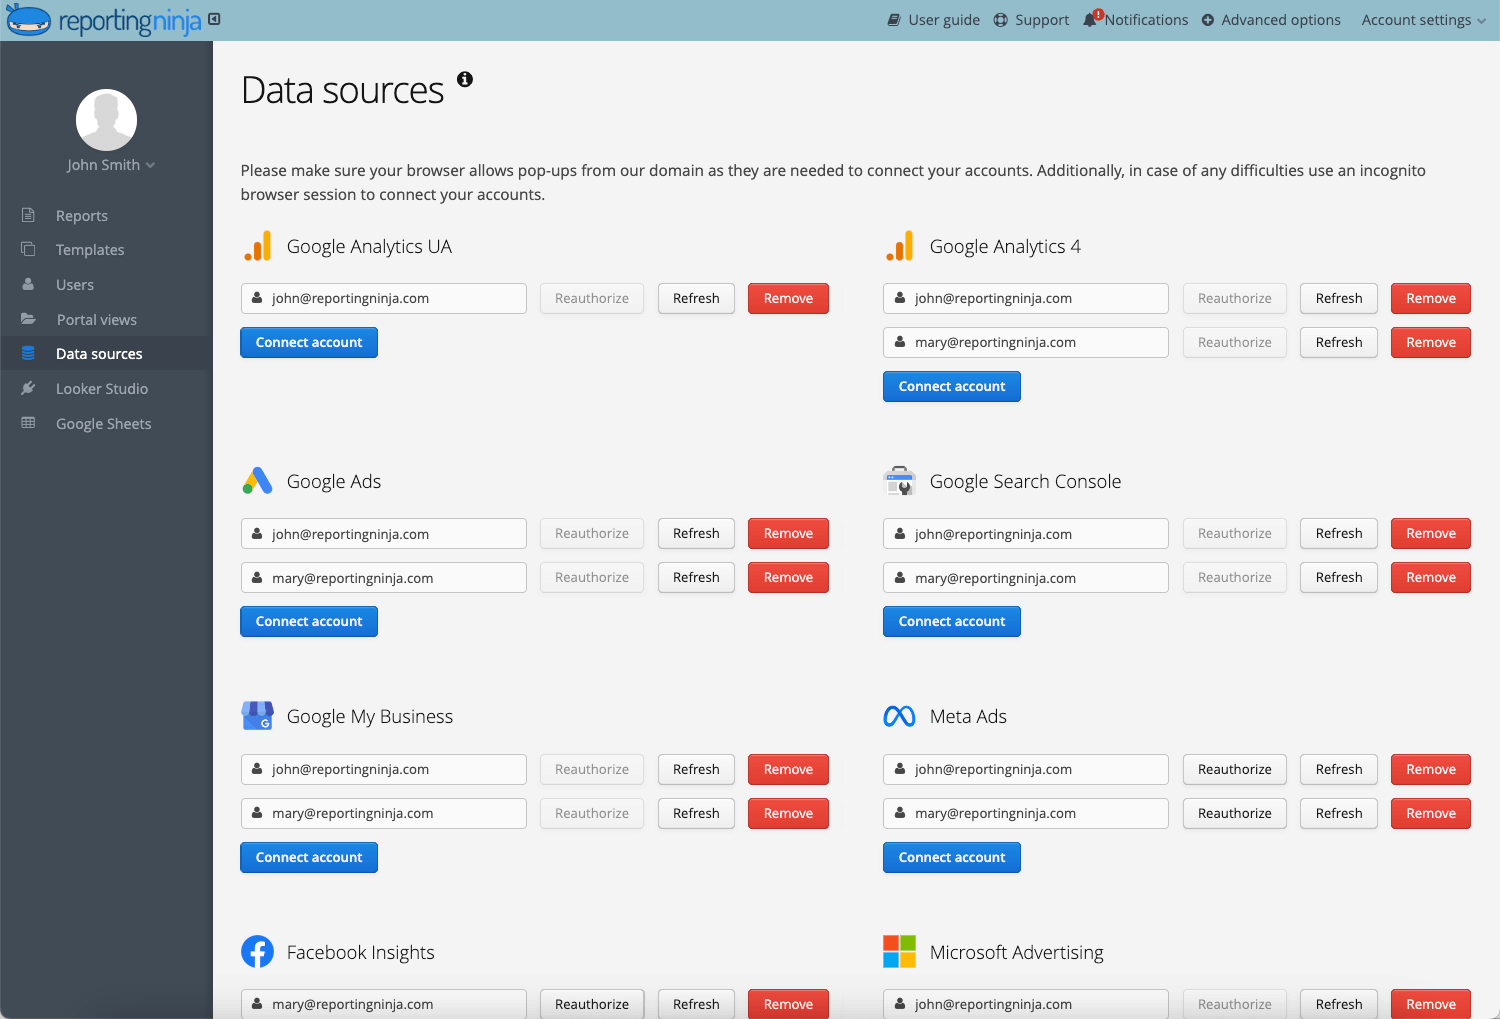
Data collection is often the most time-consuming part of building a dashboard because every additional platform introduces another data source, authentication process, and reporting format. Before connecting data sources, verify that every platform measures metrics the same way. Skipping that step is how misleading comparisons end up in a client report.
Native exports require repeated downloads every reporting cycle, while connectors and dedicated reporting tools synchronize fresh data automatically once configured. Although manual exports cost less upfront, automated integrations reduce repetitive work as reporting volume grows.
Match the format to your account volume from the types above. A freelancer with two clients is well served by a spreadsheet. An agency managing fifteen client accounts across four platforms each is maintaining over 60 separate account-platform combinations, at which point updating dozens of reports by hand stops being a workflow and starts being the main job.
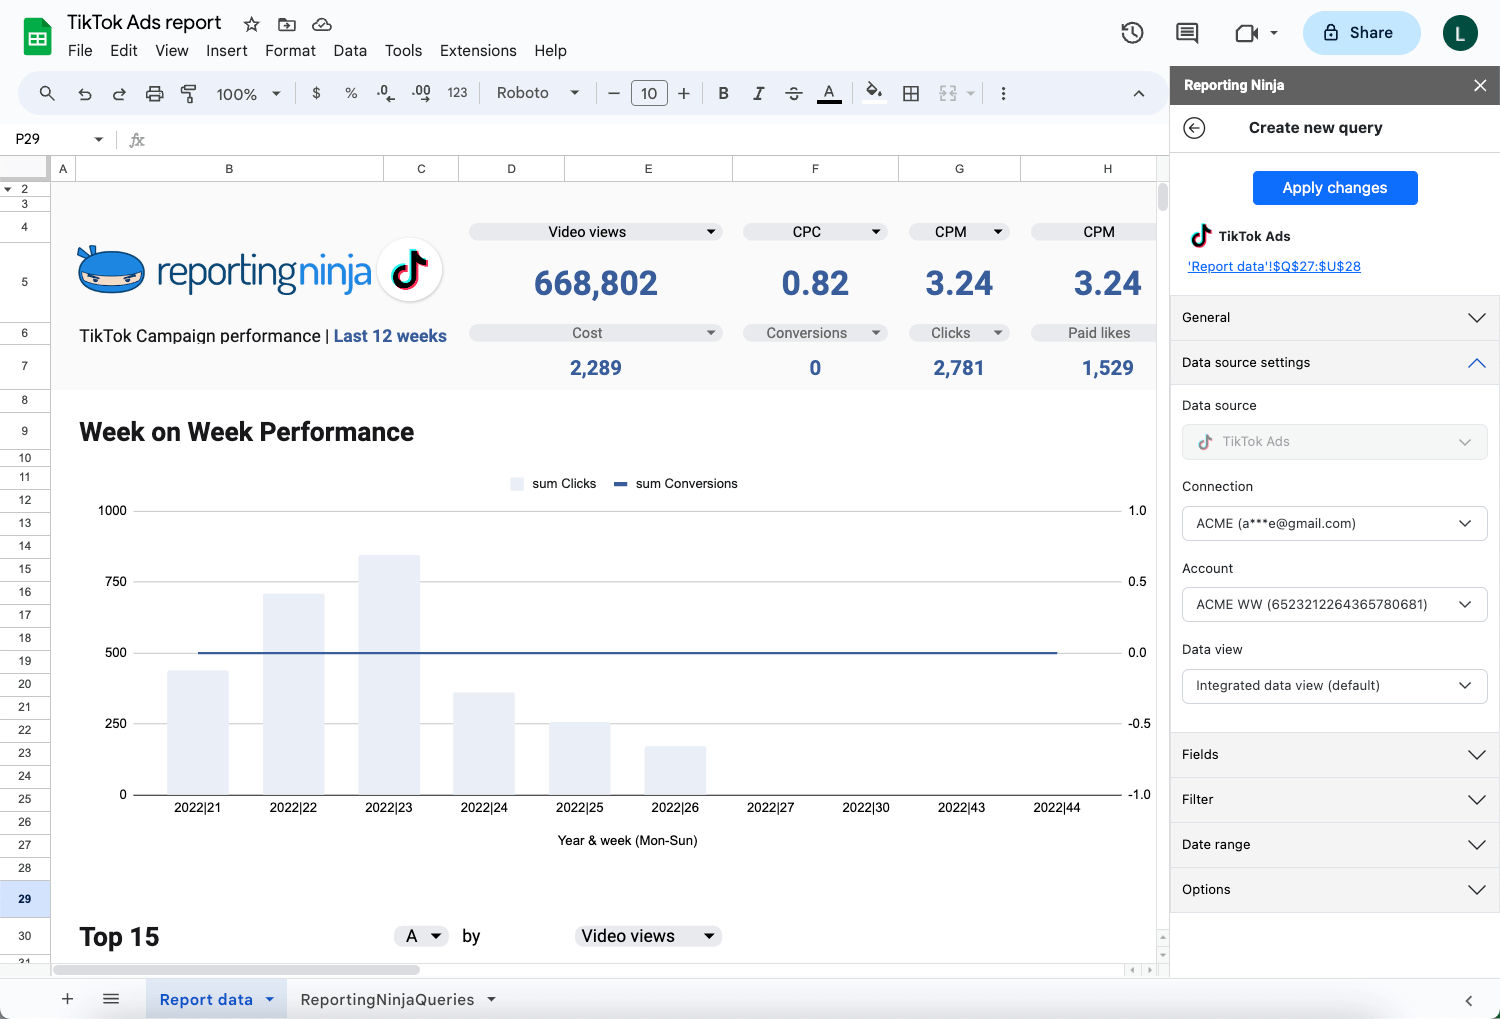
A comprehensive reporting tool like Reporting Ninja gives you multiple ways to present your data, including Looker Studio connectors, a Google Sheets add-on, a REST API, an MCP, and a custom reporting platform. It scales with you as you grow instead of asking you to switch to a more capable platform.
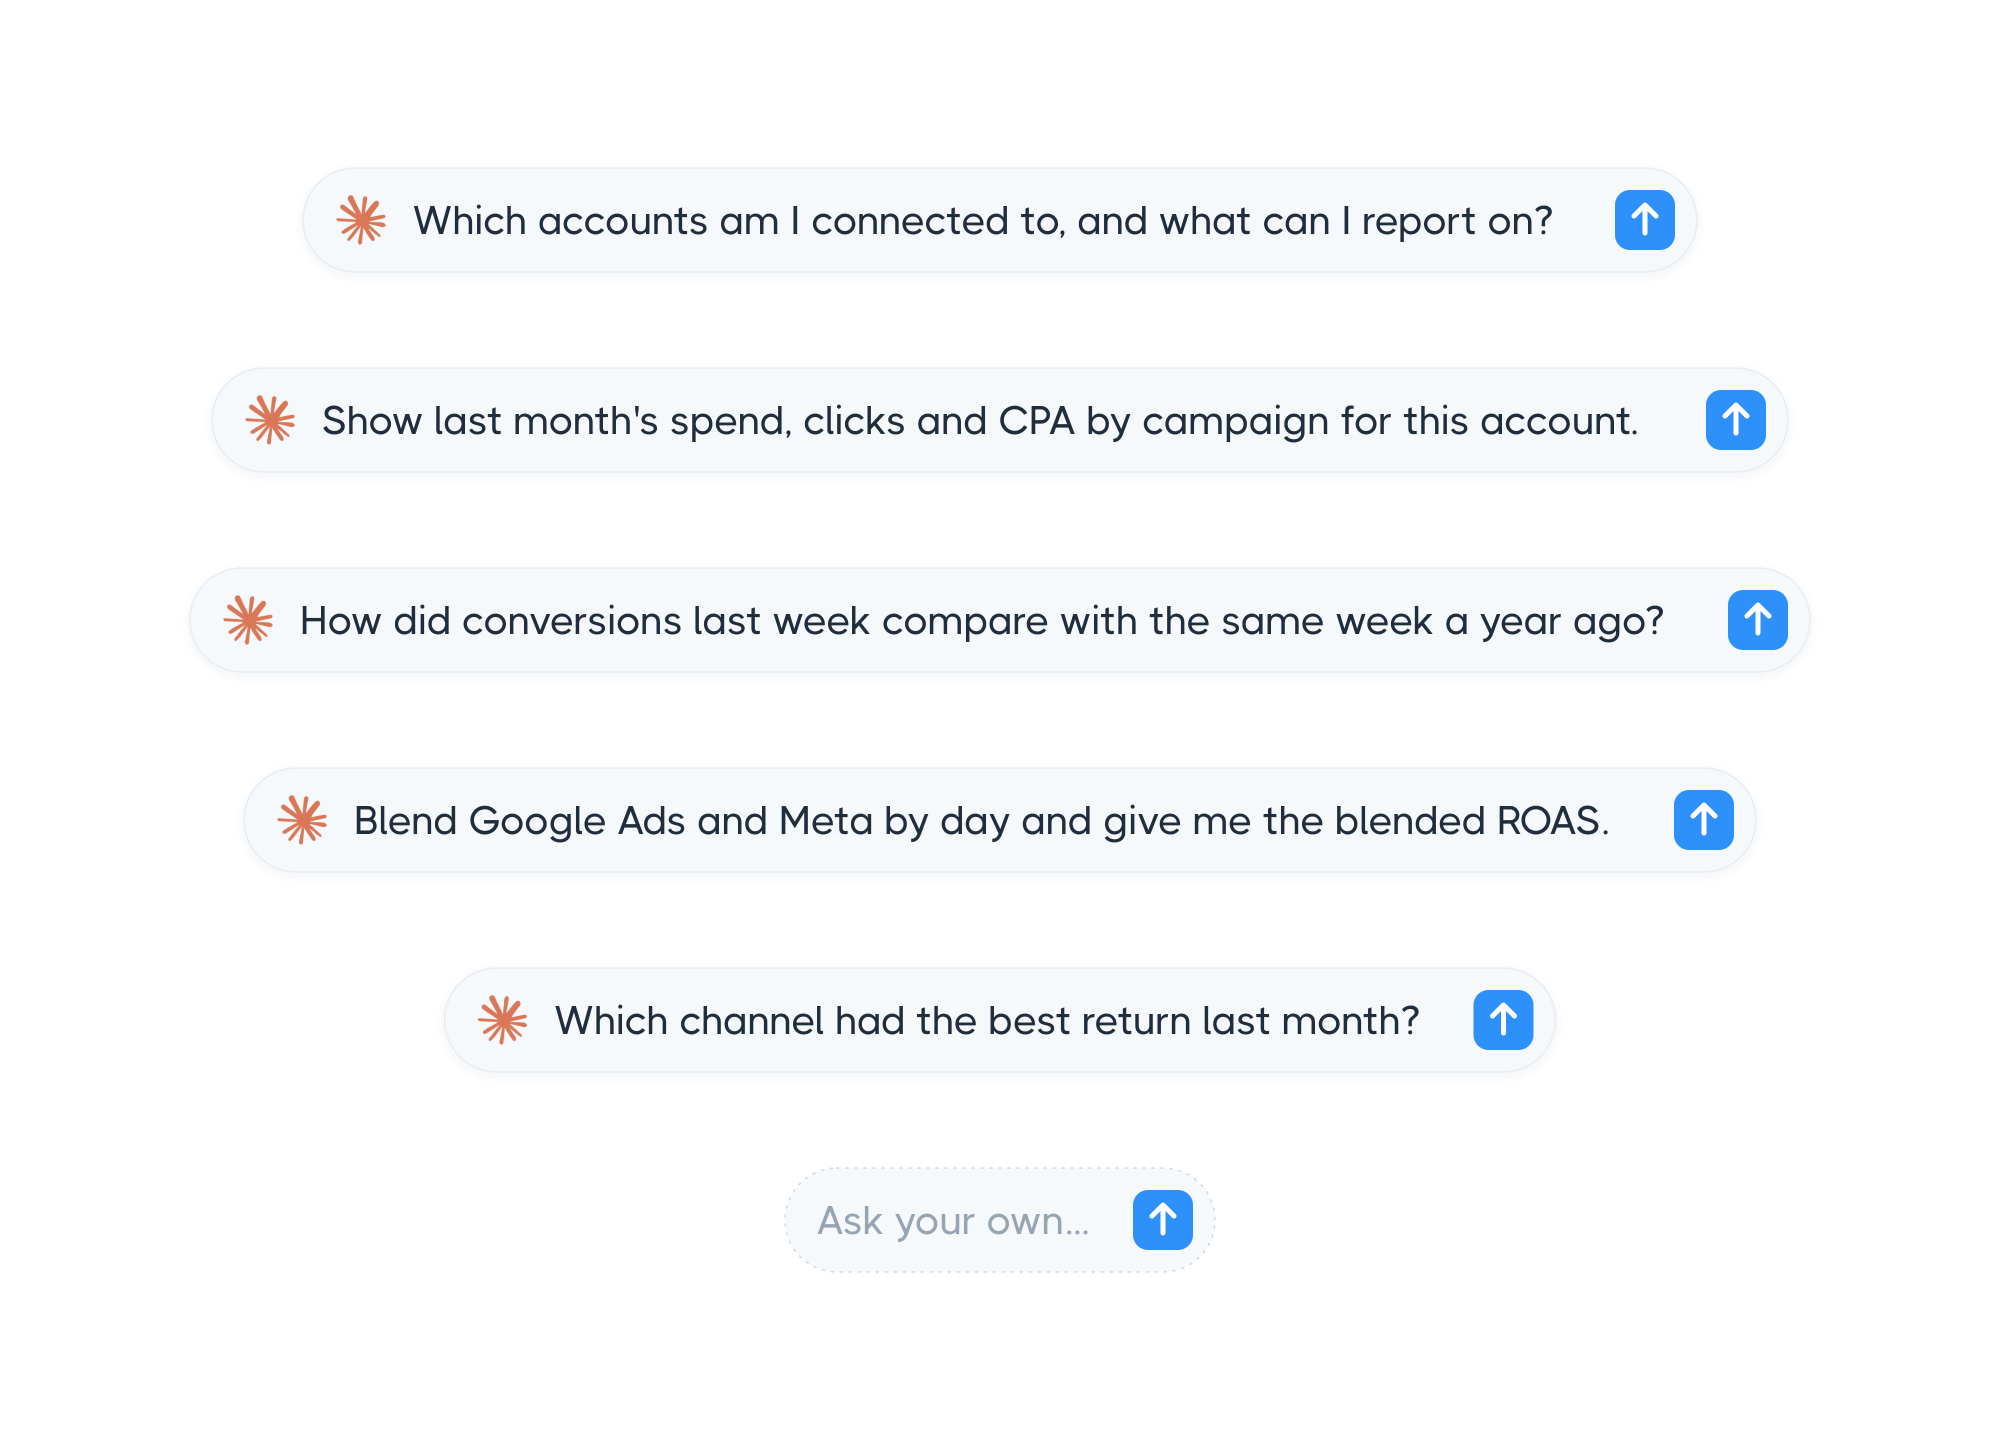
Want to analyze your social media data using natural language? Explore the Reporting Ninja MCP for your AI tools.
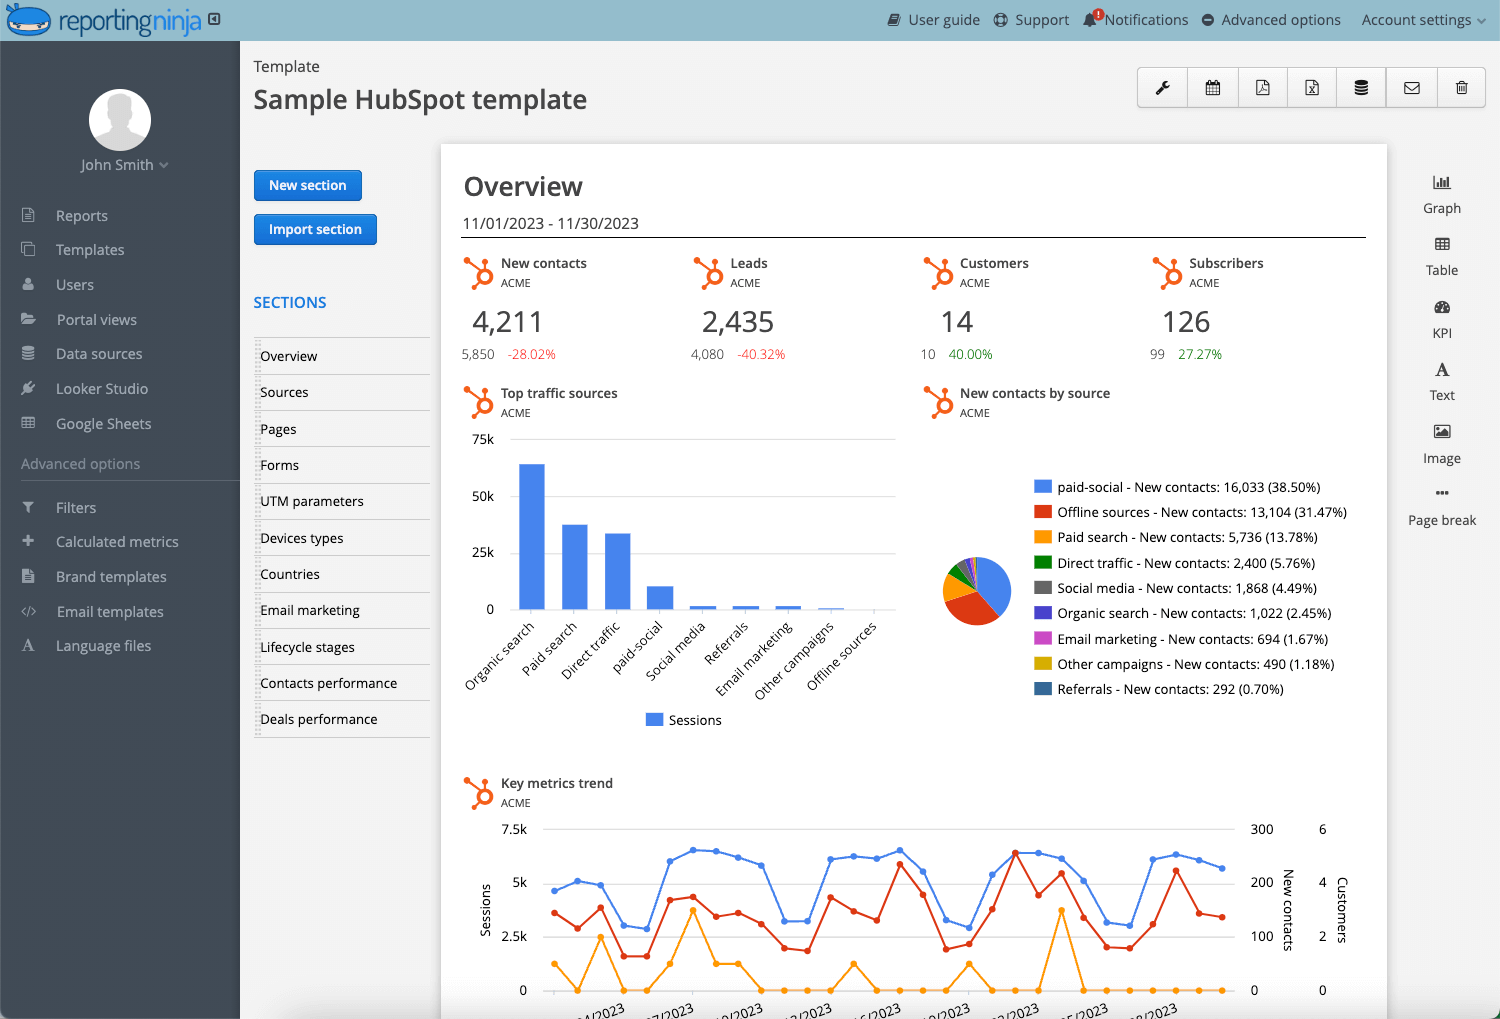
Resist the urge to include every metric you have access to. A client-facing dashboard should lead with the two or three numbers that answer "Is this working?" Supporting metrics can sit below the headline KPIs, but they shouldn't compete for attention.
As Data Storytelling author Brent Dykes has put it, dashboards are primarily exploratory tools, not explanatory ones. Their job is to help someone spot a trend quickly, not to argue a case the way a written report does.
When creating your dashboard, use clear section headers, consistent chart types across reporting periods, and callouts on anything that changed significantly. If a metric moved because of a platform algorithm change rather than your work, say so directly. Clients trust dashboards more when the context is honest, not just favorable.
Building the dashboard once solves half the problem. The other half is making sure it reaches the right person on schedule without someone manually exporting and emailing a PDF every month.
This is where a tool like Reporting Ninja becomes most valuable. Once your data sources are connected, reports can refresh and deliver automatically on a weekly, biweekly, or monthly schedule, turning reporting into a repeatable workflow instead of a recurring administrative task.
Agencies that automate report delivery stop repeating the same manual export process for every client, every cycle. Start your free Reporting Ninja trial and set up your first automated dashboard today.
{{cta-block-v1}}
There's no universally "better" option between building your own dashboard and using a reporting platform. Building your own dashboard from scratch gives you full control, but it also means you own every connection, refresh, and formatting fix going forward. A dedicated reporting tool trades some of that granular control for automation you don't have to maintain yourself.
Reporting Ninja's Starter plan starts at $20 a month billed annually and includes every integration and feature on every plan. No upgrade is required to unlock the basics. Start your free 15-day trial and compare it against your current setup.
The benefits of centralized reporting are easier to see in real workflows. Below is one verified example and two common scenarios agencies and in-house teams run into often.
Scenario: Martinez Marketing Solutions, a marketing agency managing around ten client accounts, needed a reporting setup that could handle custom metrics, ad spend markup, and branded client reports without per-client add-on fees.
Problem: The agency first tried a competing agency reporting platform whose entry-level plan covered only five clients before requiring per-client upgrade fees and which gated features like custom metrics and branded domains behind a pricier tier.
Solution: The agency switched to Reporting Ninja's Starter plan, which includes every feature and integration regardless of plan level, and only needed one report format per client.
Outcome: The switch cut their monthly reporting cost by over $200 while giving them full access to features that were previously locked behind a higher tier.
Scenario: A common pattern among in-house marketing teams is a single marketer managing social channels for the business and needing to report up to a marketing director monthly. A one-person marketing time like that rarely has the time to build a custom dashboard from scratch.
Problem: Every month, the marketing manager spends several hours collecting LinkedIn, Meta, and Google Analytics data before rebuilding the same executive slide deck. By the time leadership receives the report, the data is already several days old, which means decisions get made on last week's numbers instead of this week's.
Solution: Connecting each platform once through a reporting tool's integrations means the same dashboard refreshes automatically each month, requiring only a quick review before it's shared upward. Leadership receives the report on schedule with current data, while the marketing manager spends their time analyzing campaign performance instead of assembling presentations.
Outcome: The recurring monthly build disappears, replaced by a five-minute check before the scheduled report goes out.
Custom, client-ready reports in Reporting Ninja can pull data from multiple accounts and multiple sources into a single scheduled document. Sign up for a free trial to see how multi-account reporting works on your plan.
Scenario: Individual locations of the same company often post at different frequencies, promote different offers, and serve different audiences. Looking only at company-wide averages can hide underperforming locations because stronger branches compensate for weaker ones.
Problem: Comparing dozens of individual location accounts by hand makes it nearly impossible to spot which locations are underperforming without a consolidated view.
Solution: A dashboard that segments by location while also rolling metrics up to a company-wide view lets leadership scan for outliers quickly, then drill into a specific location's data when something needs attention.
Outcome: Underperforming locations get flagged faster, instead of surfacing only at the end of a quarterly review.
Even a well-designed dashboard can become difficult to use if a few common reporting mistakes aren’t taken into consideration.
A dashboard crowded with every available metric buries the two or three numbers that actually answer the important questions. Pick your core KPIs per platform and don’t get tempted to add "just in case" metrics.
A 3% engagement rate on Facebook ads may represent strong performance for a B2B brand, while the same figure on Instagram may mean something entirely different. If you compare trends over time before comparing platforms, you may end up shifting budget toward the wrong campaign.
Using a single dashboard for all stakeholders often results in reports that overwhelm clients while still lacking the detail internal teams need. Similarly, trying to repurpose an internal dashboard for client use results in double work since you do it manually every time the client requests an update.
Design the client-facing version from the start, even if it means a slightly simpler layout than your internal working view.
Without a clear naming convention across reports and a fixed refresh cadence, dashboards drift out of sync with each other. This most often shows up across a multi-client agency where different team members might set things up differently.
As those inconsistencies accumulate, comparing performance across clients, campaigns, or reporting periods becomes increasingly difficult, even when the underlying data is correct.
When you copy numbers from each platform into a spreadsheet every week, you invite typos, broken formulas, and figures that no longer match by the time anyone reads the report. You also spend hours on work that repeats itself.
Connecting your channels through an automated reporting tool like Reporting Ninja pulls the data in for you, so your dashboard stays current without the manual rebuild.
Once you've decided to use a dedicated tool rather than building manually, these features will matter most when making your selection.
Check that the tool connects natively to every platform you actually use, not just the major ones. A tool that covers Meta and Instagram but requires a workaround for LinkedIn or TikTok just shifts the manual work around rather than removing it.
This is where the breadth of a tool's connector library matters, and platforms like Reporting Ninja that support a wide range of native integrations save you from hunting for workarounds later.
It's also worth checking how frequently integrations refresh and whether they support historical data. A connector that updates only once per day or can't retrieve older data may be limiting for some reporting workflows.
Automation should extend beyond refreshing metrics. Look for tools that also schedule report delivery, reuse templates, and support consistent reporting across multiple clients or departments.
The value usually becomes clear once reporting is recurring rather than occasional. If you're rebuilding the same report every week or month or repeating the process across multiple clients, the time saved often outweighs the software cost.
Customization means tailoring metrics, layouts, and report sections for different audiences, so executives, clients, and internal teams each get information at the right level of detail for the decision they're making.
Reporting Ninja includes white-label branding, custom metrics, and 20+ integrations on every plan, with no feature gating between tiers. Browse our integrations to see which of your platforms are covered.
A social media dashboard only pays off if it keeps working without constant manual upkeep. Whether you build one from scratch or set it up through a dedicated platform, the goal is to stop rebuilding the same report every reporting cycle.
If you're managing recurring client reports across multiple platforms, Reporting Ninja connects your data sources once and handles the refresh, formatting, and delivery from there.
Every Reporting Ninja plan includes the custom reports platform, Looker Studio connectors, and the Google Sheets add-on, so you're not locked into one format. Start your free 15-day trial today.
No. A single, well-built dashboard can pull data from every platform you manage into one view, which is the entire point of building one instead of checking each platform's native analytics separately.
Most agencies and teams refresh weekly or monthly, matching whatever cadence their reporting commitments require. A dashboard connected through automated integrations can refresh far more often without extra manual work.
A dashboard is typically a live, ongoing view of performance, while a report is a snapshot, often delivered on a schedule, summarizing a specific period. Many teams use a dashboard to monitor performance and a scheduled report to formally deliver it to clients or stakeholders.
Sometimes, depending on your setup. Looker Studio offers strong visual flexibility if you're comfortable configuring connectors yourself. A dedicated reporting tool trades some of that manual control for pre-built connections and automated delivery.
Move to a dedicated reporting tool once manual updates start taking more time than analyzing the results. Automation keeps recurring reports consistent as your workload grows.
{{cta-block-v1}}
Sign up for a 15 days free trial. No credit card required.

Build and automate amazing custom reports in a few clicks. Save time, be more productive, impress your clients.