Social
August 13, 2026
LinkedIn analytics report template (and reporting tips)

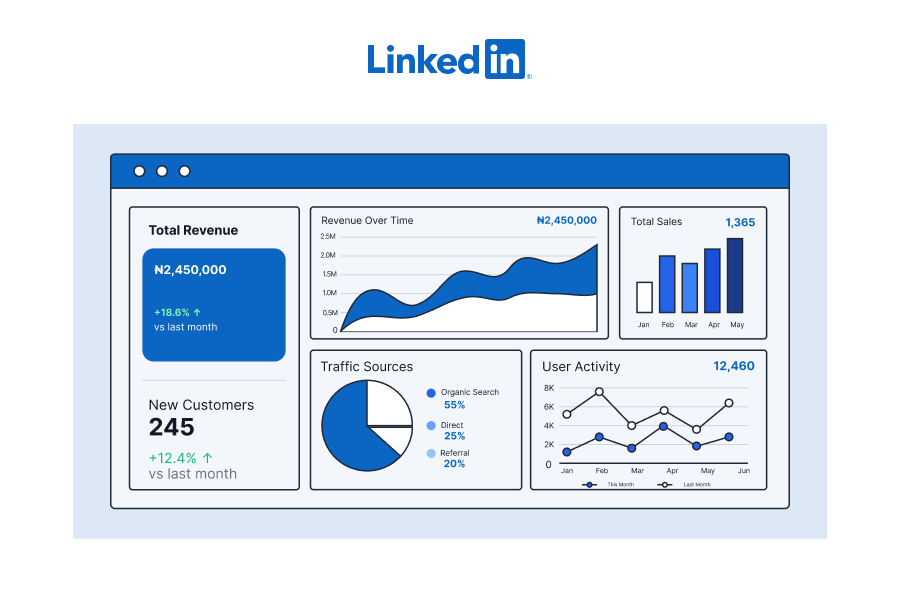

Exporting LinkedIn data, rebuilding the same charts, and reformatting the same document every month is work that produces nothing new. A LinkedIn analytics report template removes it by fixing the structure once, so you can simply refresh the data each time instead of rebuilding the report.
This guide covers what belongs in one, five ready-to-use formats for different reporting needs, and how to connect LinkedIn Pages and LinkedIn Ads in a tool like Reporting Ninja so the report builds and sends itself.
A LinkedIn report earns its place in front of a client when every section answers a specific question about the page or the campaigns. Use the table below as the roadmap, then fill each section with metrics that influence a decision.
The importance attached to each section depends on who you are:
Follower count on its own tells you very little. Report how fast the audience is growing, where the new followers came from, and whether they match the client's target audience.
For B2B pages, breakdowns by industry, job function, seniority, and company size carry more weight than the total. A page that gains 80 followers who match the target audience is doing better than one that gains 200 from the wrong industries or the wrong seniority levels.
Show growth as a trend rather than a single number. Comparing at least three reporting periods makes it possible to see whether a content change, a campaign, or a targeting change affected the rate.
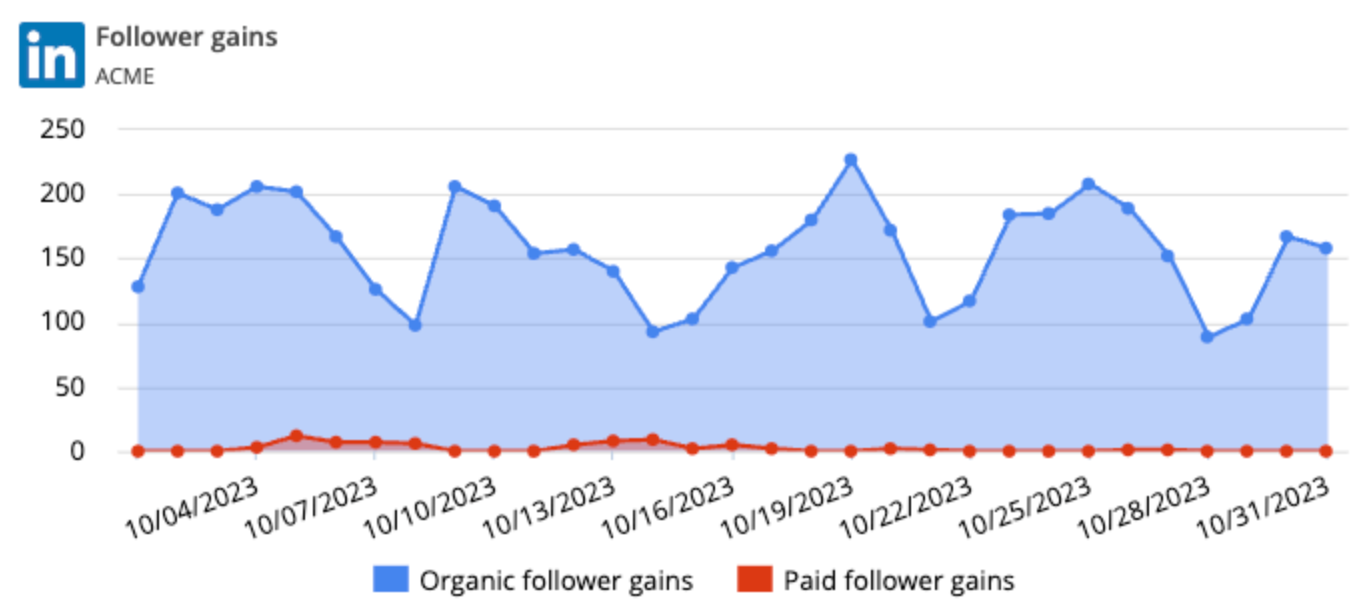
Then explain the movement in a sentence. If growth rose after a thought-leadership post performed unusually well, or after a follower campaign launched, say so. The number becomes useful once the client knows what caused it.
Impressions show reach. Engagement rate, which is reactions, comments, shares, and clicks divided by impressions, shows whether that reach produced interest. CTR matters for any post carrying a link, because a post can engage people and still send nobody to the site.
Read the three together. A post can generate a large number of impressions and almost no engagement, while a smaller post can produce strong engagement or clicks. Ranking by any single metric will mislead you.
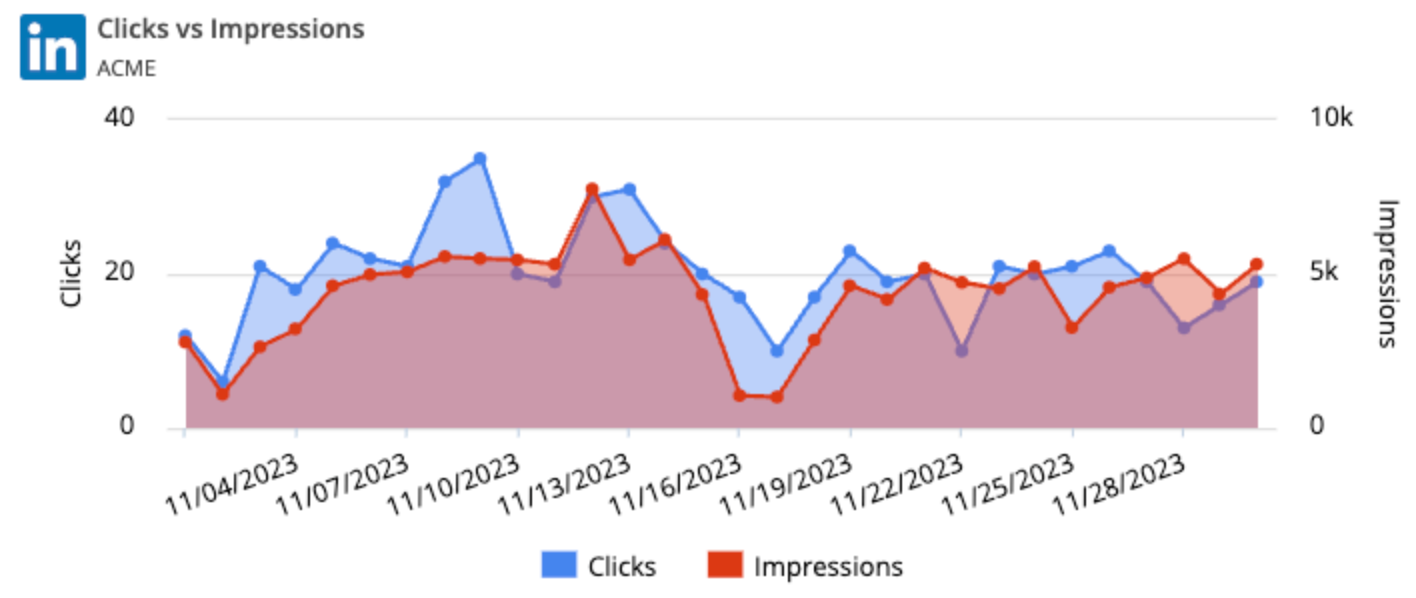
Break performance down by format, covering text, image, video, document, and poll, so the client can see what their audience responds to. Then list the top posts by engagement rate or CTR rather than by likes.
Followers and page visitors are different audiences, so report them separately. Visitor data often reveals interest that follower numbers miss entirely.
Track LinkedIn metrics like page views, unique visitors, and visitor demographics wherever they’re provided. Industry, job function, seniority, and company size all help to show whether the people researching the company match the target audience.
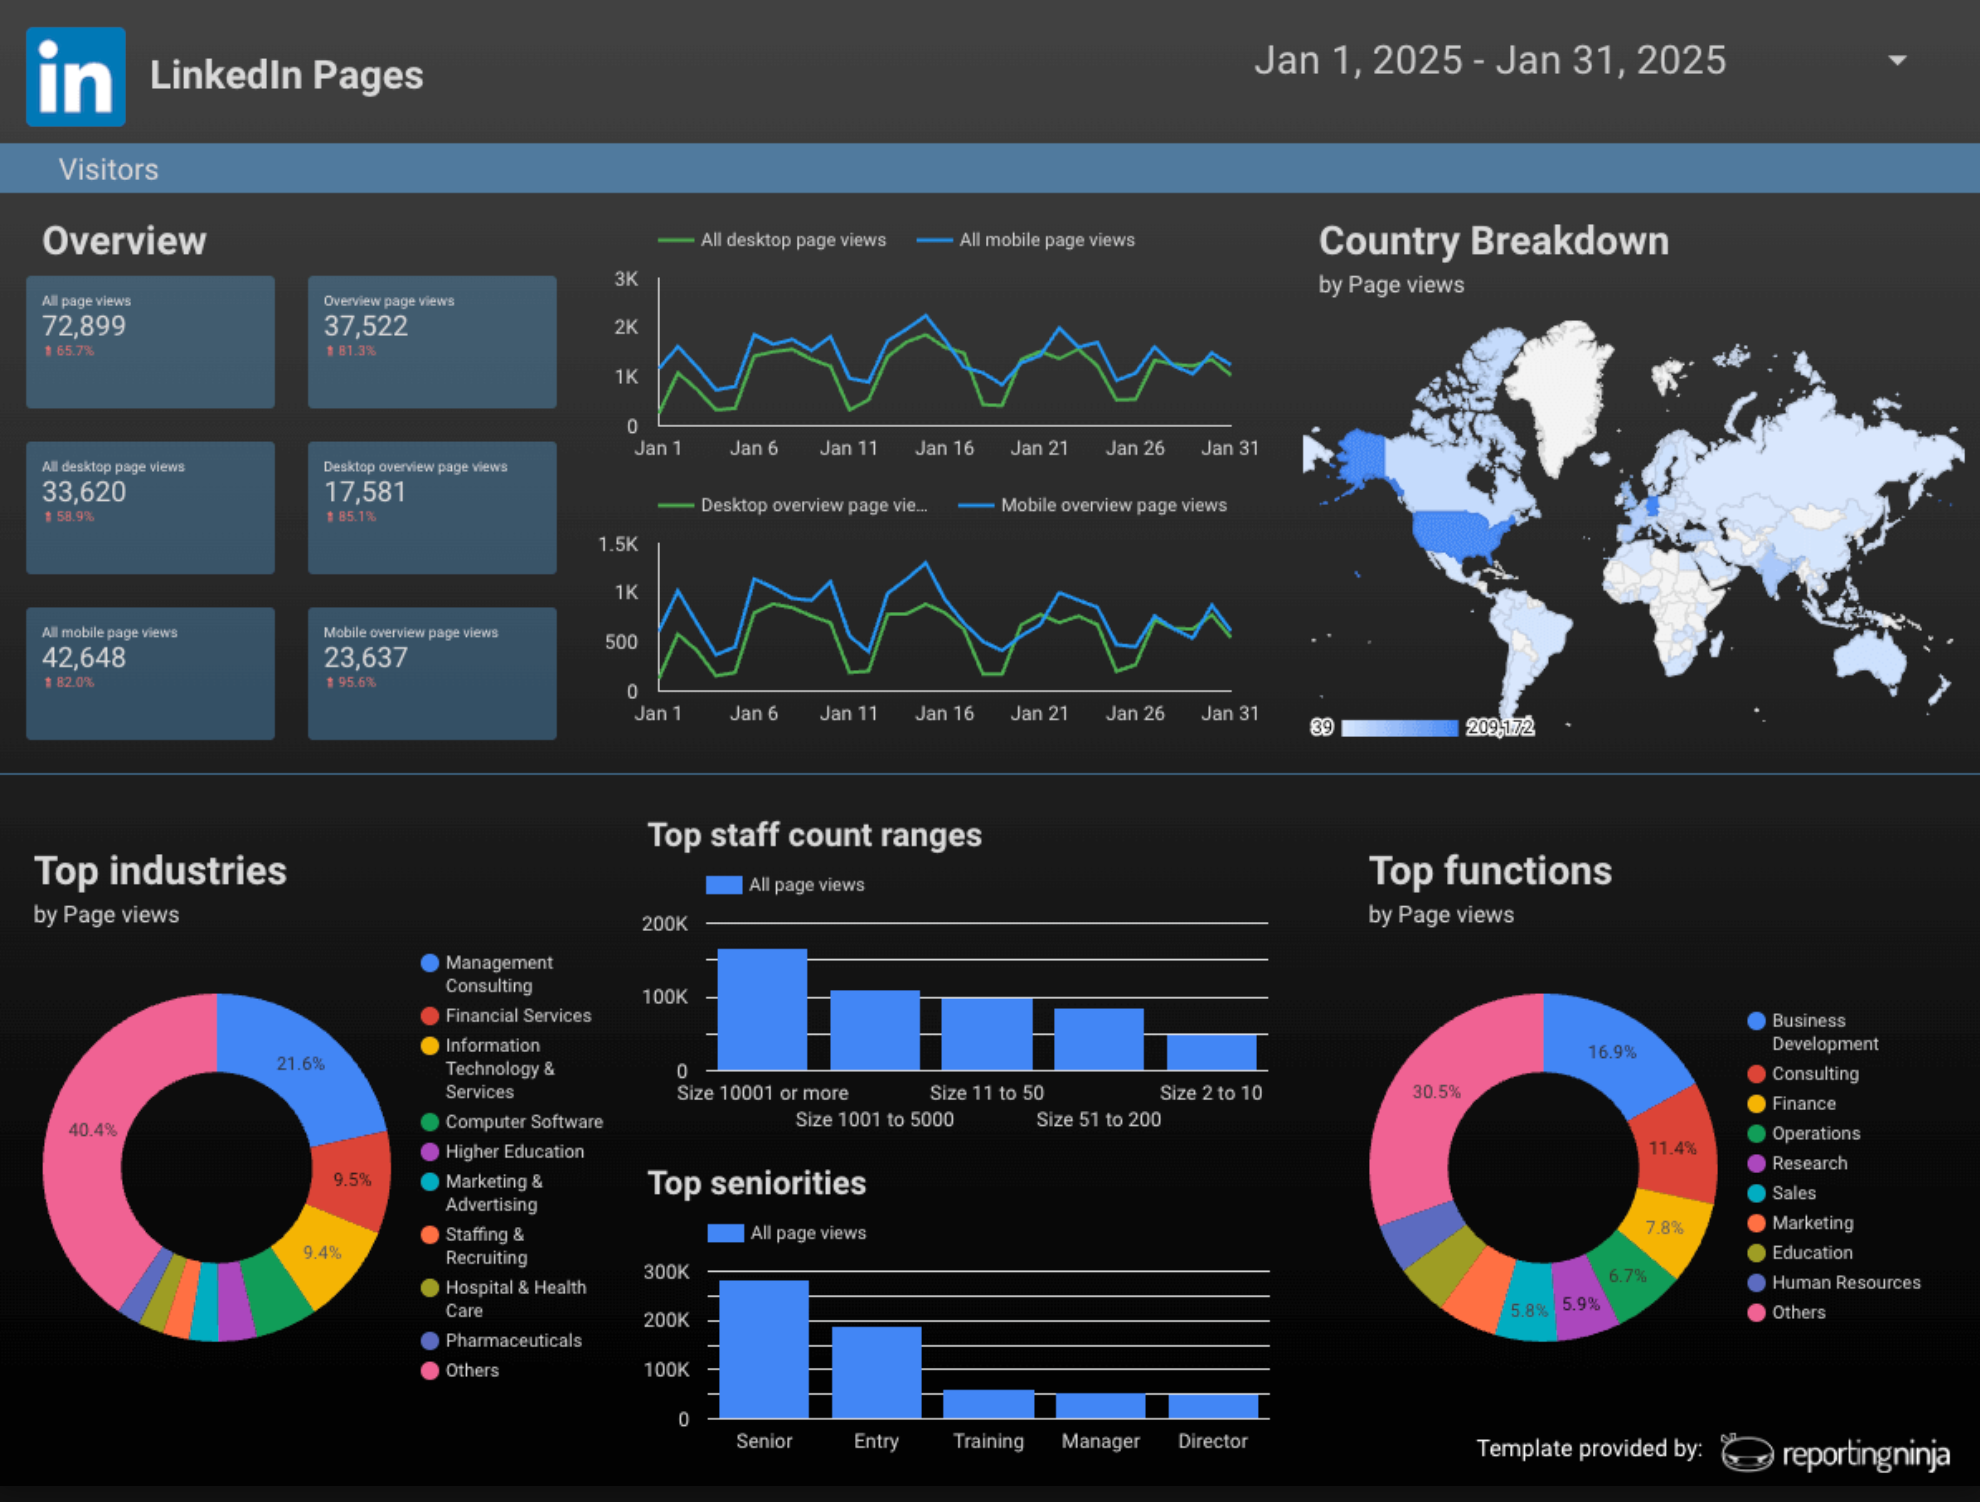
Watch visitor activity alongside follower growth. For example, a spike in page visitors without a matching rise in followers usually means a campaign, a sales push, an external mention, or a strong post sent people to check the company without following it.
Keep paid performance in its own section, separate from organic. Paid campaigns carry different costs, objectives, targeting, and benchmarks, so one combined table makes both harder to read.
Core metrics are spend, impressions, CTR, CPC, cost per lead or cost per conversion, and conversions. Which ones lead the section depends on the campaign objective. An awareness campaign leads with reach and impressions. A lead generation campaign leads with CPL and conversions.
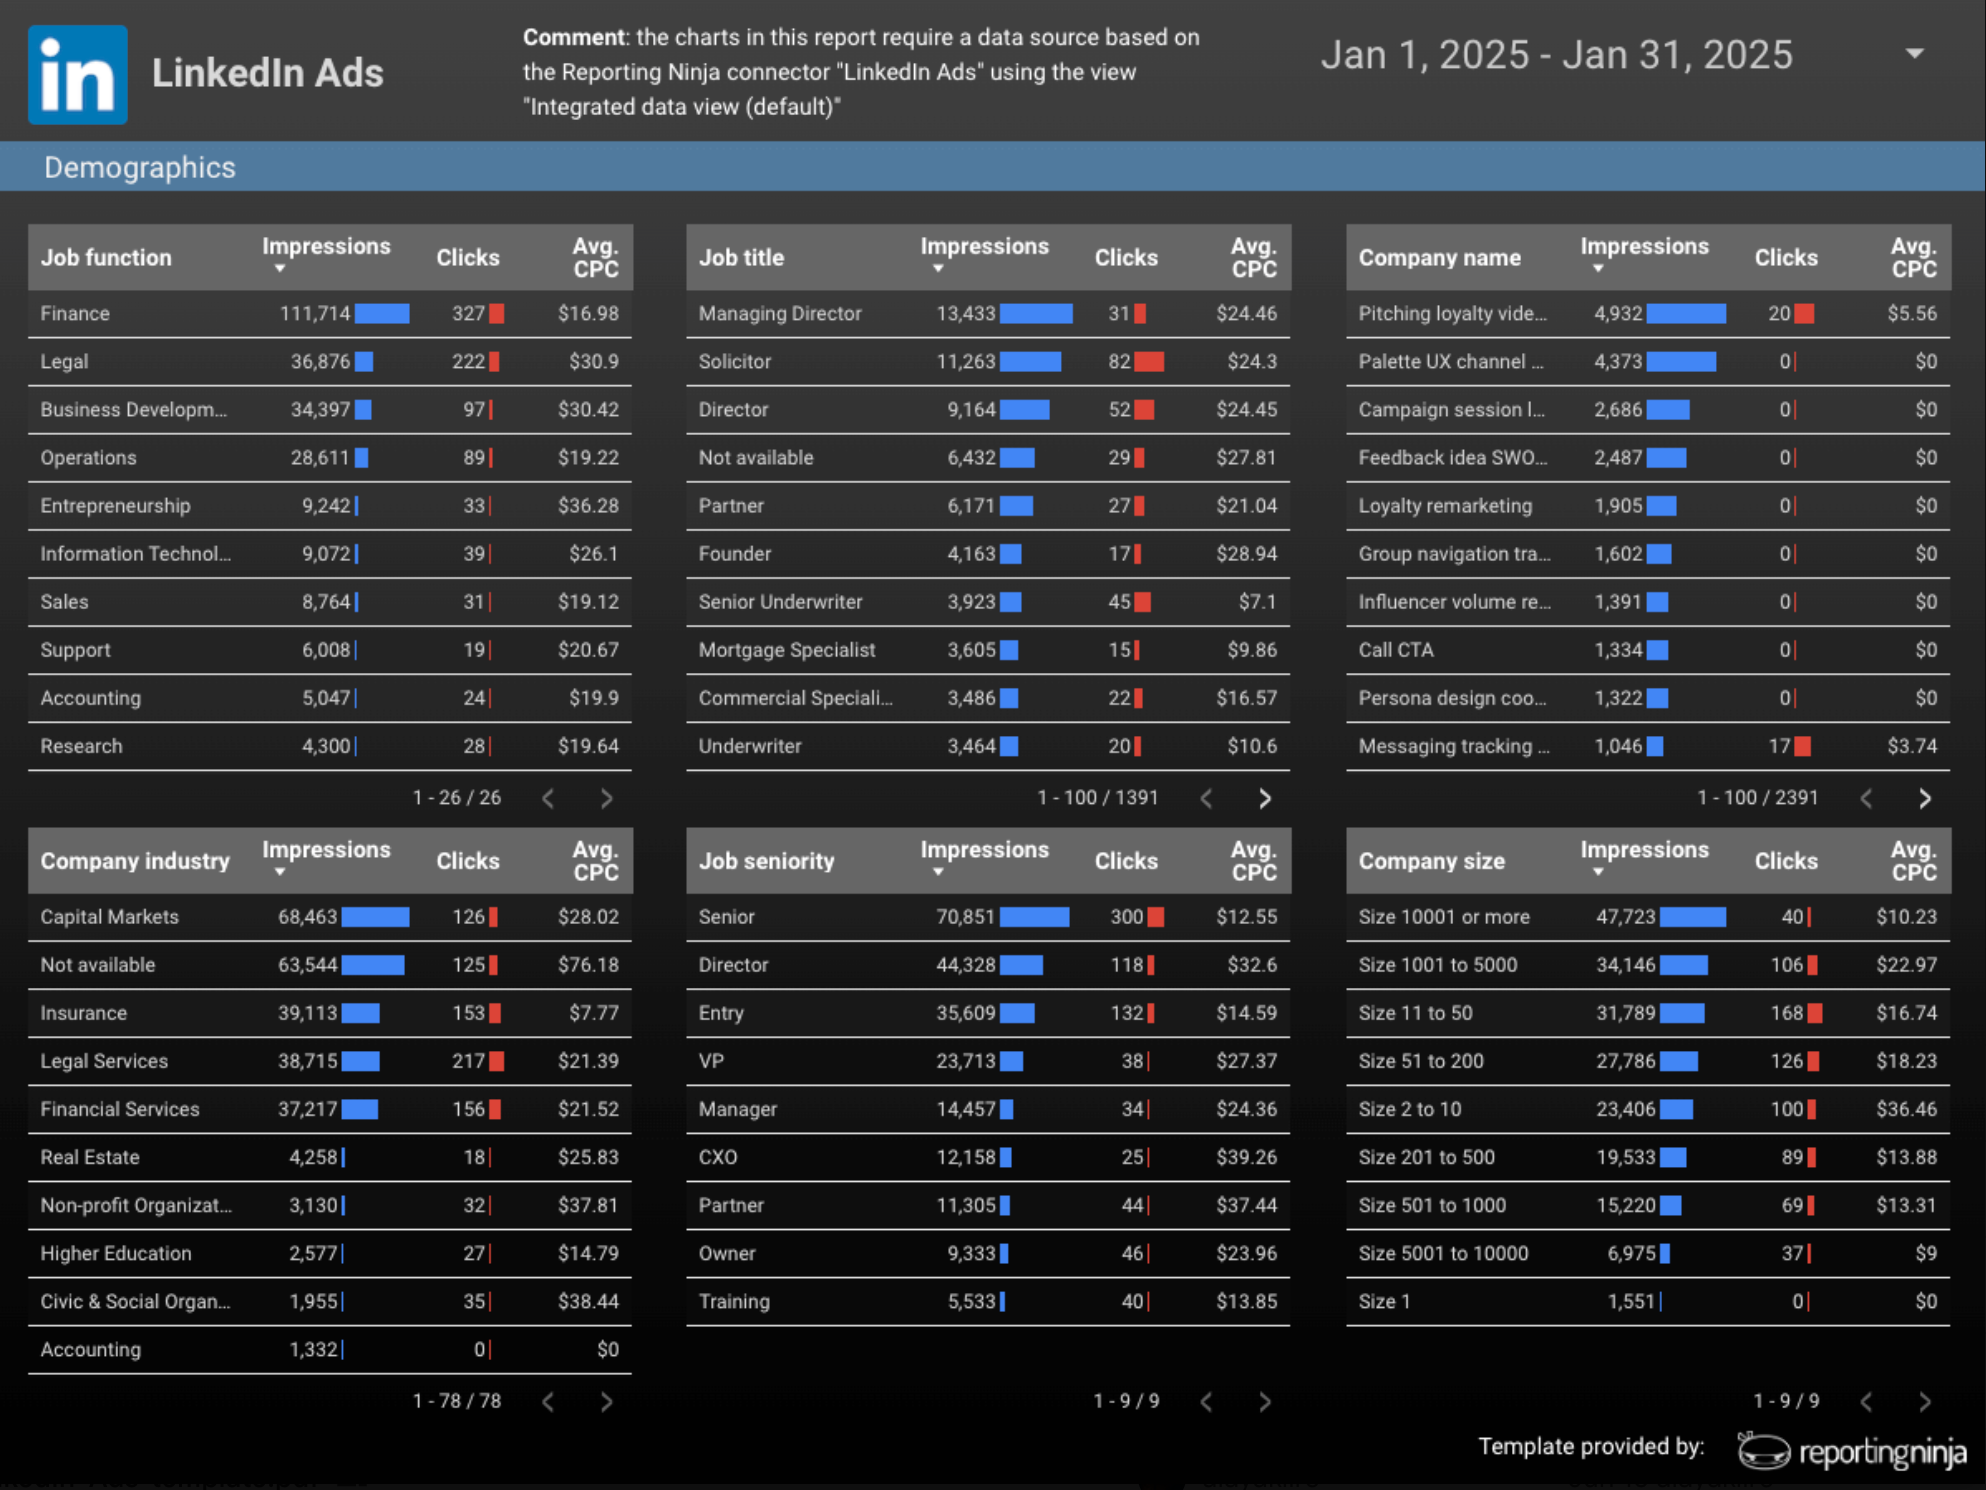
If you run several campaigns for one client, add a short table ranking them by cost per lead or by ROAS where revenue tracking exists. That answers "which campaign is working" without making the client read every row.
Reporting Ninja's LinkedIn Ads reporting tool lets you filter results to a single campaign or campaign group, either at the widget level, through reusable filters, or as a global filter on a whole section. You can also add your agency's margin or markup to the cost figures, so the client sees your fee structure clearly.
Try Reporting Ninja for free for 15 days.
Numbers only help when the report explains them. Use this section to turn each major change into three short statements: what changed, why it likely changed, and what you are doing next.
Here is what that looks like:
“Engagement rate rose 18% this month, driven mainly by native document posts. We will increase educational document content next month and check whether the improvement holds across a larger sample.”
This version is more useful than simply reporting an 18% increase without any follow-up.
Keep the commentary specific to the data. If performance fell, name the likely cause and the next test. If performance remains stable, say so and explain why the current approach is still right.
{{cta-block-v1}}
The right format depends on who reads the report and what they need to decide. Below are five structures built around the most common reporting needs, covering organic and paid, in-house and agency. Pick the one closest to your situation rather than adapting a generic template afterwards.
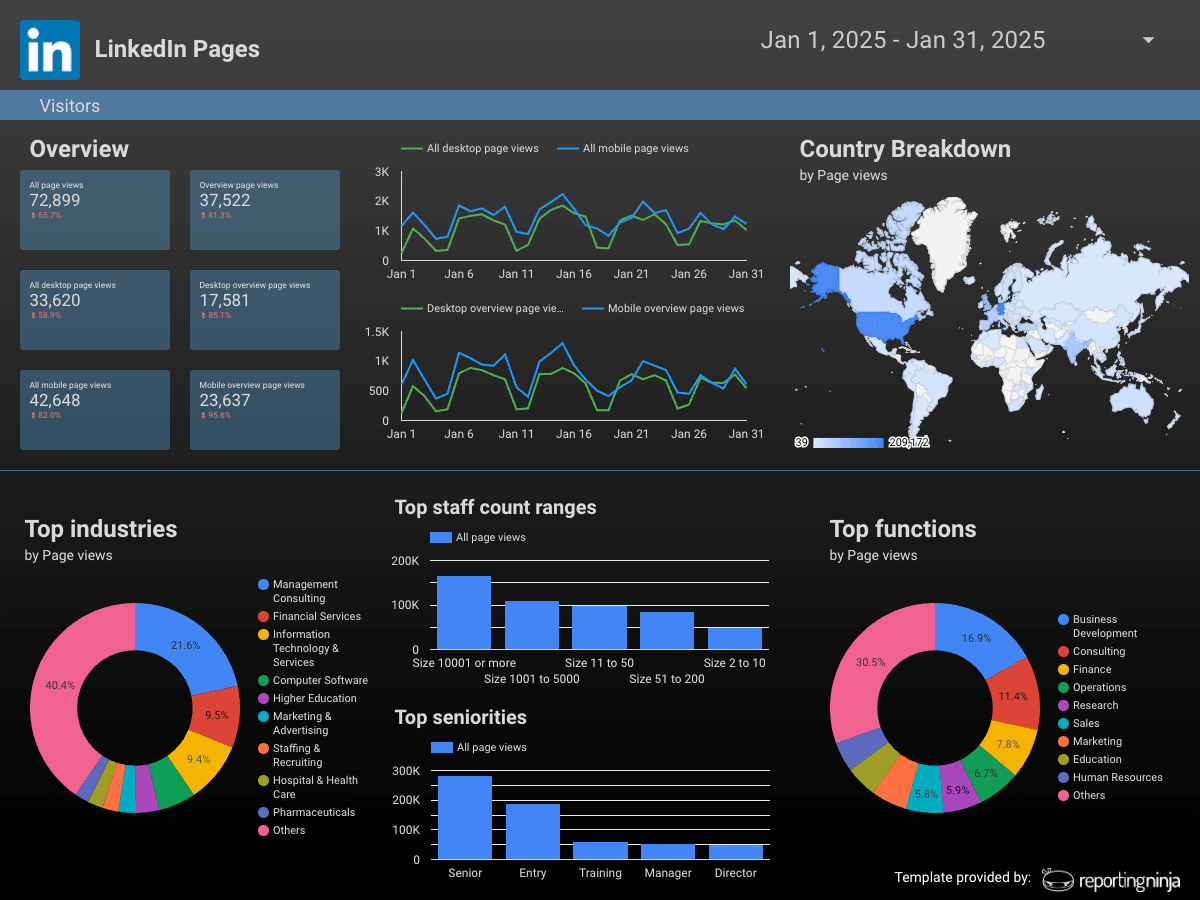
Objective: Track organic page health across a full month, covering audience growth, content performance, and visitor trends in one document.
Who it's for: In-house social media managers reporting to a marketing director and freelancers running organic LinkedIn for individual clients.
Included sections: Follower growth trend with a demographic split, the top five posts by engagement rate, page visitor totals, and a short written summary. This format leaves paid metrics out on purpose so it stays focused on organic performance.
When to use it: Monthly, as the standing format for any page without active ad spend. It also works as the organic half of a combined report for a page that runs ads too.
Reporting Ninja’s free LinkedIn Pages report template in Data Studio already carries this structure. It tracks followers, page views, and post engagement, and it breaks the audience down by industry, job function, and seniority.
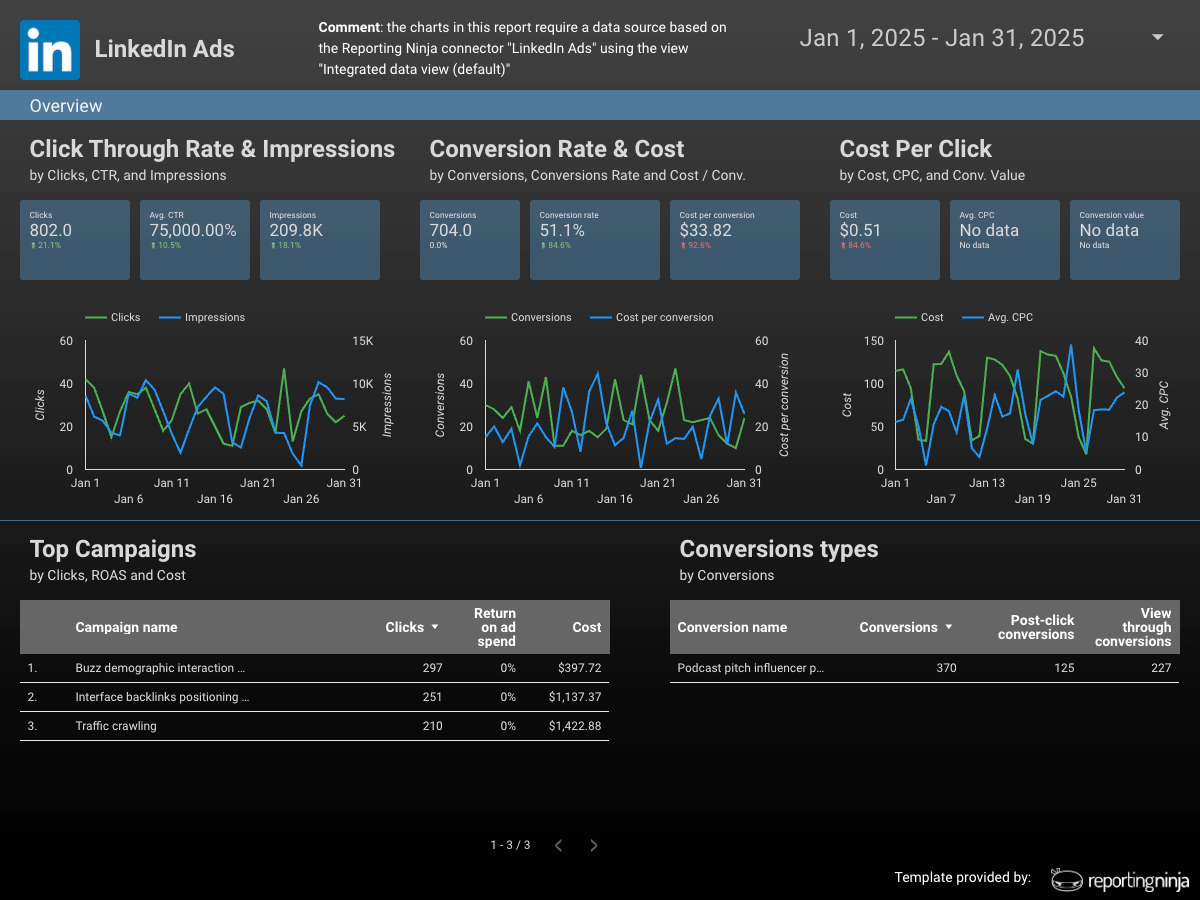
Objective: Show campaign-level paid performance tied to cost and conversions, built for stakeholders who care about return rather than engagement.
Who it's for: PPC specialists, agencies running lead generation campaigns, and in-house demand generation teams reporting against a defined budget.
Included sections: A campaign breakdown by spend, CTR, CPC, and cost per lead. A filtered view for any priority campaign. Audience insights by industry and seniority. A conversion summary tied to the campaign objective.
When to use it: Weekly during active campaign flights for optimization and monthly as the client-facing summary.
Reporting Ninja’s free LinkedIn Ads report template covers impressions, clicks, CTR, conversions, cost, and ROAS across campaigns, demographics, and placements.
If the client runs website conversion campaigns rather than Lead Gen Forms, add custom conversion tracking. Reporting Ninja lets you build widgets that follow specific conversion actions on a given page, which matters because a report built only around lead form submissions will show nothing for those campaigns.
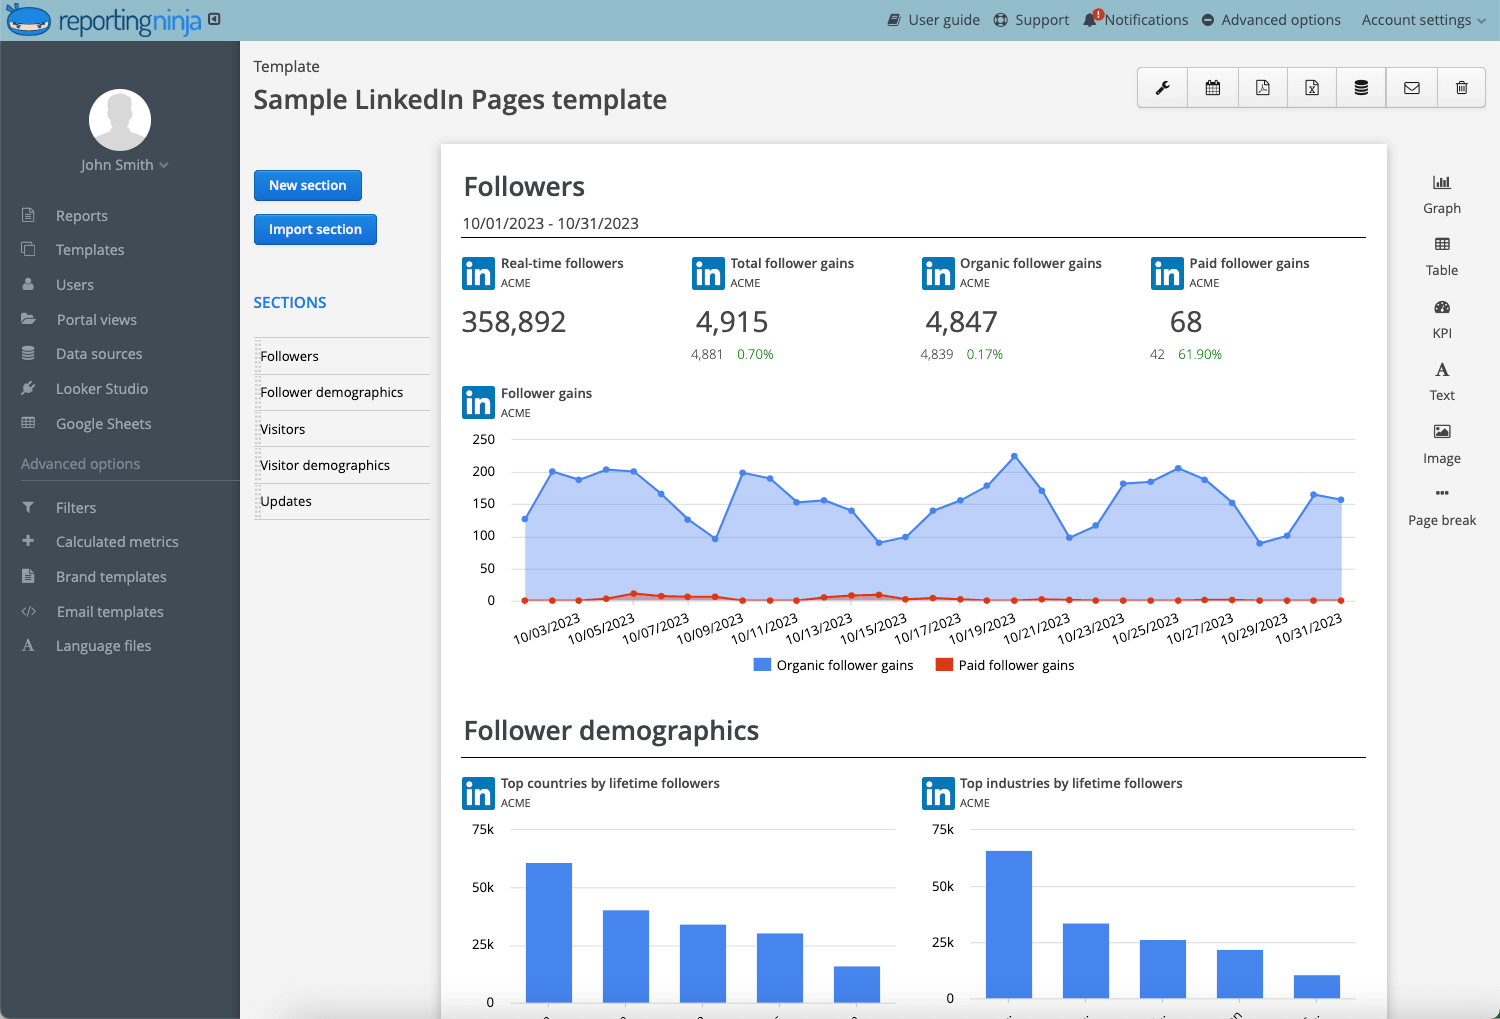
Objective: Compress the full LinkedIn report into a single page for a stakeholder who wants the headline numbers and the takeaway, not the detail behind them.
Who it's for: C-suite and department heads who receive this alongside reports from other channels and will not read a multi-page document.
Included sections: Three to five headline metrics only, usually follower growth, engagement rate, and either cost per lead or a conversion figure. One trend chart. Two or three bullet takeaways.
When to use it: Monthly or quarterly, usually attached to the full report as a cover page rather than replacing it.
This is also the format most likely to get forwarded, so write the takeaways as full sentences a reader can understand without you in the room.
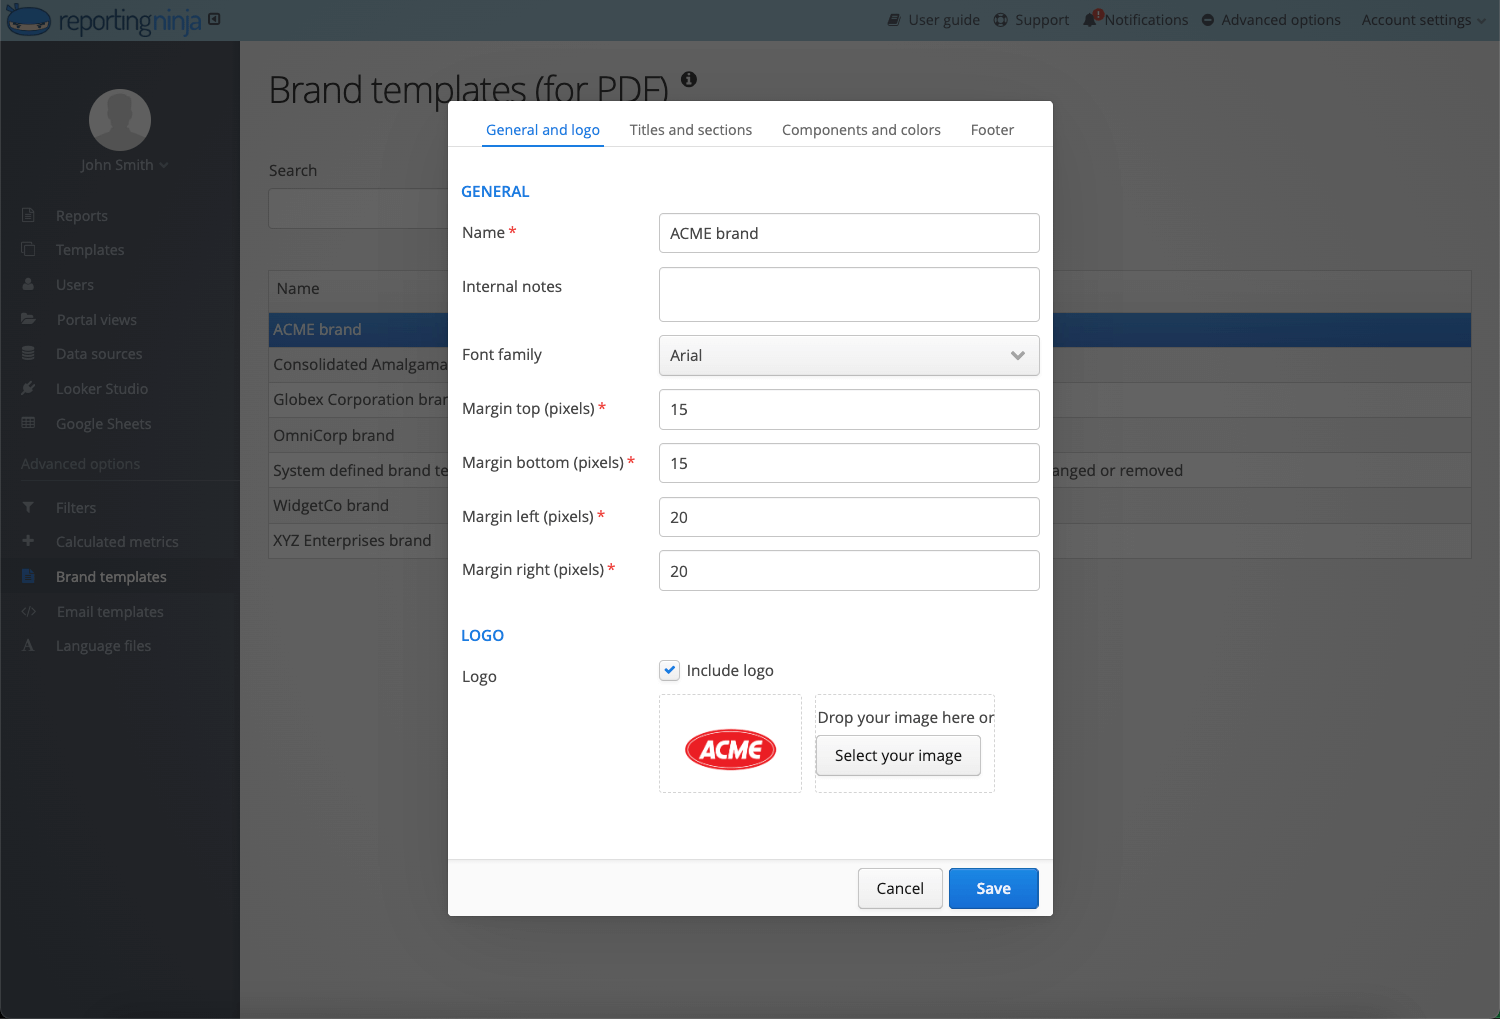
Objective: Present LinkedIn performance under the agency's own brand rather than a reporting tool's, so the client associates the work with the agency.
Who it's for: Agencies and freelancers managing LinkedIn for several clients who need consistent branded reporting without rebuilding a report per account.
Included sections: The same core sections as the monthly page report or the ads performance report, built on a template that carries per-client branding and sends on a schedule.
When to use it: As the standing format for any agency managing more than one LinkedIn account, since template reuse saves more time with each client added.
Reporting Ninja applies your logo, brand colors, fonts, and graph styles and adds cover pages and contents tables. You can share reports as PDFs or open a branded client portal on your own domain so clients log in when they want to.
Explore Reporting Ninja’s custom reports platform to get started.
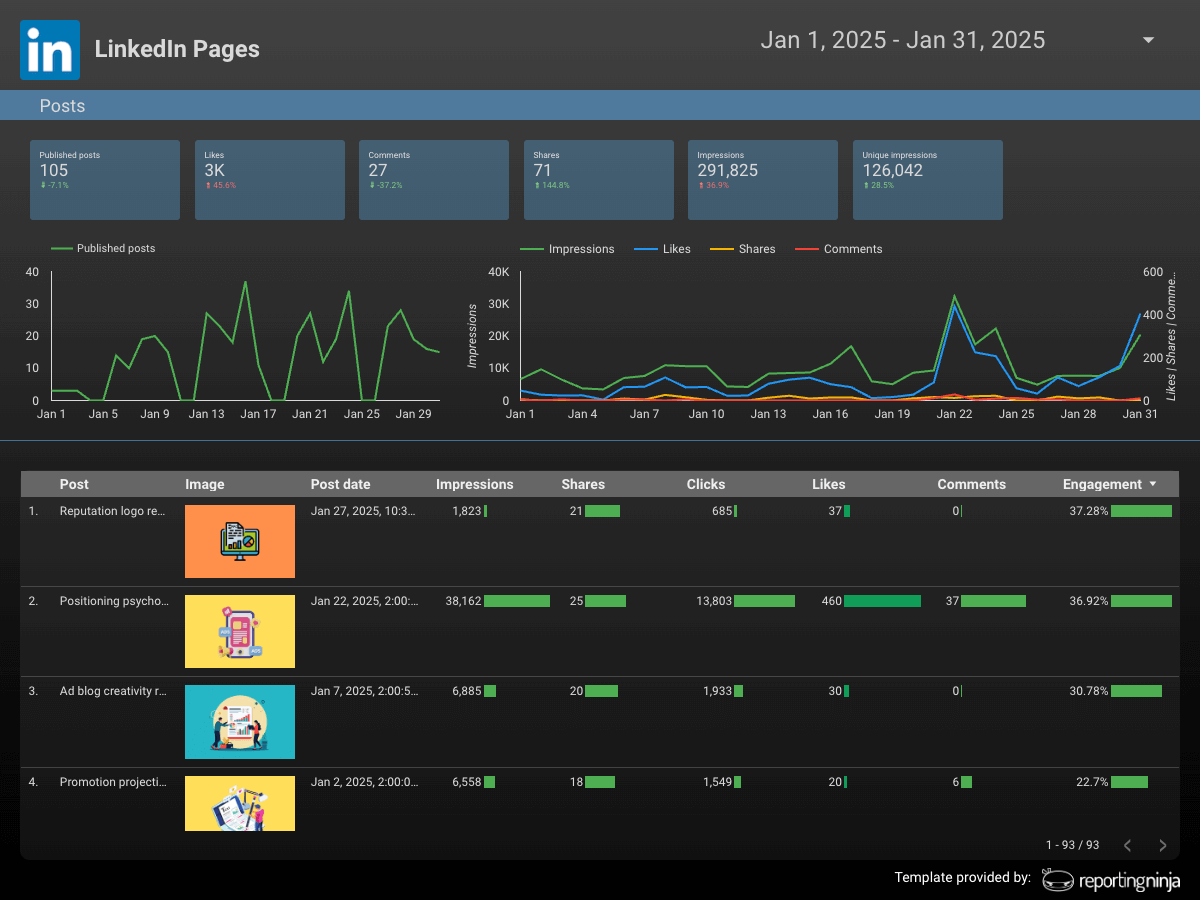
Objective: Go past the summary post-performance section to work out which format, topic, and posting pattern actually produce results.
Who it's for: Content strategists, social media managers defending a content calendar, and anyone testing a new format who needs evidence that it worked.
Included sections: Performance by content format across text, image, video, document, and poll. A posting-time analysis where post volume supports one. A comparison of the top-performing posts against the weakest ones to find the pattern.
When to use it: Quarterly, or whenever a content strategy change needs to be judged on data rather than instinct.
Pair the format breakdown with the Socialinsider benchmarks. Knowing that documents average 7% engagement across the platform tells you whether a client's 6% document performance is a weakness or close to normal.
Reporting Ninja’s LinkedIn templates are free, and connecting one takes a few minutes once your account is linked. Browse the free Data Studio templates to pick your starting point.
Building any of the five formats by hand means exporting from LinkedIn's native analytics, cleaning the data, and rebuilding the layout every period. Connecting the data once and scheduling delivery using Reporting Ninja removes that repeat work.
Side note: Starting with a social media analytics report template can cut down the layout work, while automation removes the repeated data collection.
Connect your LinkedIn Page, your LinkedIn Ads account, or both from the data sources menu in Reporting Ninja. Organic and paid data can sit in one report or stay in separate reports, depending on the format you are building.
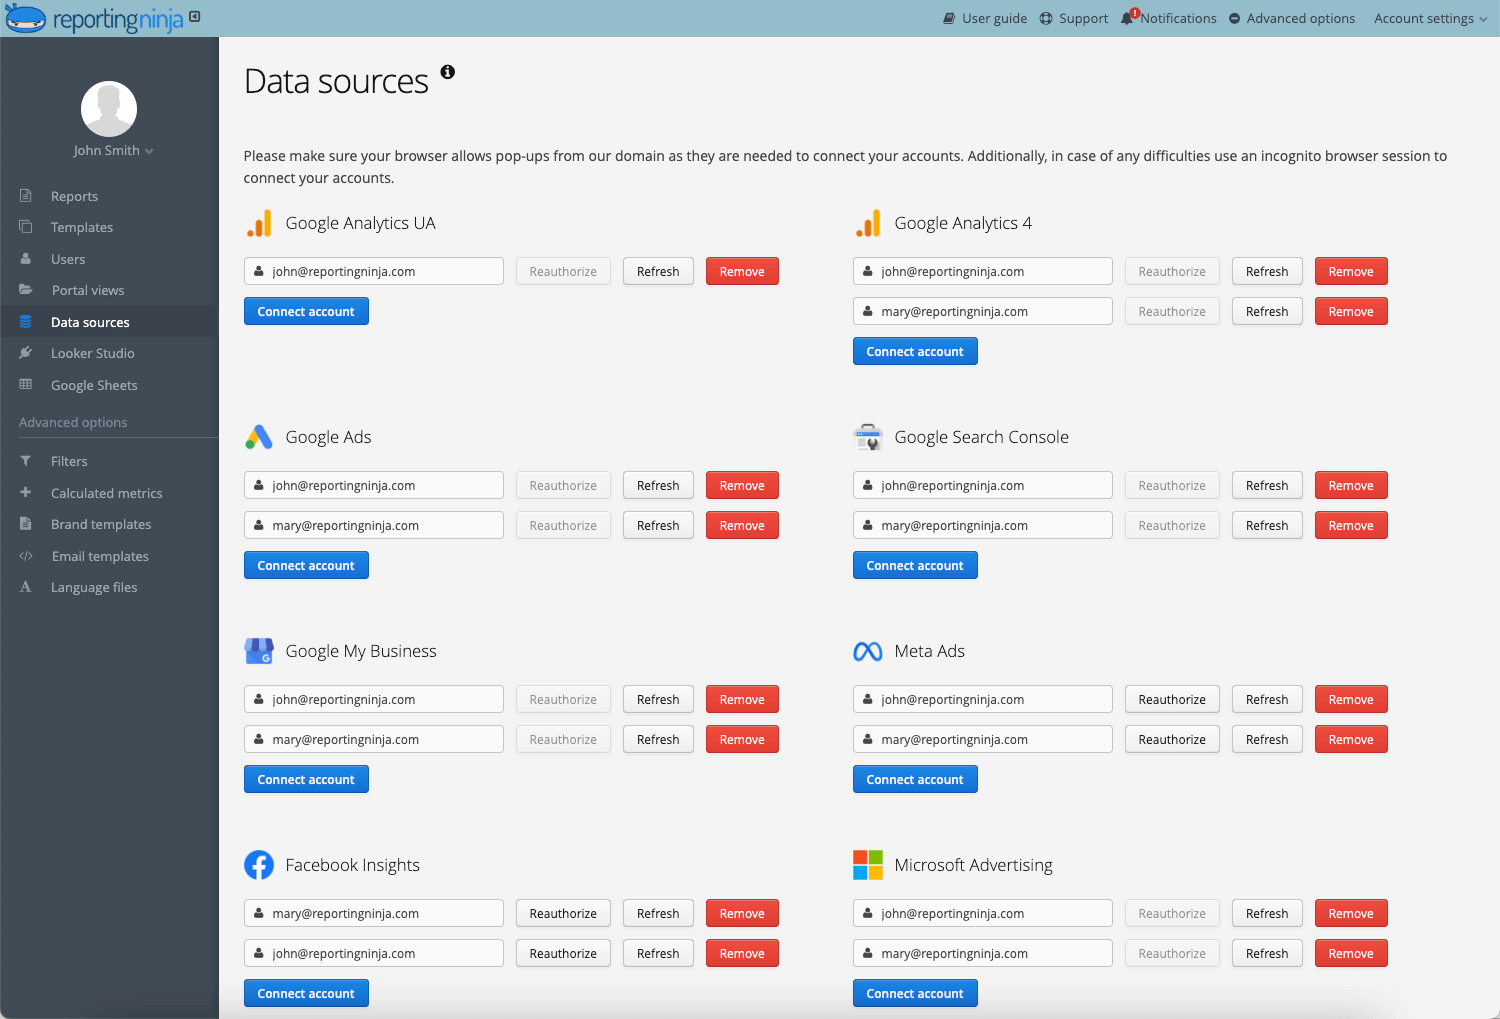
If you manage several clients, connect all their accounts in one session. Name each connection with the client name plus the platform so you can find the right one later without opening each account.
Start from a template that matches your reporting needs rather than an empty report. Then adjust the metrics around the client's objectives. For example, reports for a brand awareness client lead with reach and engagement, while those for a lead generation client prioritize conversions and cost per lead.
If no template fits, build a custom report from the widget library. A wizard walks you through creating widgets with the dimensions, metrics, chart type, and filters you need.
Calculated metrics handle anything the platform does not report directly, including your agency margin on ad spend. Every widget can carry its own filter, or you can apply one filter across a whole section.
Apply the client's logo, colors, fonts, and graph styles, then write the insights explaining what changed and what you recommend. The written section is the part no tool can produce for you, and it is the part clients read first.
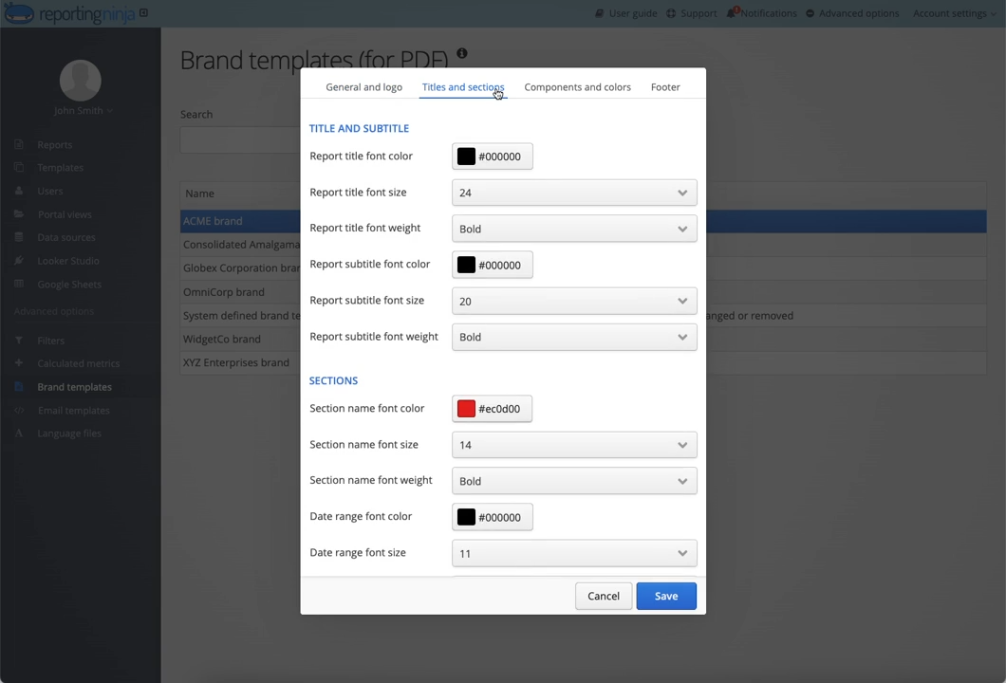
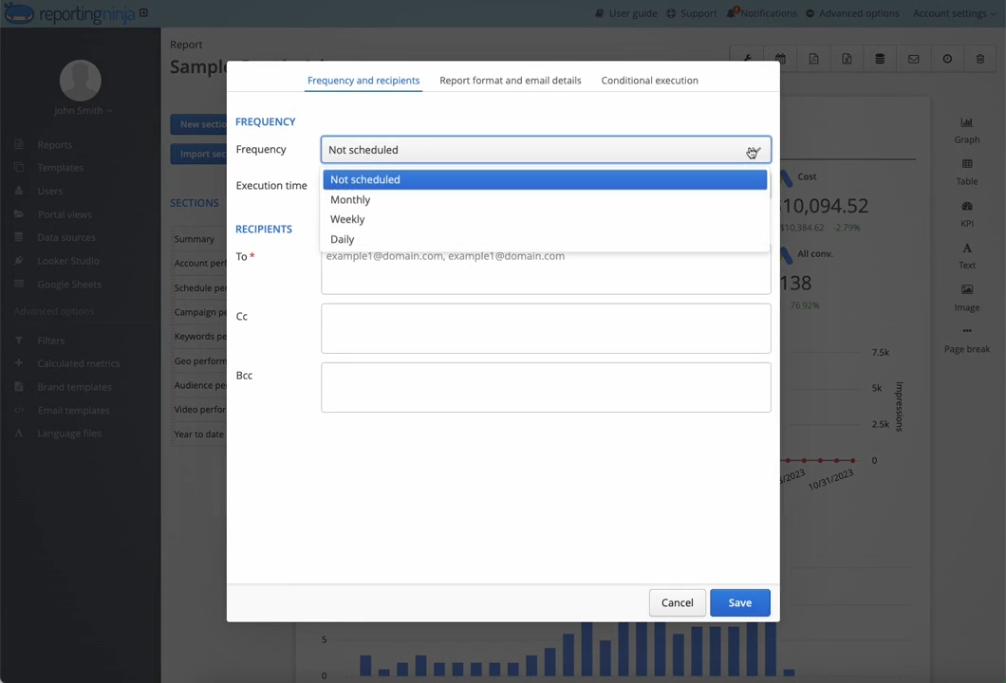
Once the layout is set, schedule the report to generate and send on a recurring basis. Weekly, monthly, or any cadence that suits the relationship works, and the report then updates itself rather than waiting for a rebuild.
If you’re managing several clients, save the branded layout as a reusable template so every new account starts from the same structure. Reporting Ninja's cross-platform reporting also lets you blend LinkedIn data with Google Ads, GA4, Meta, and other channels in one report.
These are the habits that separate a report a client reads from one they file unopened.
Most LinkedIn reports fail for a small number of repeatable reasons, and none of them involve missing data. The table below covers the ones that show up most often.
{{cta-block-v1}}
Followers and engagement are signals, not returns. Proving ROI means connecting LinkedIn activity to cost per lead, pipeline, or revenue, which is where most reports stop.
For LinkedIn Ads, the base calculation is straightforward:
Put the CPL figure directly beside the client's average deal value. A non-marketer can read those two numbers together and see whether the math works, without you explaining it.
Published LinkedIn CPL figures disagree by an order of magnitude:
That spread is too wide to settle an argument. Compare the client's CPL against their own trailing three months, and use industry figures as loose context only.
Dreamdata's 2026 LinkedIn Ads Benchmarks Report, built on 66 million sessions across 3.5 million customer journeys, found that the average time from a first LinkedIn Ads impression to revenue is 281 days.
That number should change how you write this section. A monthly report cannot show revenue from this month's spend, because the revenue arrives roughly nine months later.
Do this instead:
The same analysis found LinkedIn delivered 121% ROAS against 67% for Google Search and 51% for Meta. This shows that return exists, even if it usually arrives after the reporting cycle closes.
Lead-to-opportunity tracking closes the gap between generating a lead and generating one worth pursuing. If the client's CRM is connected, a tag marking which opportunities came from a LinkedIn form gives you a stronger story than CPL alone.
Our guide to cross-channel attribution covers full modeling once the relationship is ready for it.
Organic LinkedIn has no spend figure to divide against, so report it through:
Say plainly that organic is a brand and reach investment rather than a directly attributable revenue channel. A client expecting a cost per lead from organic posting is expecting something the channel cannot produce.
Pulling LinkedIn Page and Ads numbers into a spreadsheet every period is exactly the work a template and a schedule should remove. Connect the data once, and the report rebuilds itself with current numbers on the date you set.
Reporting Ninja brings your LinkedIn Pages and LinkedIn Ads data into one place, gives you a template to start from, and sends the finished report automatically. Plans start at $20 per month billed annually and include every integration and reporting destination, so there is no extra charge for LinkedIn data.
Connect your Page or Ads account and see your first automated report today. Start your free 15-day trial with no credit card required, or check our integrations for the channels you can bring into the same report alongside LinkedIn.
{{cta-block-v1}}
It's a reusable report structure covering follower growth, content performance, page visitors, and ad results where they apply. You build it once and refresh it with new data each period.
Monthly is standard for most accounts. Active ad campaigns usually need a lighter weekly check alongside the full monthly report.
Sometimes. Quarterly is enough if you are tracking follower quality or testing formats. Once you post weekly or run ads, monthly reporting pays for itself.
Yes. Cross-platform reports can pull Google Ads, Meta, or GA4 alongside LinkedIn, which helps when LinkedIn is one part of a wider marketing mix.
A report covers a fixed period and carries written analysis, built to be read and shared. A dashboard updates continuously with metrics and is built for ongoing monitoring.
Sign up for a 15 days free trial. No credit card required.

Build and automate amazing custom reports in a few clicks. Save time, be more productive, impress your clients.