
Shopify reporting tool
Start from our maintained Shopify report or describe your own to AI Builder. Figures straight from the Shopify API, next to your other channels, sent in your brand by email, share link or client portal.


Describe the Shopify report and let the AI build it
Sections, widgets and the written analysis, proposed from the data you already have connected and created only when you approve them. Included in every plan.
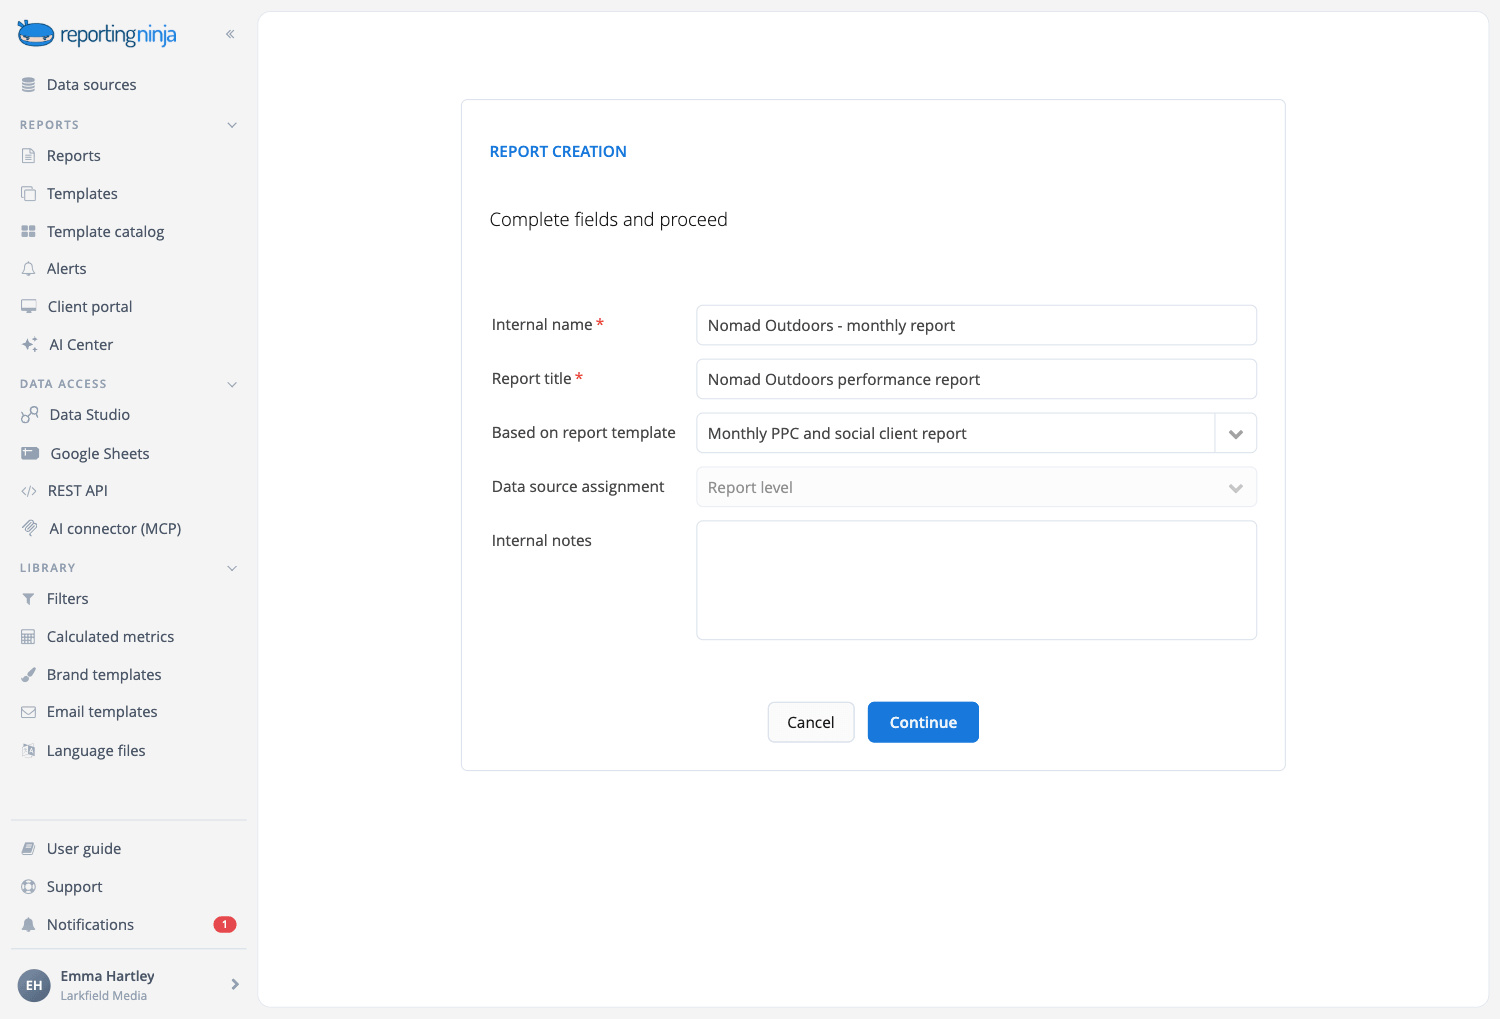
Start from the Shopify report in the catalog
It opens with what the store took, in how many orders and what an order was worth, then walks the money from gross sales to what you kept and shows where the orders came from. Maintained by our team.

Every data point, for reference
The Shopify overview lays out everything we measure, to pick what goes in your report.

Your own template
Save your version as a template. Change it once and every client report built on it follows.
Track sales, discounts and returns
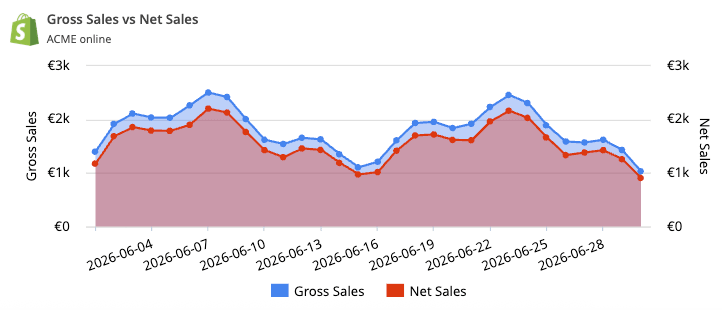
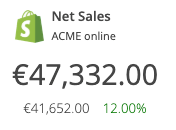
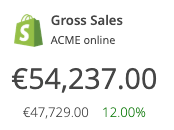
Follow the money side of the store in one place. See gross sales, discounts, returns and net sales at a glance, compare gross against net over the period, and break the numbers down day by day with orders, shipping charges, taxes and total sales.
Monitor orders and returns
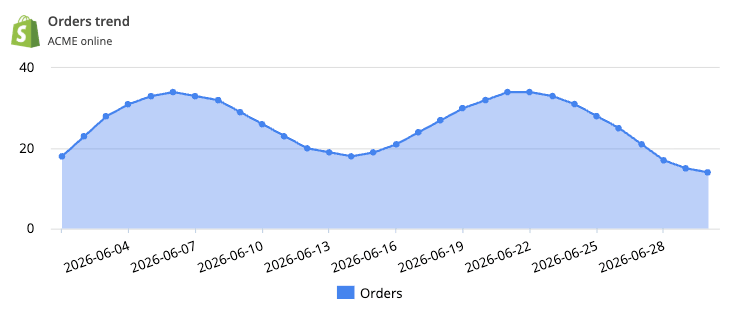
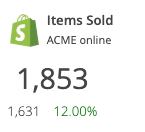
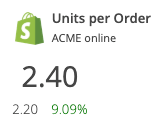
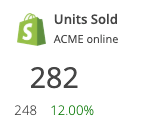
Keep an eye on volume and fulfilment. Report on items sold, units per order, refunded orders and refunded amount, watch the orders and returns trends over time, and drill into an order-by-order list with sales channel, customer type, financial status and fulfilment status.
Find your best-selling products
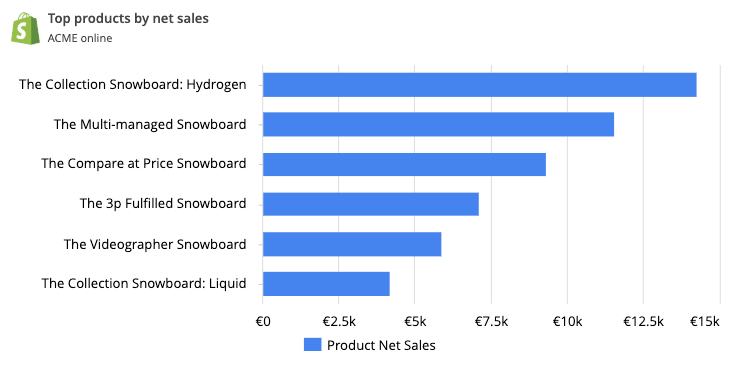
See which products and variants drive the business. Rank top products by net sales, track units sold, average selling price and units returned, and go all the way down to variant and SKU level with gross sales, discounts and returns for every item.
See which customers and channels drive sales
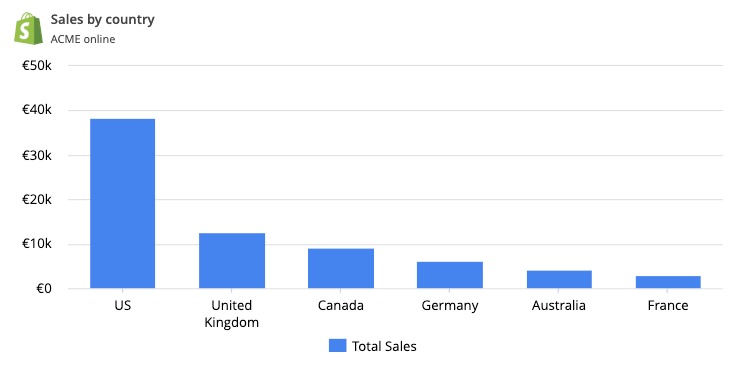
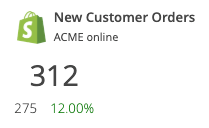
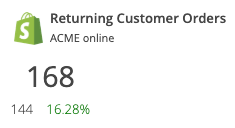
Understand where revenue comes from. Split orders by new and returning customers and follow the returning customer rate, map sales by country, and attribute revenue to the right referrer source and UTM campaign so clients can see which marketing actually paid off.
Keep inventory under control
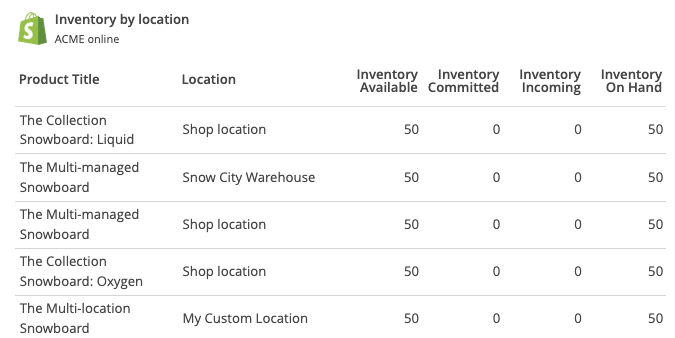
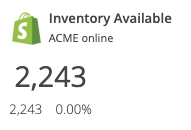
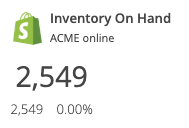
Add an inventory snapshot right next to sales. Track inventory available and on hand, then break stock down by product, variant, SKU and location with available, committed, incoming and on-hand quantities.
Your Shopify data, in every place you work
Connect Shopify once. Every report, dashboard and assistant reuses the same connection.


All six are included on every plan.
Why use Reporting Ninja for your Shopify reports
Start your report automation journey with Reporting Ninja.

Really easy to use
Drag and drop the blocks of content you need. The editor shows the report exactly as your client will see it while you work.

Fully customizable
Beyond the widget library, build the exact widget you need: dimensions, metrics, chart type and filters, with a wizard to guide you.

Scheduled reports
Set the schedule once and Reporting Ninja emails each client their report every week or month.

Custom branding
Your logo or your client's, brand colors, fonts and chart styles, with a cover page and a table of contents.

Client portal access
Send a PDF or a share link, or open a branded portal on your own domain where clients log in to their reports.

Multi-language reports
Send each client their report in their own language, with our ready-made language files or one you create.
Create your Shopify reports in minutes
Templates, automation and your brand, on every plan.