
SE Ranking reporting tool
Start from our maintained SE Ranking report or describe your own to AI Builder. Rankings, competitors, site audits and your brand in AI answers, straight from SE Ranking and SE Visible, next to your other channels, sent in your brand by email, share link or client portal.

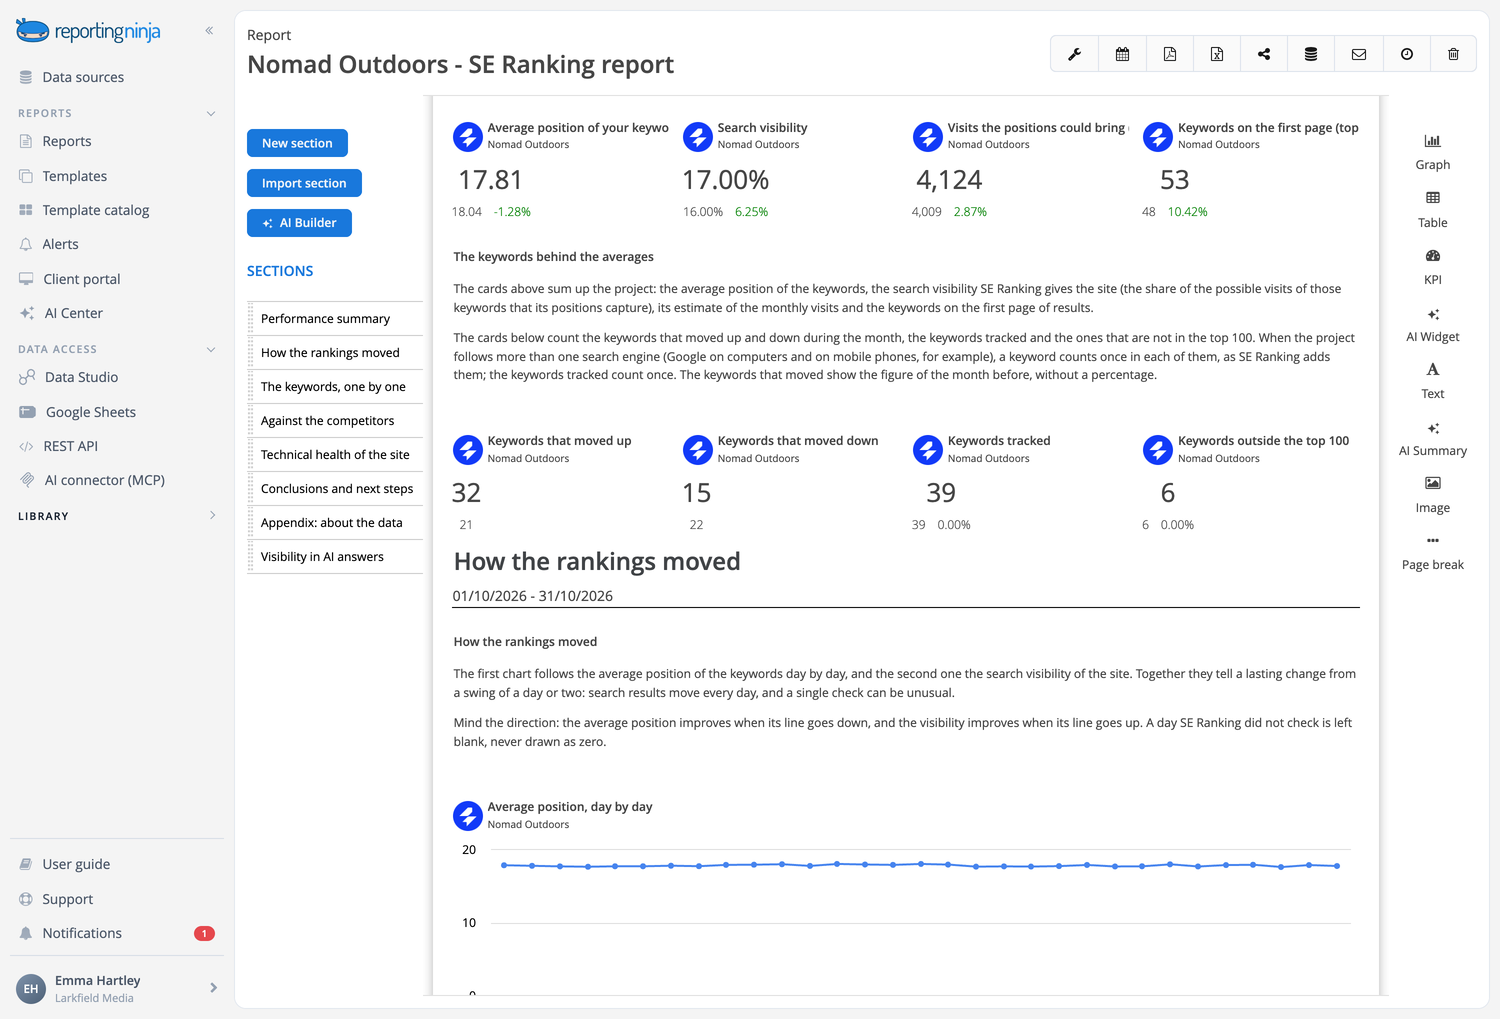

Describe the SE Ranking report and let the AI build it
Sections, widgets and the written analysis, proposed from the data you already have connected and created only when you approve them. Included in every plan.
Start from the SE Ranking report in the catalog
It opens with where the site stands: average position, search visibility, the estimate of visits and the keywords on the first page. Then how the rankings moved day by day, the keywords that climbed and dropped, the competitors, the latest site audit and, at the end, the brand in AI answers. Maintained by our team.

Every data point, for reference
The SE Ranking overview lays out every widget we offer, with groups, search engines and SERP features, to pick what goes in your report.

Your own template
Save your version as a template. Change it once and every client report built on it follows.
Track every keyword and how it moved
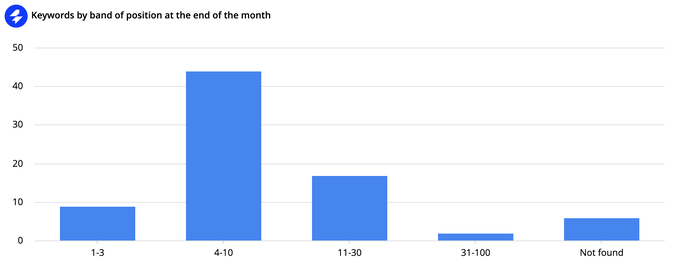
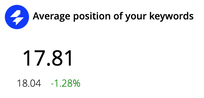
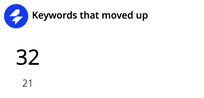
See the position of each keyword at the end of the month and how far it moved, its best position, the page that ranks and whether it climbed, dropped, entered or left the results. Count the keywords in the top 3, 10 and 30, by group, search engine and device, with the average position counted the way SE Ranking counts it.
Show the trend your client cares about
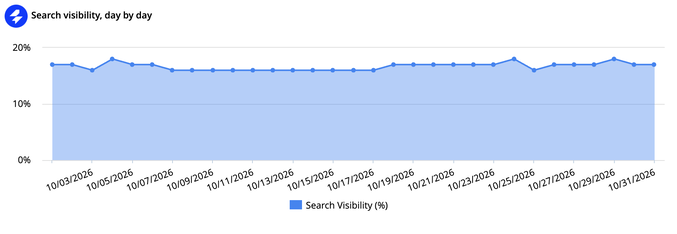
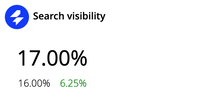
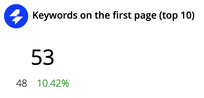
Chart search visibility, the traffic forecast and the keywords in the top 10 day by day, as SE Ranking draws them, and mark which results pages carry an AI Overview, People also ask, videos or images.
Put your client next to the competitors
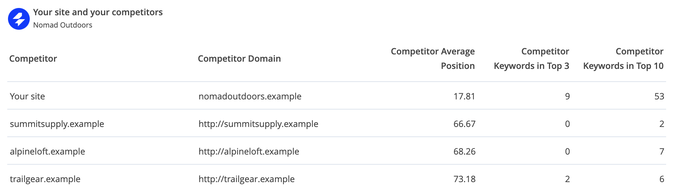
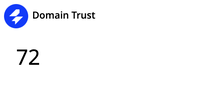
Compare the average position and the keywords in the top 10 of your client's site with the competitors you track in SE Ranking, keyword by keyword, next to your site's domain trust.
Report the technical health of the site
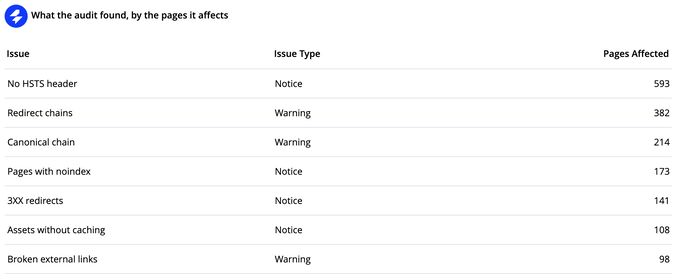
Add the health score of the latest site audit next to the previous one, with its errors, warnings and notices, and the issues to fix with the pages they affect.
See your brand in AI answers
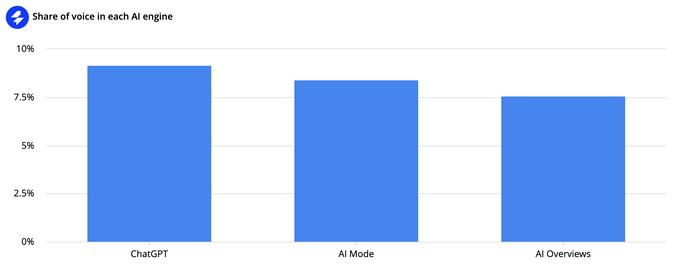
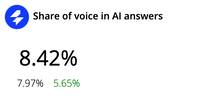
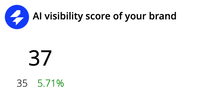
With SE Visible with API access, show how often ChatGPT, Google's AI Overviews and AI Mode and other AI engines mention your client's brand next to the competitors: visibility score, share of voice, mentions and sentiment, by engine, topic and prompt, and the sites the answers cite.
Your SE Ranking data, in every place you work
Connect SE Ranking once. Every report, dashboard and assistant reuses the same connection.


All six are included on every plan.
Why use Reporting Ninja for your SE Ranking reports
Start your report automation journey with Reporting Ninja.

Really easy to use
Drag and drop the blocks of content you need. The editor shows the report exactly as your client will see it while you work.

Fully customizable
Beyond the widget library, build the exact widget you need: dimensions, metrics, chart type and filters, with a wizard to guide you.

Scheduled reports
Set the schedule once and Reporting Ninja emails each client their report every week or month.

Custom branding
Your logo or your client's, brand colors, fonts and chart styles, with a cover page and a table of contents.

Client portal access
Send a PDF or a share link, or open a branded portal on your own domain where clients log in to their reports.

Multi-language reports
Send each client their report in their own language, with our ready-made language files or one you create.
Create your SE Ranking reports in minutes
Templates, automation and your brand, on every plan.