8 best Amazon reporting tools for agencies and freelancers
Luis Pereira
Founder & CEO at Reporting Ninja
Key takeaways
Choose Reporting Ninja if you already report on Google Ads, Meta Ads, or other marketing channels and want Amazon Ads in the same dashboard.
Porter Metrics and Supermetrics are strong options for piping Seller Central data into Looker Studio, Google Sheets, or a data warehouse.
KwickMetrics and Sellerboard stand out for sellers and agencies that need SKU-level profitability after Amazon fees.
AgencyAnalytics, Whatagraph, and DataHawk suit brands that need Amazon reporting as part of a broader cross-channel or enterprise reporting stack.
If you’ve ever found it difficult to explain why Amazon metrics conflict across various reports, you are not alone. Sales, advertising, fees, and inventory data are all stored in completely separate dashboards, meaning they are rarely in sync with one another, which is a big part of why automated marketing reports for Amazon have become standard practice for agencies.
This lack of consolidation is also why so many sellers and agencies look for a dedicated Amazon reporting tool in the first place. In this guide, we evaluate eight popular platforms that marketers use to bring their Amazon data into a single view, examining their key strengths, limitations, and real user experiences.
Best Amazon reporting tools compared for 2026
Tool
Best for
Standout feature
Price starting point
Reporting Ninja
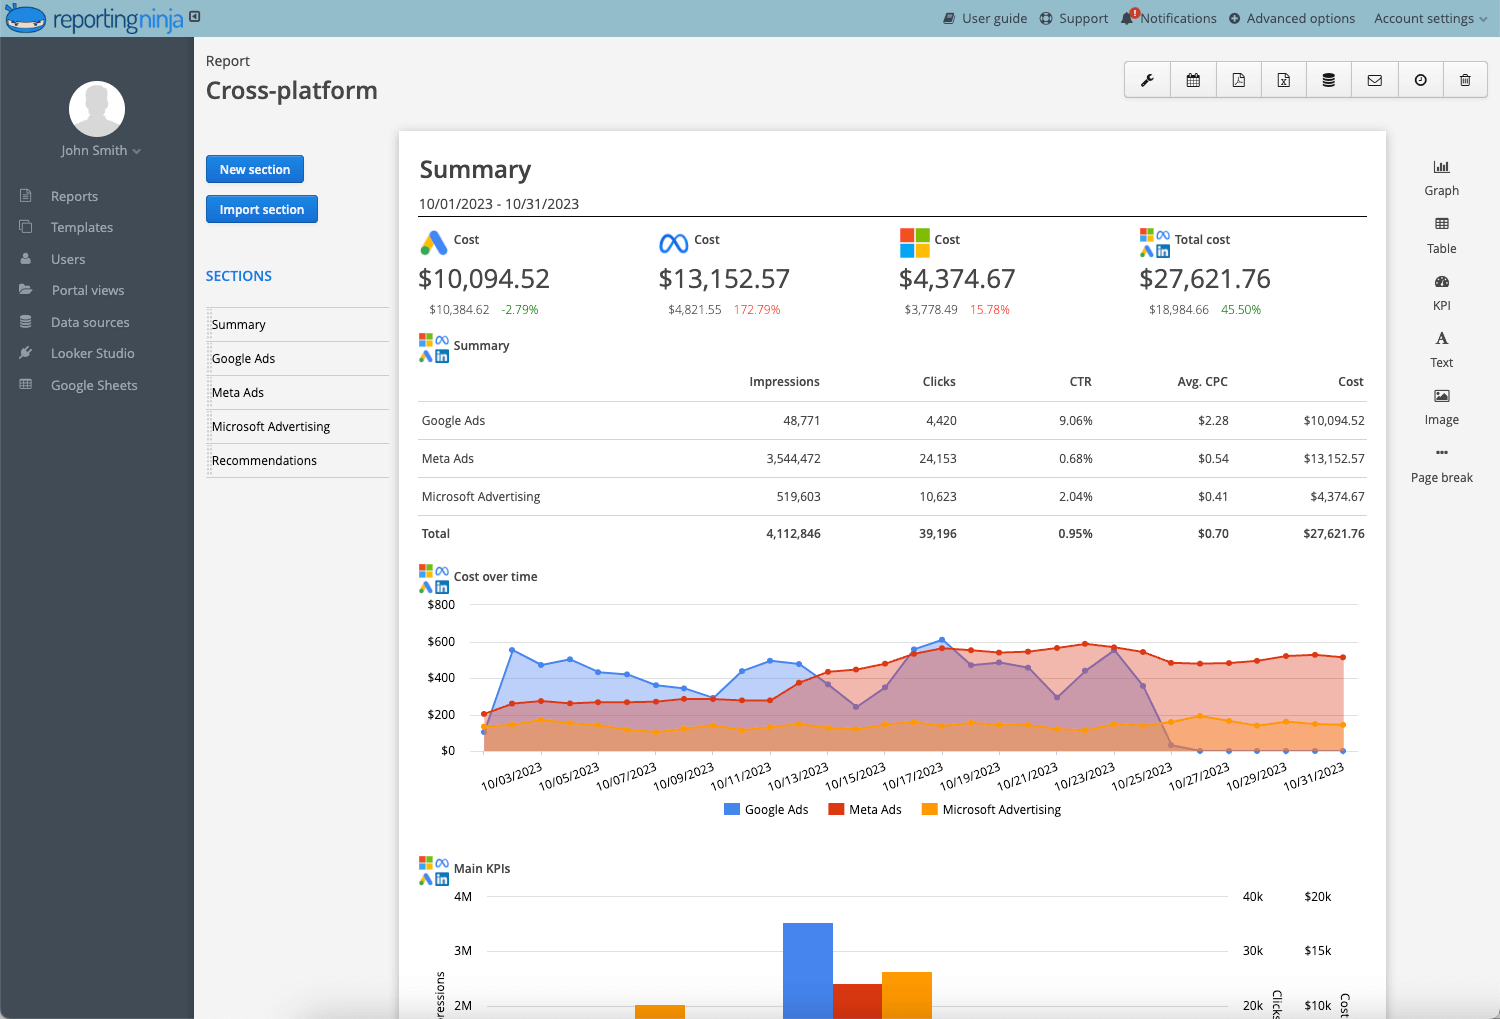
Agencies reporting on Amazon Ads alongside Google Ads, Meta Ads, and other channels
Full Amazon Ads hierarchy in branded custom reports
$20/mo
Porter Metrics
Teams wanting affordable, no-code Seller Central data in Data Studio
133 Seller Central fields across orders, inventory, buyers, listings, and sales
Free, paid from $12.50/mo (billed annually)
KwickMetrics
Amazon and Walmart agencies needing SKU-level profit and white-label portals
Native Amazon and Walmart profit consolidation with SKU matching
$15/mo
AgencyAnalytics
Agencies reporting on Amazon alongside 80+ other marketing channels
One of the broadest integration libraries in the category
From $20 per client/mo (billed annually)
Whatagraph
Teams wanting polished, template-driven multi-client reports
Multi-source dashboards with reusable branded report templates
From $812/mo (billed annually)
Supermetrics
Data teams piping Amazon Ads or Seller Central into a warehouse or BI tool
200+ connectors, including both Amazon Ads and Seller Central
From $39/mo
DataHawk
Large brands or agencies wanting enterprise Amazon, Walmart, and Shopify analytics
AI-powered anomaly detection and market intelligence at scale
Custom pricing
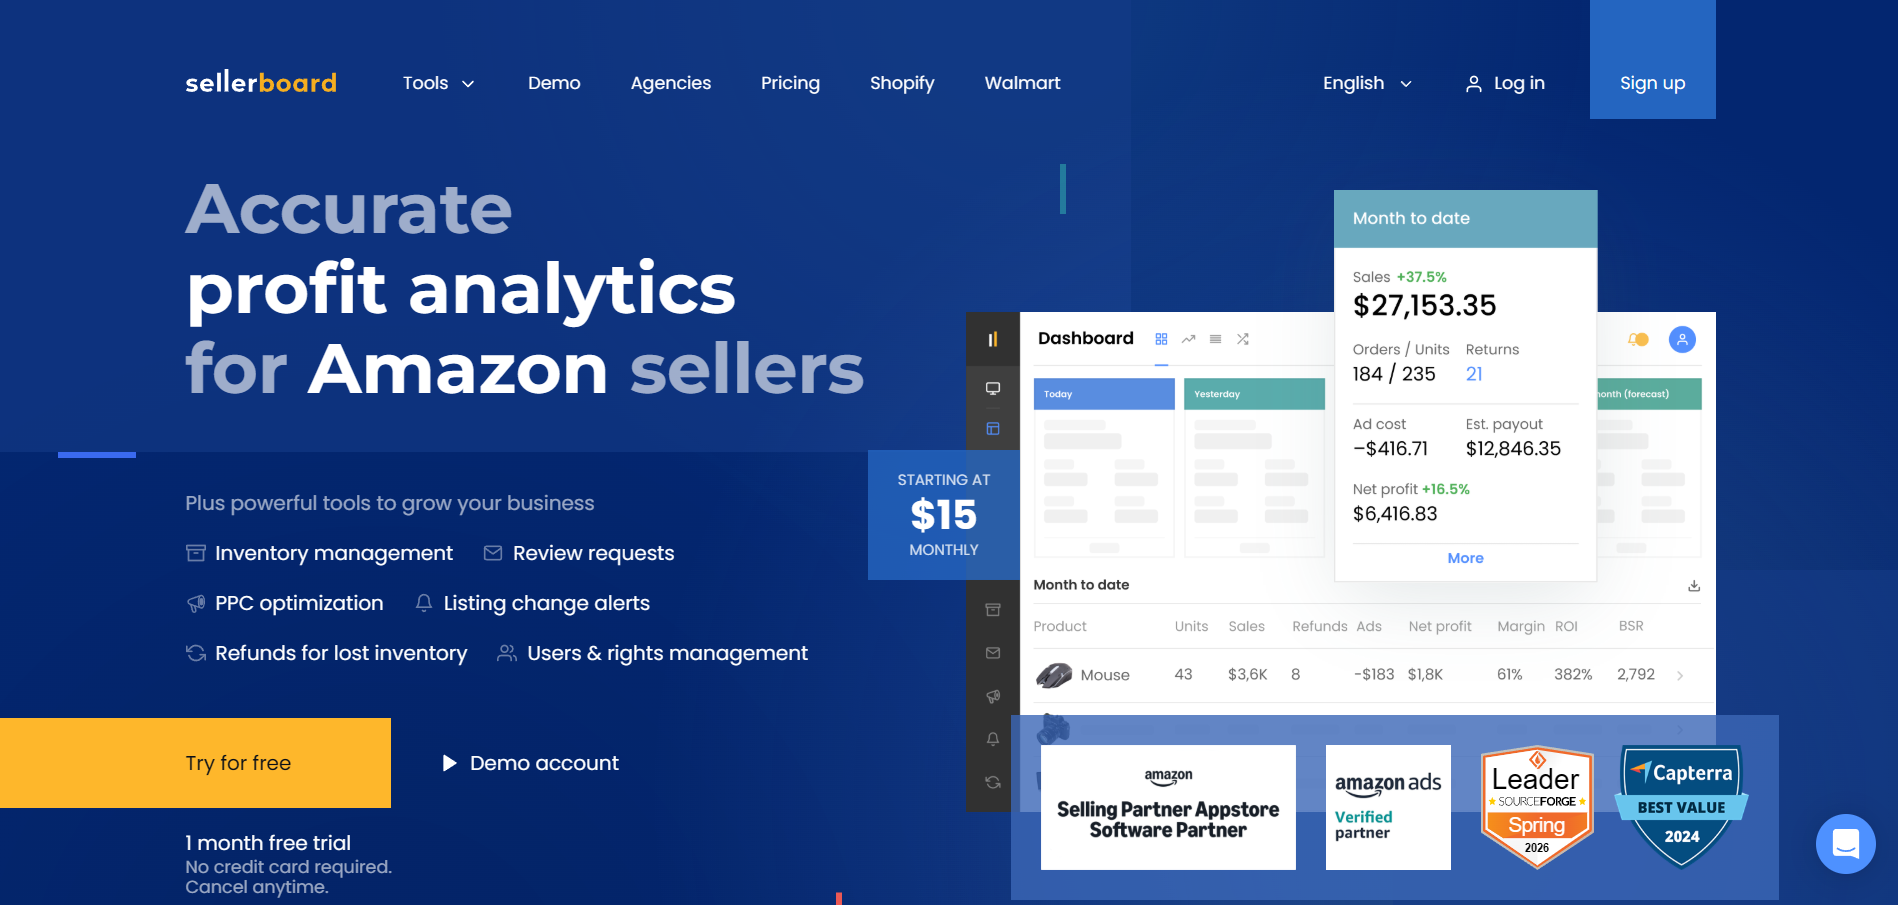
Sellerboard
Individual FBA sellers wanting true net profit per SKU
Real-time profit and loss after every Amazon fee, PPC dollar, and COGS input
$15/mo
Once you know roughly which lane fits your team, seeing how Amazon Ads data sits inside a broader cross-platform dashboard makes the choice easier. Start your Reporting Ninja free trial and see it built out in minutes.
1. Reporting Ninja: best for combining Amazon data with other marketing channels
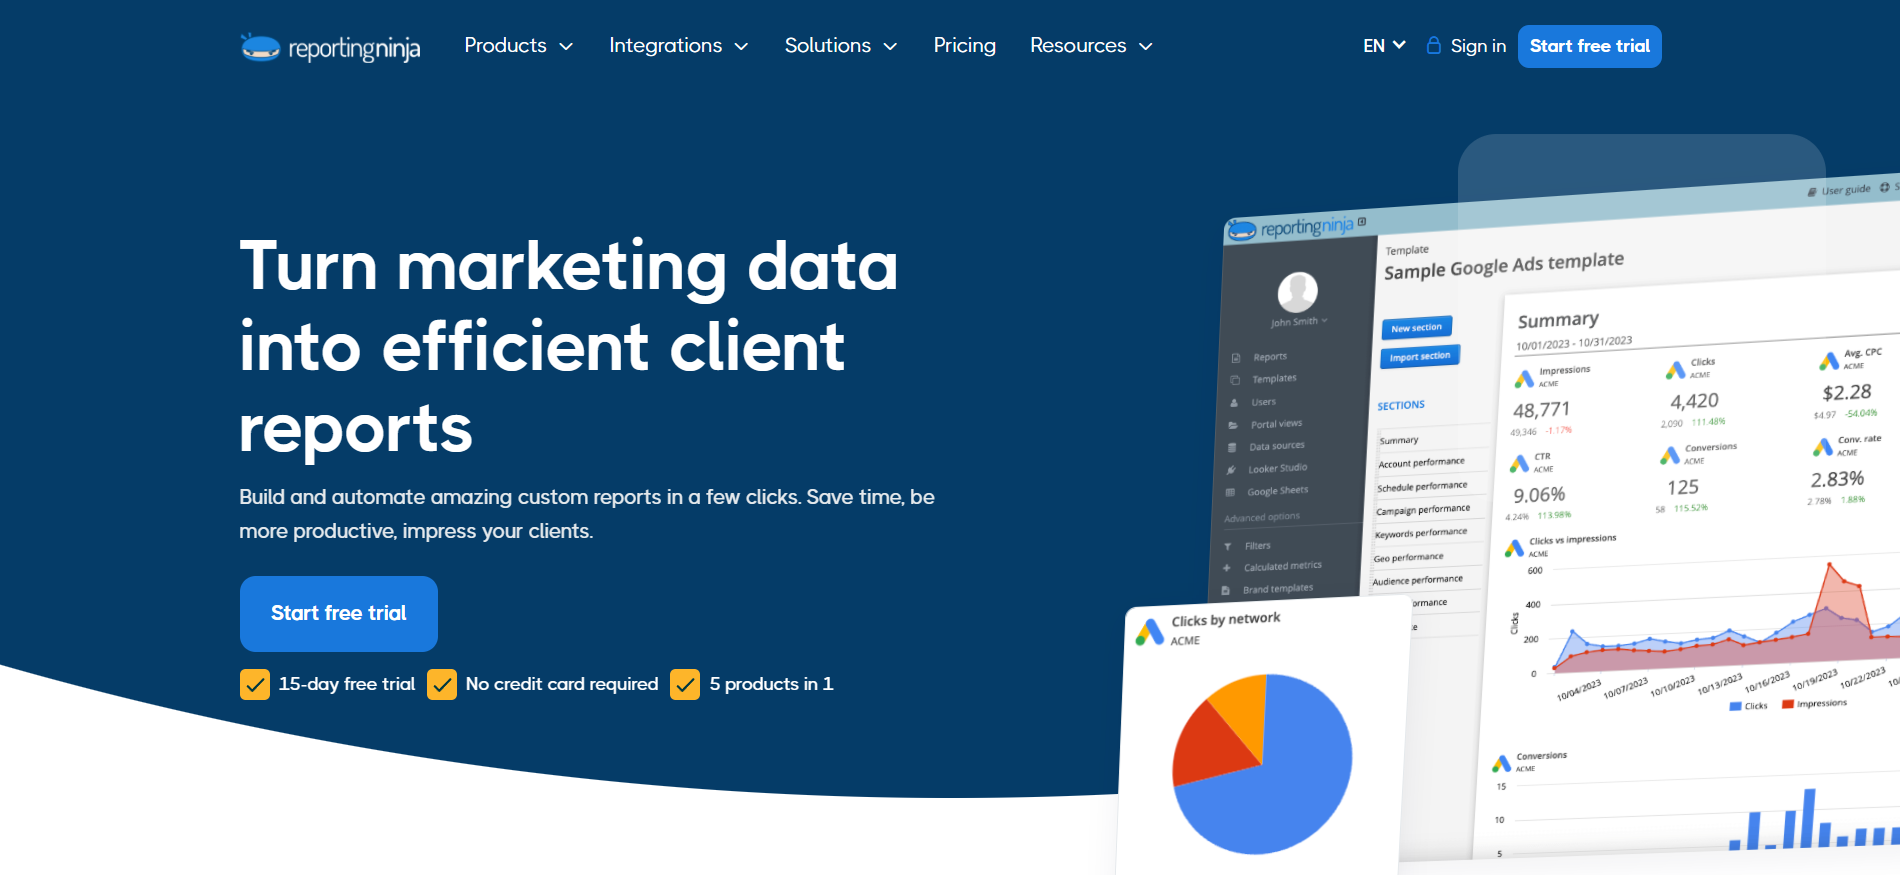
Reporting Ninja is a Madrid-based reporting platform serving agencies and in-house teams across more than 80 countries. It competes in cross-channel reporting rather than Amazon tooling, so Amazon Ads arrives as one connector inside a wider setup.
Three features come up most often when agencies explain why they picked Reporting Ninja for their Amazon Ads reporting specifically.
Full Amazon Ads hierarchy in every widget
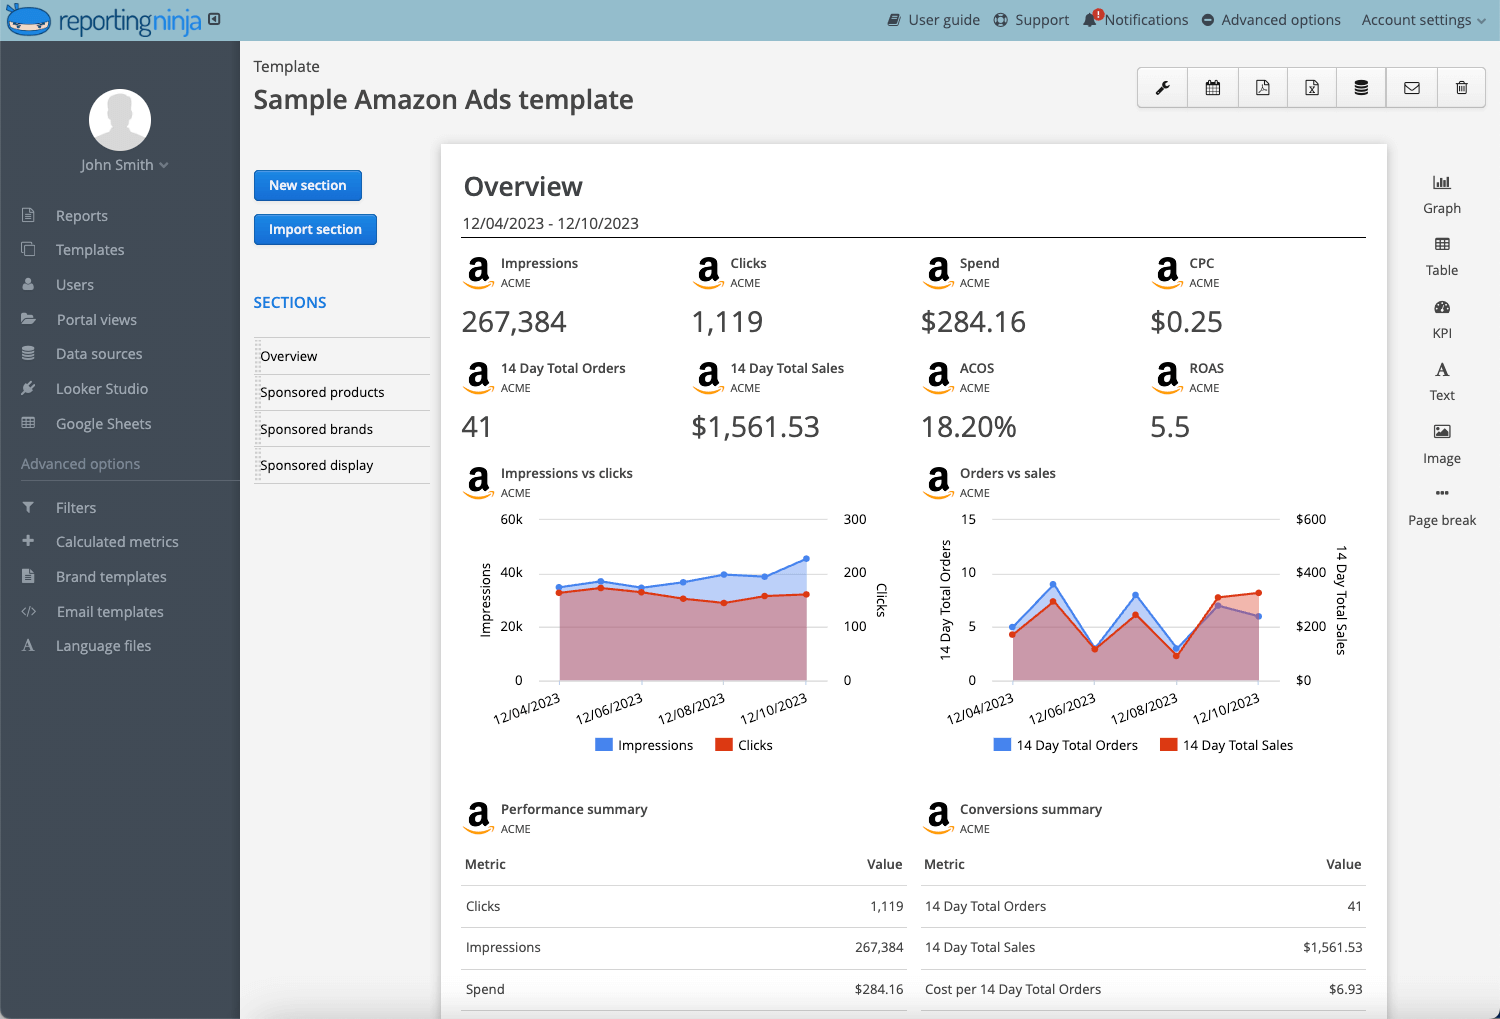
Many reporting tools focus on campaign-level reporting, but Reporting Ninja exposes much more of Amazon Ads' native reporting hierarchy.
For sponsored products, you can break a report down by campaign and placement, ad group, product ad, target and search term, keyword and search term, or ASIN. Sponsored Brands adds the ability to filter by creative type, and Sponsored Display lets you segment by matched target and by tactic, whether that is product targeting or audience targeting.
Template-based reports that update themselves
Once you build an Amazon Ads report layout you like, Reporting Ninja lets you save it as a template and reuse it across every client account that needs the same structure. Update the template once, and every report built from it reflects the change automatically.
Beyond the prebuilt library, a wizard lets you assemble the exact dimension and metric combination you need, choose the chart type, and apply custom filters. Useful when a client asks for a view that no template covers.
Scheduled delivery and a branded client portal
Reports can be scheduled to email themselves to clients on whatever cadence you set, so nobody on your team has to remember to hit export every Monday.
If you would rather clients log in and view their own numbers, Reporting Ninja also supports a branded client portal on a custom domain, with reports available in 16 language files if you serve international clients.
Reporting Ninja pricing
Every plan includes the same core features without gating. The only differences are the number of reports, users, and connected accounts included.
Plan
Price (billed annually)
Custom reports
Users
Accounts of each type
Starter
$20/mo
10
4
10
Small
$40/mo
30
8
30
Medium
$70/mo
70
12
70
Large
$120/mo
150
16
150
A 15-day free trial is available on all plans, no credit card required, and there are no contracts or cancellation fees since Reporting Ninja runs on a pay-as-you-go basis.
Where Reporting Ninja shines
No contract and no cancellation fee: Pay-as-you-go billing, cancel any month, 15-day trial without a card.
Nothing gated by tier: Starter carries the same integrations, API, MCP access, and white-labeling as Large. Higher plans buy volume only.
Flat, account-based pricing: Plans scale on connected accounts rather than per-client fees or usage credits, so you can forecast the bill a year out.
{{cta-block-v1}}
Where Reporting Ninja falls short
No Seller Central data: Reporting Ninja's Amazon integration covers advertising performance only. If you need sales, inventory, FBA fees, or profit data from Seller Central, you will need a dedicated tool alongside it.
Smaller integration library than the largest agency platforms. Reporting Ninja covers the most commonly used marketing and e-commerce sources rather than an exhaustive catalog, so highly specialized data sources may not be available yet.
Customer reviews
"It's easy to use, comes with excellent customer support, works with many data sources, and can send automated reports by email."László V., G2
"I had already worked with other tools, but the balance between automation, customization, and the visuals offered by Reporting Ninja meets all my needs. The ability to integrate data from various marketing channels and turn them into such well-crafted reports saves us a lot of time while enhancing our clients' experience." Stephanie Barbieri, Studio 33
Who Reporting Ninja is best for
Agencies managing multiple marketing channels: Keep Amazon Ads alongside Google Ads, Meta Ads, and other platforms in one reporting workflow.
Teams juggling multiple client formats. Whether clients want a branded PDF, a scheduled email, or a self-serve portal, the same underlying reports drive all of them.
Agencies with a fast-growing client list. Costs move with connected accounts, not headcount or client count.
You can connect your Amazon Ads, Google Ads, and Meta Ads accounts to a single branded dashboard in one sitting. Explore Reporting Ninja's integrations to see the full list before you commit.
2. Porter Metrics
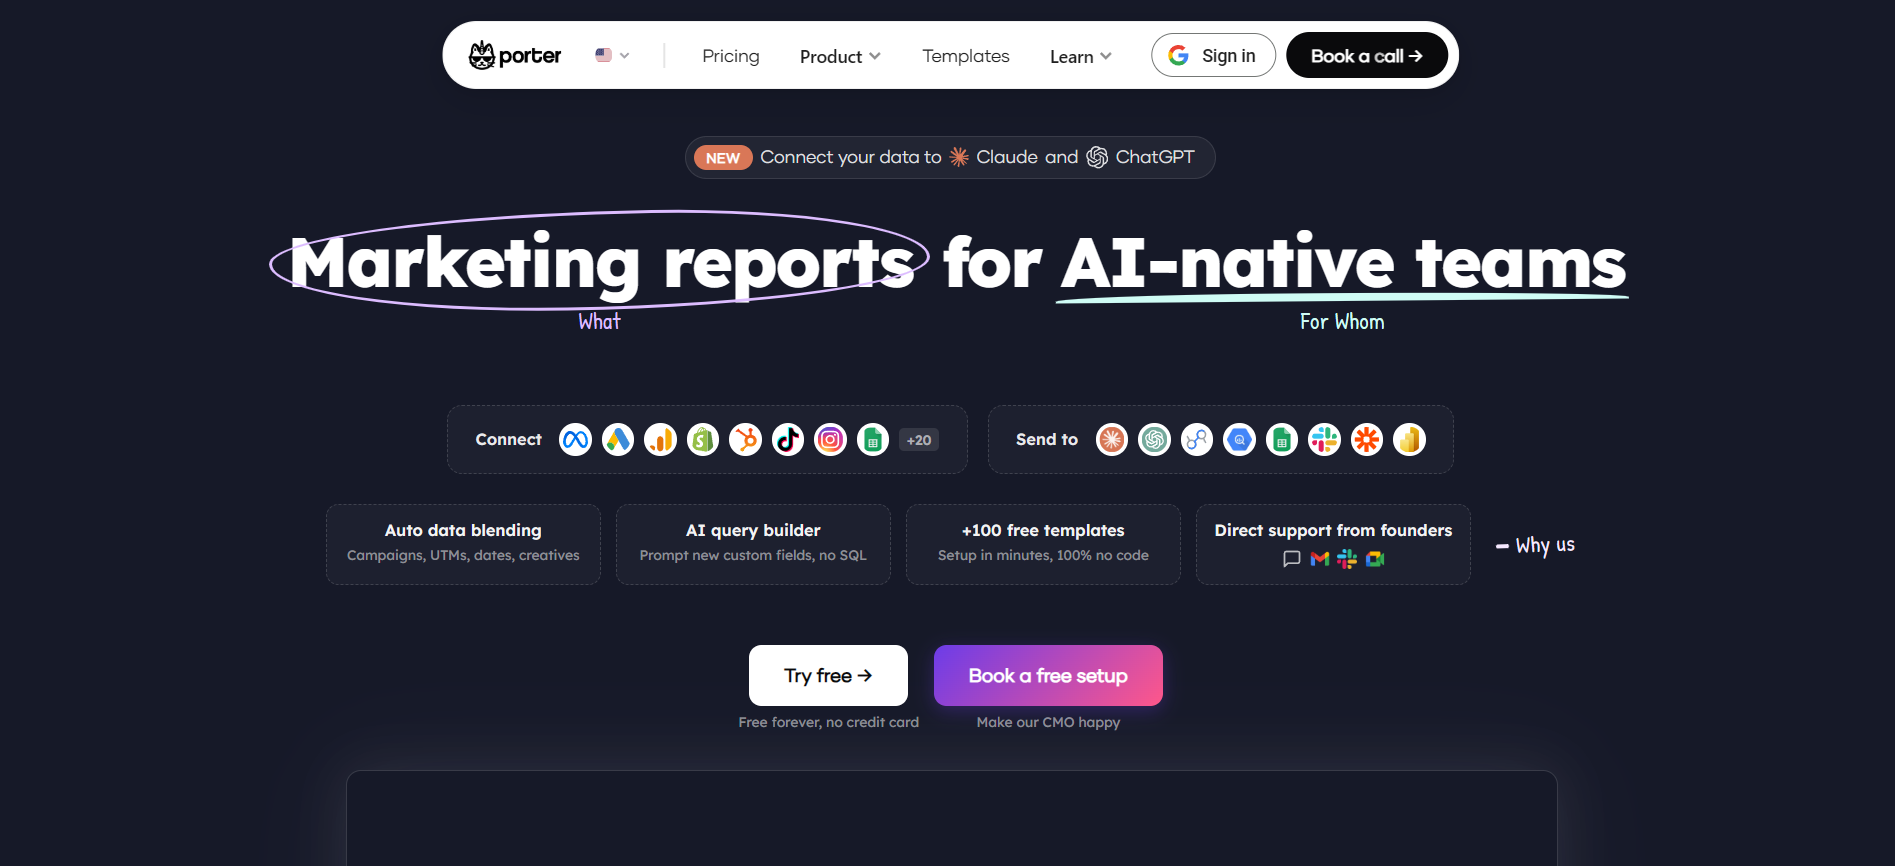
Porter is a no-code connector company serving 1,600+ marketers and agencies in 60+ countries, rated 4.6 out of 5 across 200+ G2 reviews. It positions itself as a data layer rather than a dashboard product: Porter hosts your marketing data and feeds whatever destination you already work in.
Key features
133 Seller Central fields across nine categories: Orders, items, FBA inventory, shipping addresses, buyers, sales, listing items, sellers, and date dimensions. The FBA breakdown separates fulfillable, inbound, reserved, and damaged quantities rather than reporting one stock figure.
Three Amazon connectors that blend: Seller Central, Amazon Ads, and Amazon DSP connect separately and combine in a single dashboard, which is how Porter markets net-margin reporting.
Pricing
Plan
Price
Included
Free
$0
Up to 3 Seller Central accounts, 30-day history
Pay-per-account
From $12.50/account/month (billed annually)
Additional Seller Central accounts, extended history
Where Porter Metrics shines
Porter's team will build your first reports: A free report setup call is offered to new accounts, which is unusual at this price.
Published troubleshooting: Porter documents known Amazon API discrepancies, including why dashboard order counts diverge from Seller Central.
Where Porter Metrics falls short
Every Amazon data type is a separate connector: Seller Central, Amazon Ads, and Amazon DSP each connect individually, which means a unified profitability view requires paying for three connections.
Large date ranges need chunking: Porter advises requesting historical backfill in 90-day segments rather than multi-year spans, and reports can time out on long ranges.
Customer reviews
“It has a very simple interface...The speed and performance was good, never hanged. And it is the most affordable one for a small time agency like mine.”Fiddle T., G2
"The connectors are always broken... It makes it extremely frustrating when I make reports for senior management. Support takes forever to get back to you."George R., G2
Who Porter Metrics is best for
Teams testing whether a dashboard is worth paying for. A free forever plan covering three accounts with 30-day history, plus an unlimited 14-day trial.
Teams whose clients already read Data Studio or Sheets. Nobody has to be migrated to a new interface.
3. KwickMetrics
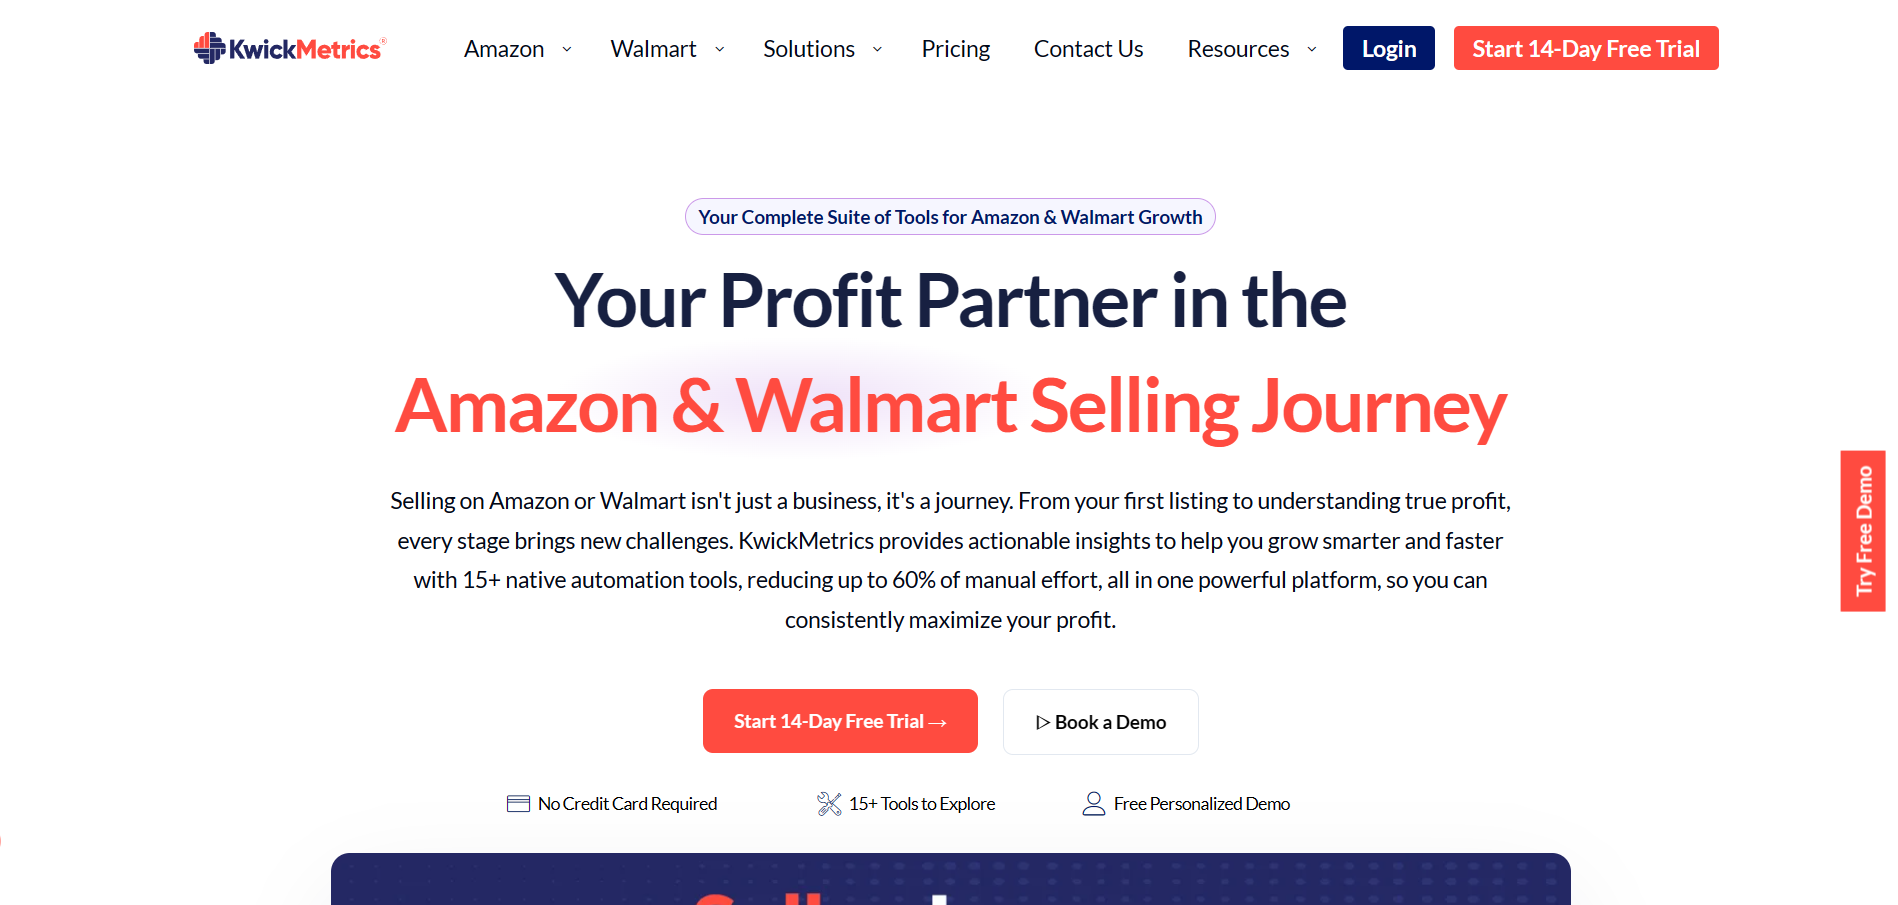
KwickMetrics is a seller operations platform rather than a reporting tool. Listings, advertising, inventory, reviews, and profit all sit under one login, with reporting as one layer. Its user base runs from single private-label sellers to agencies managing multiple accounts.
Key features
SKU-level profit and loss across Amazon and Walmart: KwickMetrics calculates SKU-level profitability by combining COGS, Amazon and Walmart fees, advertising spend, returns, and reimbursements. It also maps Amazon ASINs to Walmart item IDs, giving sellers a unified profitability view across both marketplaces.
White-label client portals: Agencies can apply their own branding, custom domain, and colors to reports and dashboards, presenting client-facing reports without visible KwickMetrics branding.
Pricing
Plan
Price (billed annually)
Monthly order limit
Starter
$15/mo
Up to 3,000
Standard
$23/mo
Up to 6,000
Professional
$71/mo
Up to 15,000
Business
$111/mo
Up to 50,000
Enterprise
$239/mo
Up to 100,000
Where KwickMetrics shines
Near-real-time syncing: Amazon data refreshes on a range from every 15 minutes to once a day depending on data type.
Onboarding is included: Dedicated account setup comes with the subscription, which matters for a platform that spans more than reporting.
Where KwickMetrics falls short
Listing and ad tools are add-ons on lower tiers: Starter and Standard plans require separate credit purchases for keyword research, listing optimization, and campaign management, which can add up quickly.
Pricing scales with order volume, not flat client count: Fast-growing sellers can move up a tier faster than expected during a strong sales month.
Customer reviews
"A unified dashboard allows us to monitor all aspects of our sales process seamlessly, making management more efficient. Additionally, it offers tailored graphical reports for detailed analysis."Verified G2 review.
"The P&L reports include top-line revenue items like taxes and gift wrap. They're zeroed out later, but I don't think they should appear at all."Dann I., Capterra.
Who KwickMetrics is best for
Sellers already on Walmart or moving there this year. The cross-marketplace view is the reason to pick it over a single-marketplace tool.
Agencies that want execution and reporting in one login. The alternative is a reporting tool plus separate ad and listing software.
Pro tip: Automated Amazon reporting can save agencies real hours every week compared with manual spreadsheet work. See how automated reporting tools compare before you decide which stack fits your team.
4. AgencyAnalytics
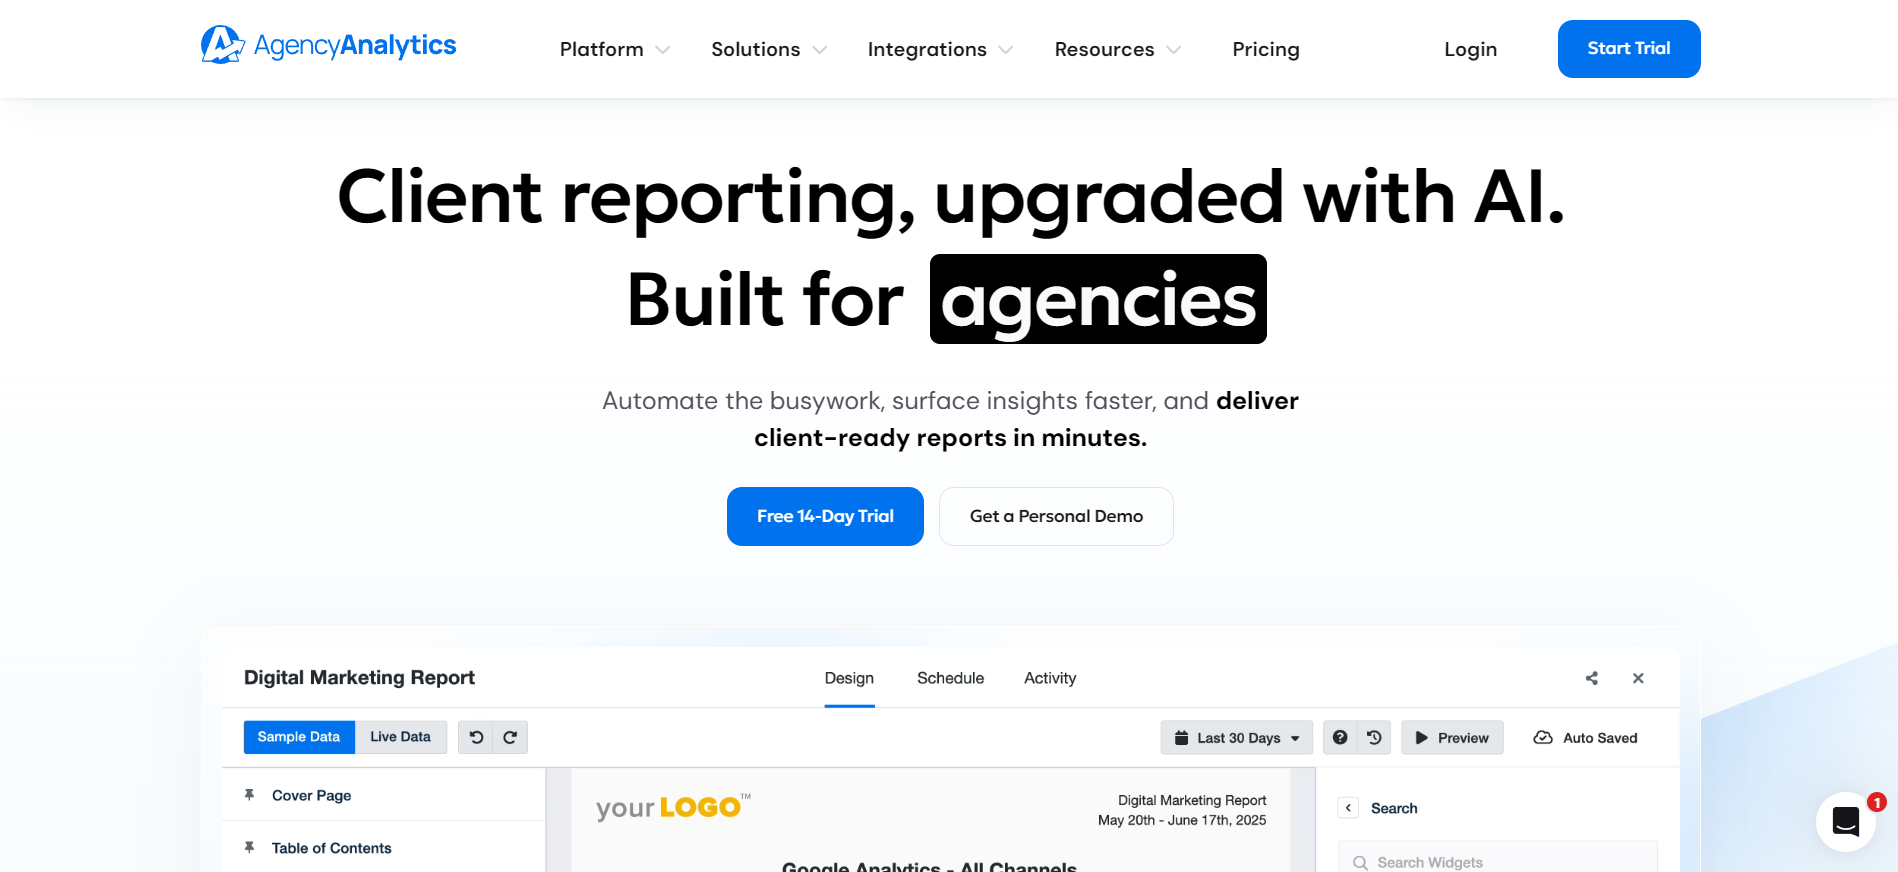
AgencyAnalytics is an agency reporting platform used by more than 7,000 agencies. Amazon Ads is one of 85+ integrations. It has moved to a single plan priced per client, replacing the older tiered structure, with every feature on that one plan.
Key features
Amazon Ads inside a multi-channel report: Campaign performance sits alongside SEO, PPC, social, and email, with roll-up reports and dashboards that aggregate across clients.
Built-in SEO tooling: AgencyAnalytics includes built-in rank tracking and automated site audits, reducing the need for separate SEO reporting tools for many agencies.
Pricing
Plan
Price (billed annually)
Included
Standard
$20/client/month
All features, unlimited staff & client users, 85+ integrations
Enterprise
Custom
Volume discounts, database connectors, priority support
AgencyAnalytics also offers paid add-ons, including AI Tracker for monitoring brand visibility across AI search platforms and Rank Tracker for tracking keyword rankings across Google and Bing. These are billed separately from the core platform.
Where AgencyAnalytics shines
Support and enablement are included: Email and chat support plus a free onboarding call, without an upgrade.
Headcount is free: Staff and client users are unlimited, so growing the team doesn't change the bill.
Where AgencyAnalytics falls short
Per-client pricing can become expensive at scale: Costs increase as you add clients, making it less predictable for fast-growing agencies than flat-rate platforms.
Amazon Ads only, not Seller Central: AgencyAnalytics tracks Amazon Ads performance (ACOS, spend, ASIN-level data), but not Seller Central data like inventory, settlements, or SKU-level profitability.
Customer reviews
“I like that AgencyAnalytics lets me customize every report and widget. It pulls in a custom dashboard with all the integrations I need from multiple platforms.” Brittany H., G2
“Some fields occasionally pull in inaccurate info, so we must double-check the data.” Verified G2 review
Who AgencyAnalytics is best for
Full-service agencies with a stable client count. Per-client billing rewards clients who connect many channels and punishes a long roster of thin ones.
Teams that want a walkthrough setup. The onboarding call is part of the standard plan rather than an enterprise perk.
5. Whatagraph
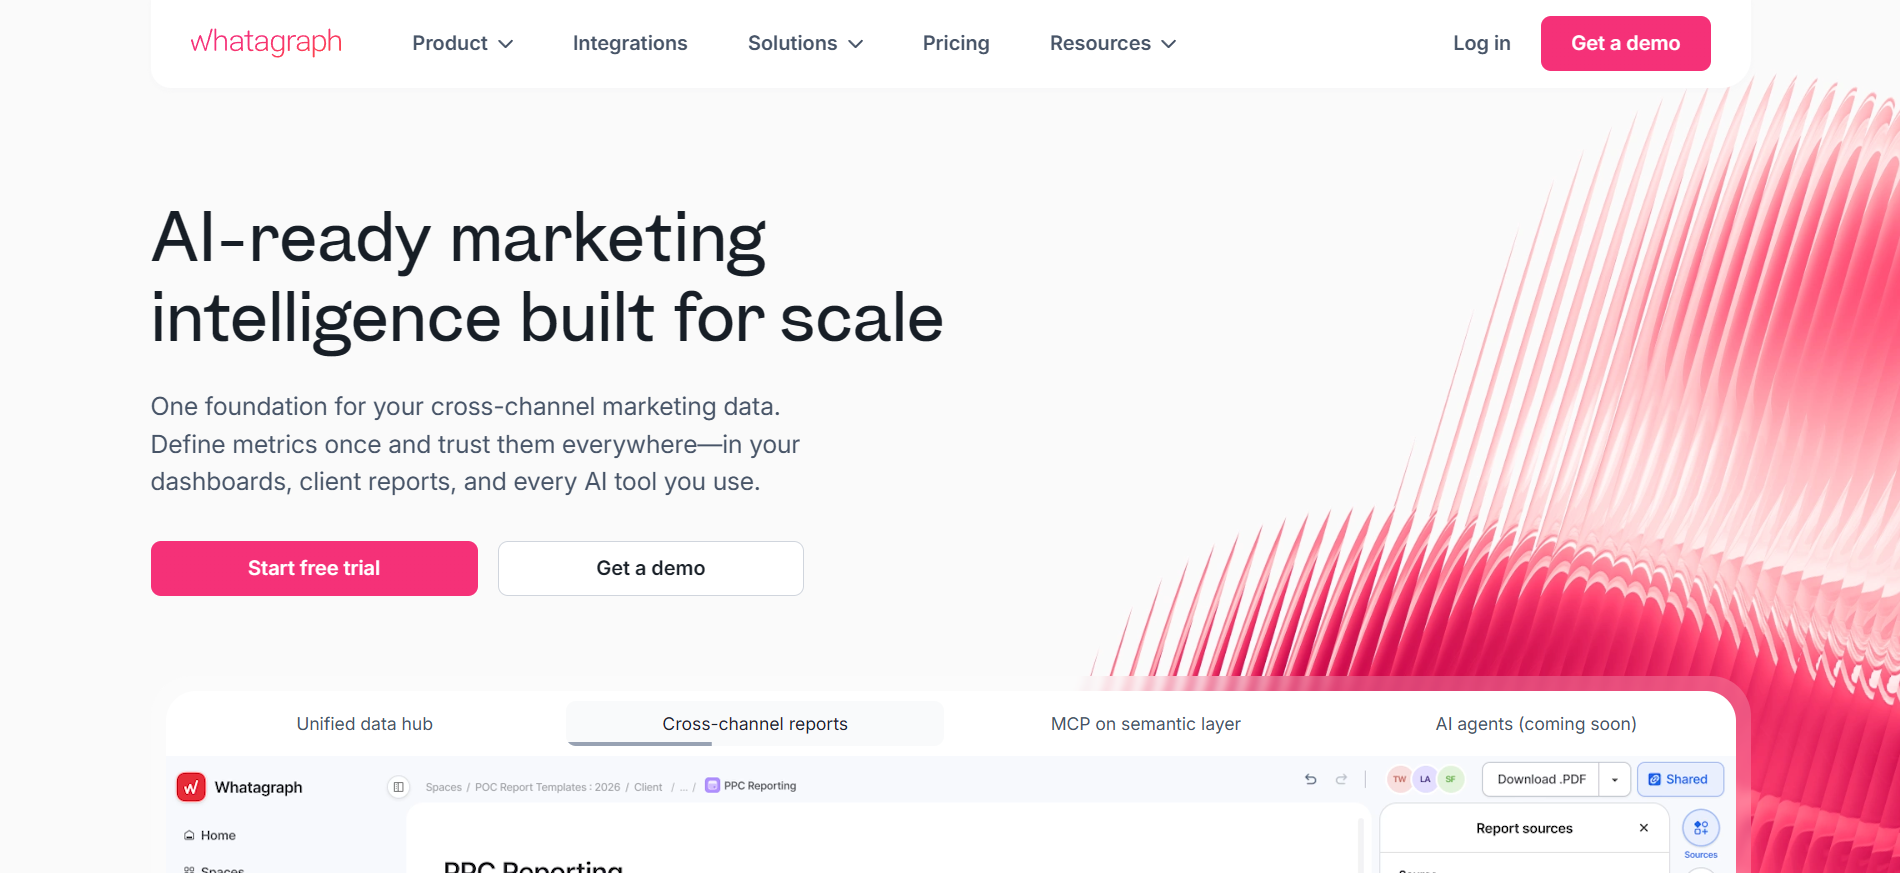
Whatagraph started as a report builder but has now expanded into a marketing intelligence platform. Alongside client reporting, it moves marketing data into BigQuery, so the same figures feed client-facing reports and a warehouse from one governed source.
Key features
Amazon Ads in multi-source, branded reports: Prebuilt templates you brand once and reuse, with Amazon Ads combined with other channels in a single view.
Data transfer to a warehouse: Managed transfers into BigQuery, which also works as a source. Data arrives normalized, with the schedule under your control and no pipeline maintenance.
100+ credits, premium integrations, custom domain, public API, BigQuery, and Data Studio transfer
Where Whatagraph shines
30-minute data refresh on every integration and every plan: It isn't reserved for higher tiers, which is common elsewhere.
Support is part of the product: Live chat responding in under a minute, a dedicated customer success manager on Max and Prime, and tailored onboarding on Prime.
Where Whatagraph falls short
Credit-based pricing is hard to predict: A single client using several data sources can burn through a plan's credit limit faster than expected, forcing an upgrade.
No monthly billing option: All paid plans require an annual commitment, which is a bigger ask for agencies still testing the platform.
Customer reviews
“The dashboards are clean, easy to build, and perfect for client reporting. It pulls in data from Google Ads, Meta, LinkedIn, and even TikTok without any hassle.” Bruhith I., G2
“I was not able to fetch the key matrices in the campaign(s), such as purchases, adds to cart, etc. For this, I had to add a custom box, and fill out the entires manually.” Muhammad Umar A., G2
Who Whatagraph is best for
Teams with a stable set of data sources. Each source consumes one credit regardless of plan, so predictability matters more than volume.
Teams that want a named contact for support rather than a documentation site. The CSM model suits agencies without an internal analytics owner.
6. Supermetrics
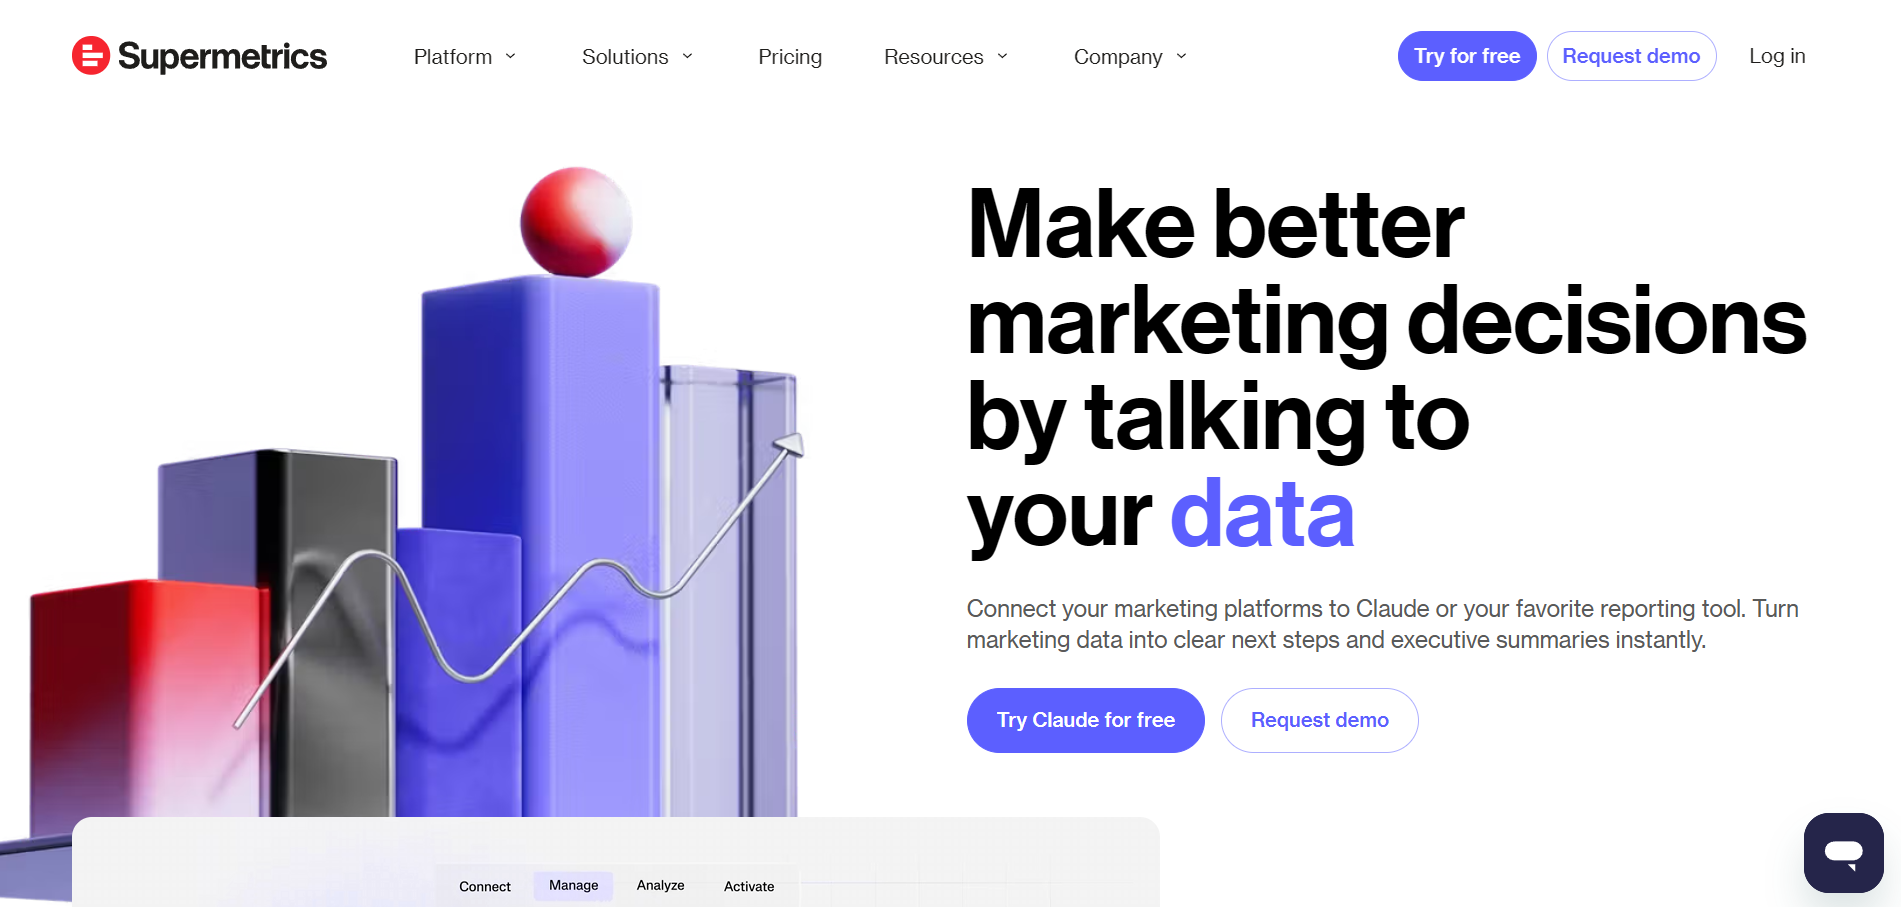
Supermetrics is a Helsinki company that started from a script connecting Google Analytics to Excel. It is now one of the largest connector platforms in marketing, with Amazon sitting as one vertical inside a catalogue spanning paid media, SEO, e-commerce, and retail media.
Key features
Three separate Amazon connectors: Amazon Ads, Amazon Seller Central, and Amazon DSP, each with its own documented connection guide, permissions model, and query types.
Enterprise-ready data pipelines: Beyond Google Sheets, Data Studio, and Power BI, Supermetrics can send Amazon data directly to data warehouses such as BigQuery, Snowflake, and Amazon Redshift.
Pricing
Plan
Price (billed annually)
Includes
Starter
From $39/month
3 data sources, 3 accounts per data source, 1 user, 1 core destination
Growth
From $159/month
7 data sources, 7 accounts per data source, 2 users, 1 core destination
Pro
From $399/month
10 data sources, 10 accounts per data source, 3 users, 1 core destination
Enterprise
Custom
Custom data sources, accounts, users, and core/data warehouse destinations
Where Supermetrics shines
It clears a security review: Annual SOC 2 Type II audits, ISO 27001 certification, GDPR and CCPA compliance, and a public trust center carrying the SOC 2 report and pentest results.
Connector data isn't permanently stored: Retrieved data sits in temporary storage and can be refetched from the source, which reduces the security audit profile.
Where Supermetrics falls short
Costs escalate quickly: Additional sources, users, destinations, and faster refresh rates are each priced separately, and several reviewers mention that costs can increase significantly as additional sources, destinations, and features are added.
Connector reliability complaints: A recurring theme in reviews is that connectors occasionally break, requiring manual troubleshooting before a scheduled report can run.
Customer reviews
"Being able to combine data from multiple sources into one report is a huge time saver for us.” Trevor I., G2
“The customer support system is frustrating. When I'm experiencing a problem, I'd like to chat with a customer support representative who can help me brainstorm all my options.”Verified G2 review
Who Supermetrics is best for
Data teams already running a warehouse. Amazon becomes one pipeline among many rather than a separate reporting product.
Teams with a dedicated connector maintainer. Reliability complaints are a recurring complaint, and the pricing model needs monitoring.
Did you know? Your choice of destination affects what the report can actually show. Data Studio, Google Sheets, and Power BI each handle chart types, filtering, and sharing differently, so comparing data visualization tools first saves you rebuilding the dashboard later.
7. DataHawk
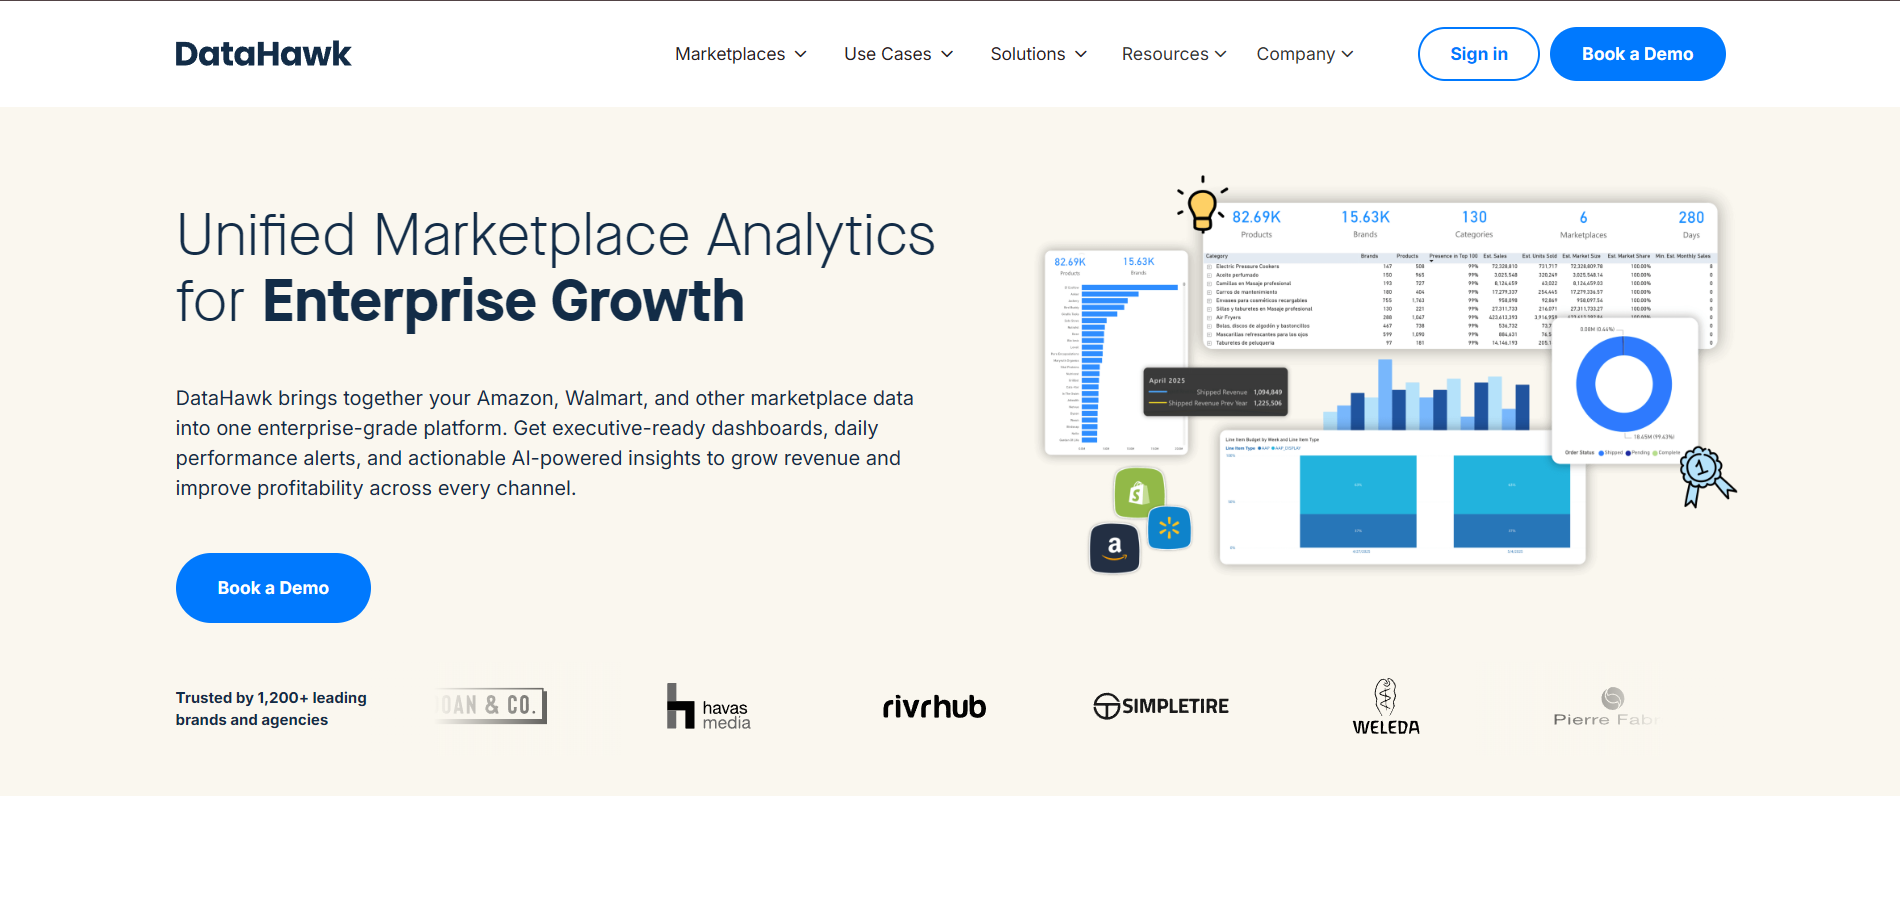
DataHawk is an end-to-end eCommerce analytics platform with teams in Europe and the US, working with brands and sellers across Amazon, Walmart, and Shopify. Its core product is a managed data and analytics platform, with professional and managed services available alongside the software
Key features
AI-powered anomaly detection: DataHawk uses AI to detect unusual changes in sales, inventory, advertising, and marketplace performance, helping teams identify potential issues without manually monitoring every metric.
A managed warehouse you can query: Fully hosted Snowflake and BigQuery databases that DataHawk maintains and refreshes, connecting directly to Power BI, Tableau, Looker, or Data Studio.
Pricing
Plan
Price
All plans
Pricing is quoted based on account complexity. No public pricing or free trial is available.
Where DataHawk shines
White-glove onboarding: Dedicated account management, with the initial data pipeline usually live inside 24 hours.
The data stays yours: Because the warehouse is queryable, you aren't tied to DataHawk's front end, and data can be replicated onward to BigQuery, Azure, or Redshift through an ETL tool or a custom unload.
Where DataHawk falls short
No published pricing or free trial: Smaller sellers or agencies wanting to test the platform before committing budget will need to go through a sales conversation first.
Overkill for smaller catalogs: The enterprise focus and AI tooling are built for scale, and some reviewers note the platform can feel feature-heavy for teams with a small number of SKUs.
Customer reviews
“We have been able to quickly identify opportunities and analyze the size and scope of those opportunities from this tool.” Josh E., G2
“It doesn't show enough data for Amazon Mexico and the product research tool is not available at the moment.”Fernando T., G2
Who DataHawk is best for
Brands with an in-house BI team. The value is a maintained pipeline feeding tools the team already uses, not another dashboard to log into.
Organizations where analyst time is the bottleneck. If dashboard maintenance is eating a BI team's week, that is the problem DataHawk removes.
8. Sellerboard
Sellerboard is a profit analytics product for Amazon sellers, with additional tools for inventory, customer follow-up, and PPC. It deliberately covers what happens after a listing goes live rather than product or keyword research, and it is built for the seller rather than an agency reporting to one.
Key features
Real-time net profit dashboard: Sellerboard connects directly to the Amazon Seller Central API and pulls in fees, FBA costs, advertising spend, refunds, and the COGS you provide, then shows true net profit rather than Amazon's raw revenue figures.
Money Back reimbursement reports: Identifies FBA errors, including lost and damaged stock, then generates a claim report and a submission template with the dates, transaction IDs, SKUs, and ASINs already filled in.
Pricing
Plan
Price (billed annually)
Monthly order limit
Standard
$15/mo
Up to 3,000
Professional
$23/mo
Up to 6,000
Business
$31/mo
Up to 15,000
Premium
$63/mo
Up to 50,000
Where Sellerboard shines
A full month of free access: On every plan and feature plan, with no credit card, cancel any time.
Pricing follows the business: Plans are keyed to monthly order volume, with no per-seat or per-client charge, so the bill follows how much you sell.
Where Sellerboard falls short
Primarily Amazon-focused: Sellerboard is designed around Amazon Seller Central, so businesses that rely heavily on multiple e-commerce marketplaces may need additional reporting tools.
Not built for agencies managing many clients: There is no white-label portal or multi-client dashboard in the way Reporting Ninja or AgencyAnalytics offers.
Customer reviews
“I really like the ability to determine any date range to check my performance, which allows me to keep track of my performance anytime on Amazon.”Mariam E., G2
“You have to use a 2nd sellerboard product for Shopify, and it can't be all together with your Amazon and Walmart shops.”Verified User, G2
Who Sellerboard is best for
Individual FBA sellers focused on margin. If your main question is "Am I actually profitable on this SKU?", this is the most direct answer on the list.
Sellers running their own account. Nobody in the workflow needs a branded portal or a client login.
How to choose the right Amazon reporting software
The best Amazon reporting software depends on the type of data you need. Some platforms focus on advertising, others on Seller Central reporting, while a few combine both. Before choosing, consider these four factors.
1. Does it cover Amazon Ads, Seller Central, or both?
This is the first question to answer. Amazon Ads tools show you campaign performance and ACOS, while Seller Central tools show you sales, inventory, and fees. Few platforms cover both natively, and picking the wrong one often means adding a second tool later.
If your agency's Amazon reporting need is really about fitting Amazon Ads into a dashboard you already run for Google Ads and Meta Ads, Reporting Ninja’s Amazon Ads reporting is built for exactly that scenario.
Preview your Amazon Ads data inside the same dashboard as your other paid channels before committing to a plan. Start your free trial to see it side by side with your existing reports.
2. How deep does the fee and profit detail go?
Amazon charges more than 40 distinct fee types, and basic tools often capture only the obvious ones like standard FBA fulfillment fees. If profit accuracy is the whole point of your reporting, check specifically whether a tool accounts for aged inventory surcharges, storage fees, and reimbursements, not just the fees everyone already knows about.
3. Can it scale without per-client pricing?
Per-client and credit-based pricing models can look cheap on day one, but once your roster or data source count grows, it quickly becomes expensive. Flat, account-based pricing tends to be easier to forecast as an agency scales, which is why Reporting Ninja's pricing is structured around connected accounts rather than per-client fees.
4. Does it fit into your existing dashboard, or replace it
If you already have a Data Studio or Google Sheets reporting workflow that clients are used to, a connector that fits into that existing setup, rather than a standalone dashboard, is usually the smoother path. This matters just as much for e-commerce reporting generally as it does for Amazon specifically.
Common mistake: Choosing a tool based on its Amazon Ads features alone, then discovering months later that the client actually wanted Seller Central sales and inventory data the whole time. Confirm which side of Amazon reporting the client cares about before you pick a tool.
Create your Amazon reports in minutes with Reporting Ninja
If Amazon Ads is one piece of a bigger marketing intelligence reporting puzzle for your clients, alongside Google Ads, Meta Ads, or other channels, Reporting Ninja lets you build that full picture once and use it every month without starting from scratch. Features like reusable templates, scheduled delivery, and a branded client portal help reduce the manual work involved in recurring client reporting.
Ready to see it for yourself? Build your first Amazon Ads report template and see exactly how it looks before touching a client account. Start your free trial, with no credit card required.
{{cta-block-v1}}
FAQs
What is an Amazon report?
An Amazon report is a summary of performance data pulled from Amazon, most commonly either Amazon Ads campaign metrics or Seller Central sales, inventory, and fee data. Many teams need both, which is why some sellers use two tools together.
Does Amazon Seller Central include reporting?
Yes, Seller Central includes native business reports covering sales, traffic, and inventory. These reports are not designed for multi-account agency use, blending with other channels, or automated client delivery, which is why third-party tools exist.
Can I automate Amazon sales reports?
Yes. Tools like Reporting Ninja, Sellerboard, and KwickMetrics connect directly to Amazon's APIs and refresh automatically, removing the need for manual CSV exports from Seller Central.
Which Amazon reporting tool works with Data Studio?
Porter Metrics and Supermetrics both send Amazon Seller Central data into Data Studio. For Amazon Ads reporting, Reporting Ninja delivers it through a built-in custom reports platform with branded, scheduled, client-ready reports. The right choice depends on which Amazon data you need and where you want it to live.
How do agencies report Amazon performance to clients?
Most agencies either connect Amazon data into an existing multi-channel dashboard alongside Google Ads and Meta Ads or use a dedicated Amazon and Walmart platform if profit and inventory reporting are the client's main concern.
Elevate your marketing reports to the next level
Sign up for a 15 days free trial. No credit card required.
We use analytics cookies (Google Analytics) and Promptwatch to measure visits, including those from AI assistants. Accept or deny them; you can change your choice anytime in Cookie settings. Cookie policy