
X Ads report template
Opens with the money and the cost of an interaction, then follows the budget through campaigns, ad groups and posts to what they produced on your site.
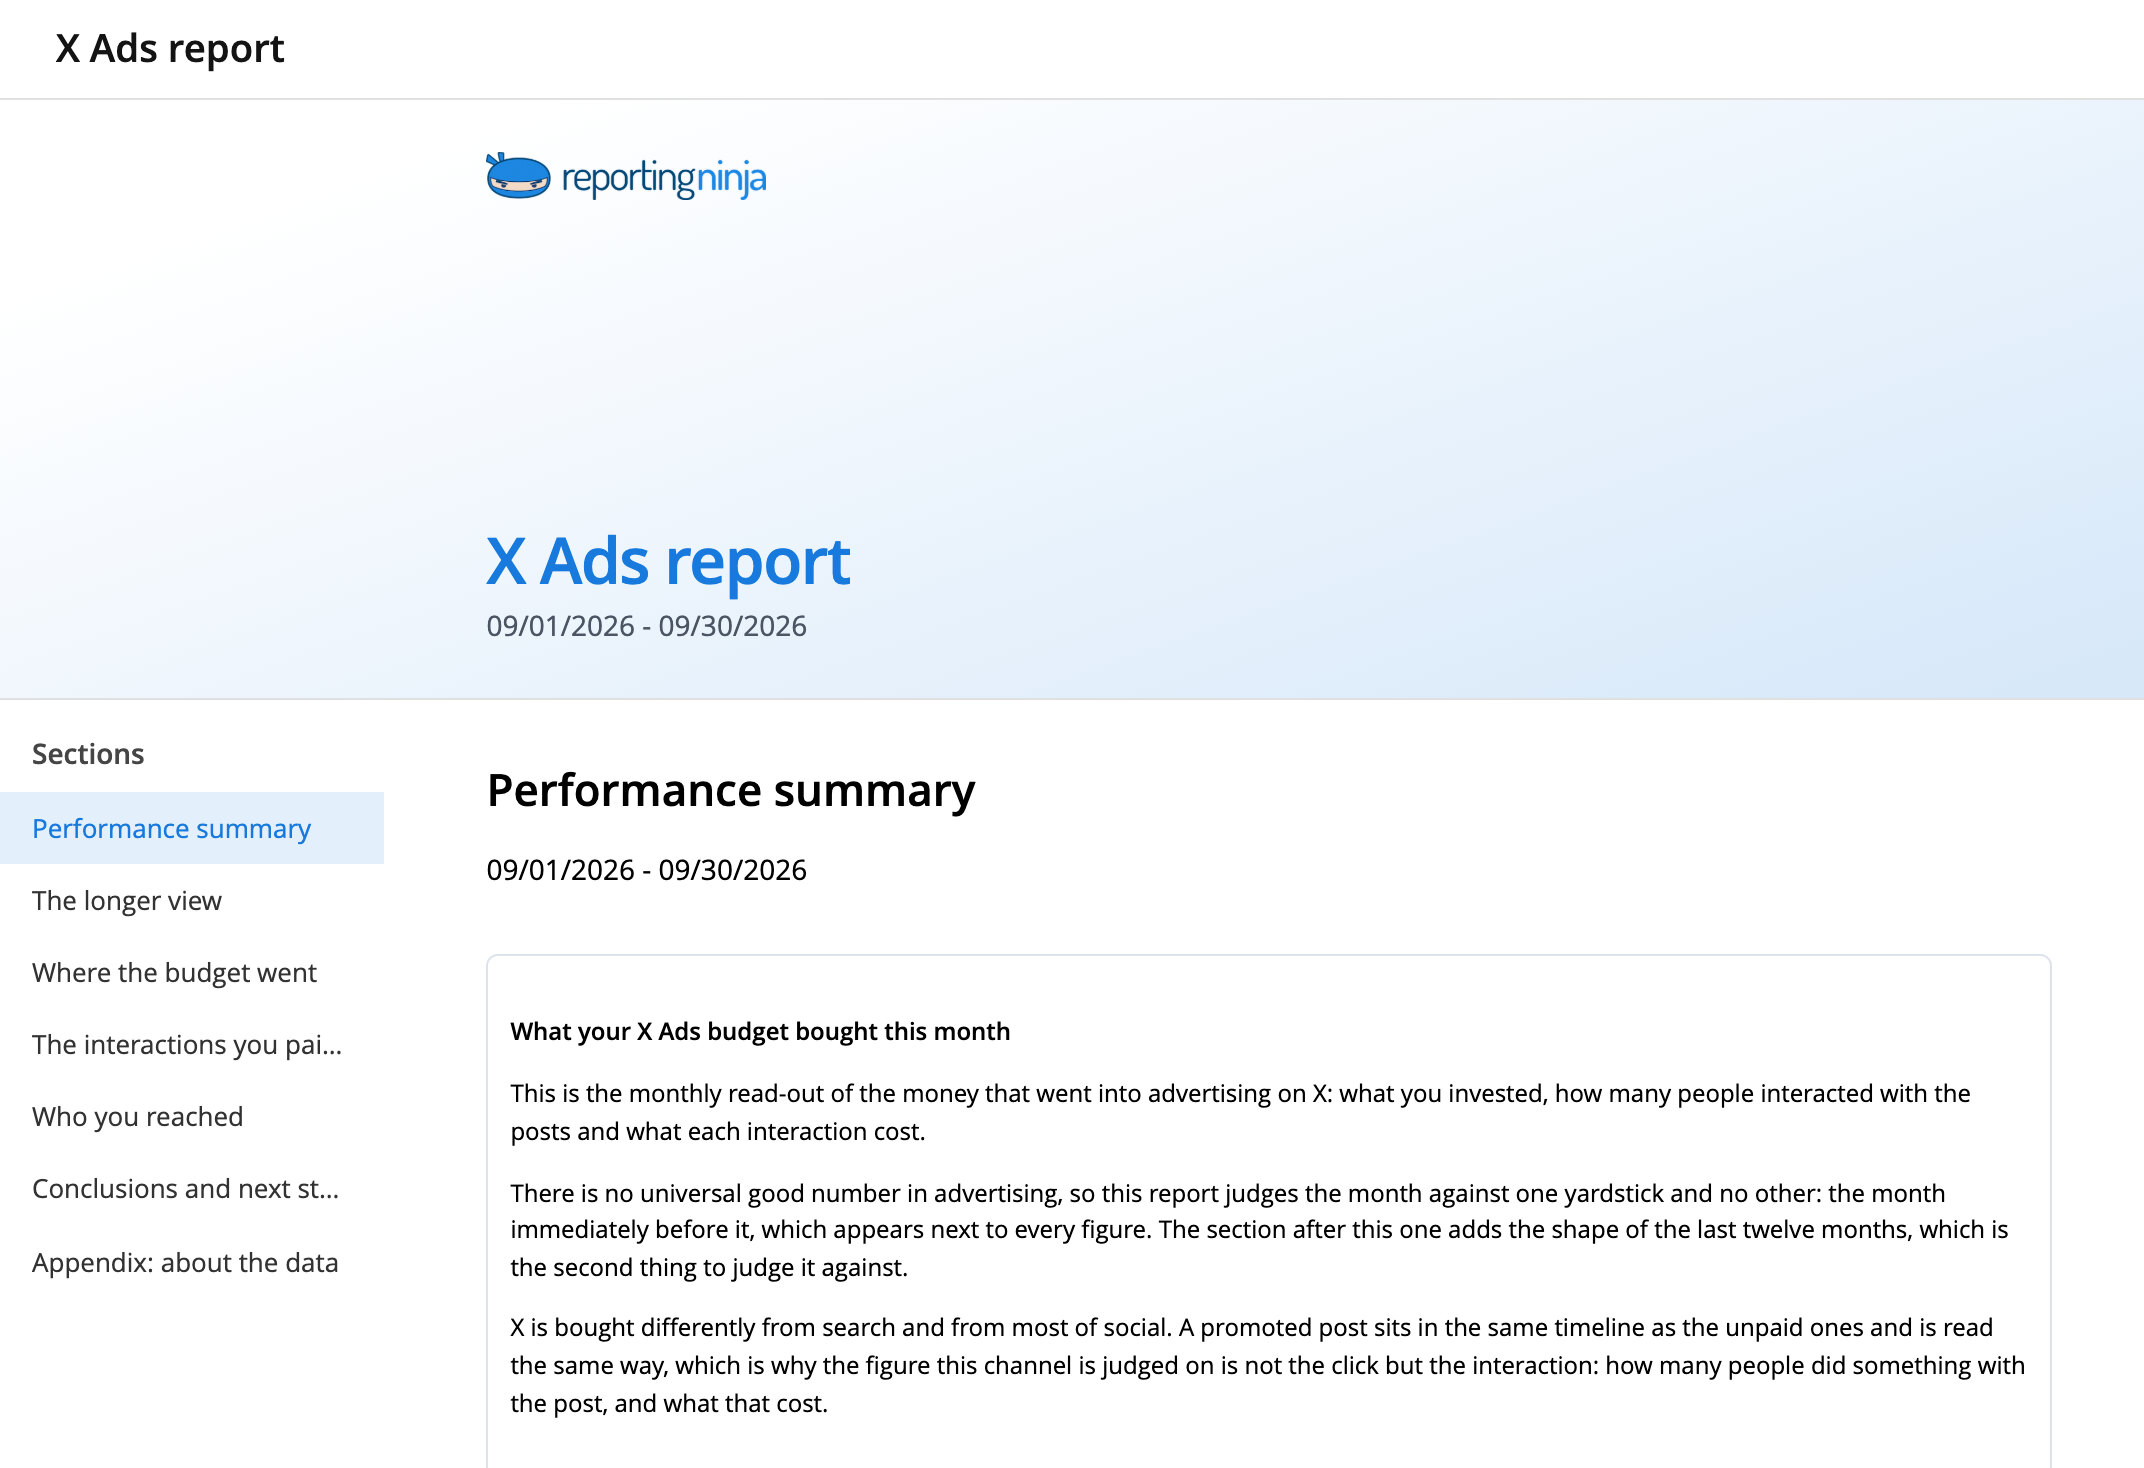
The sections, in the order your client reads them
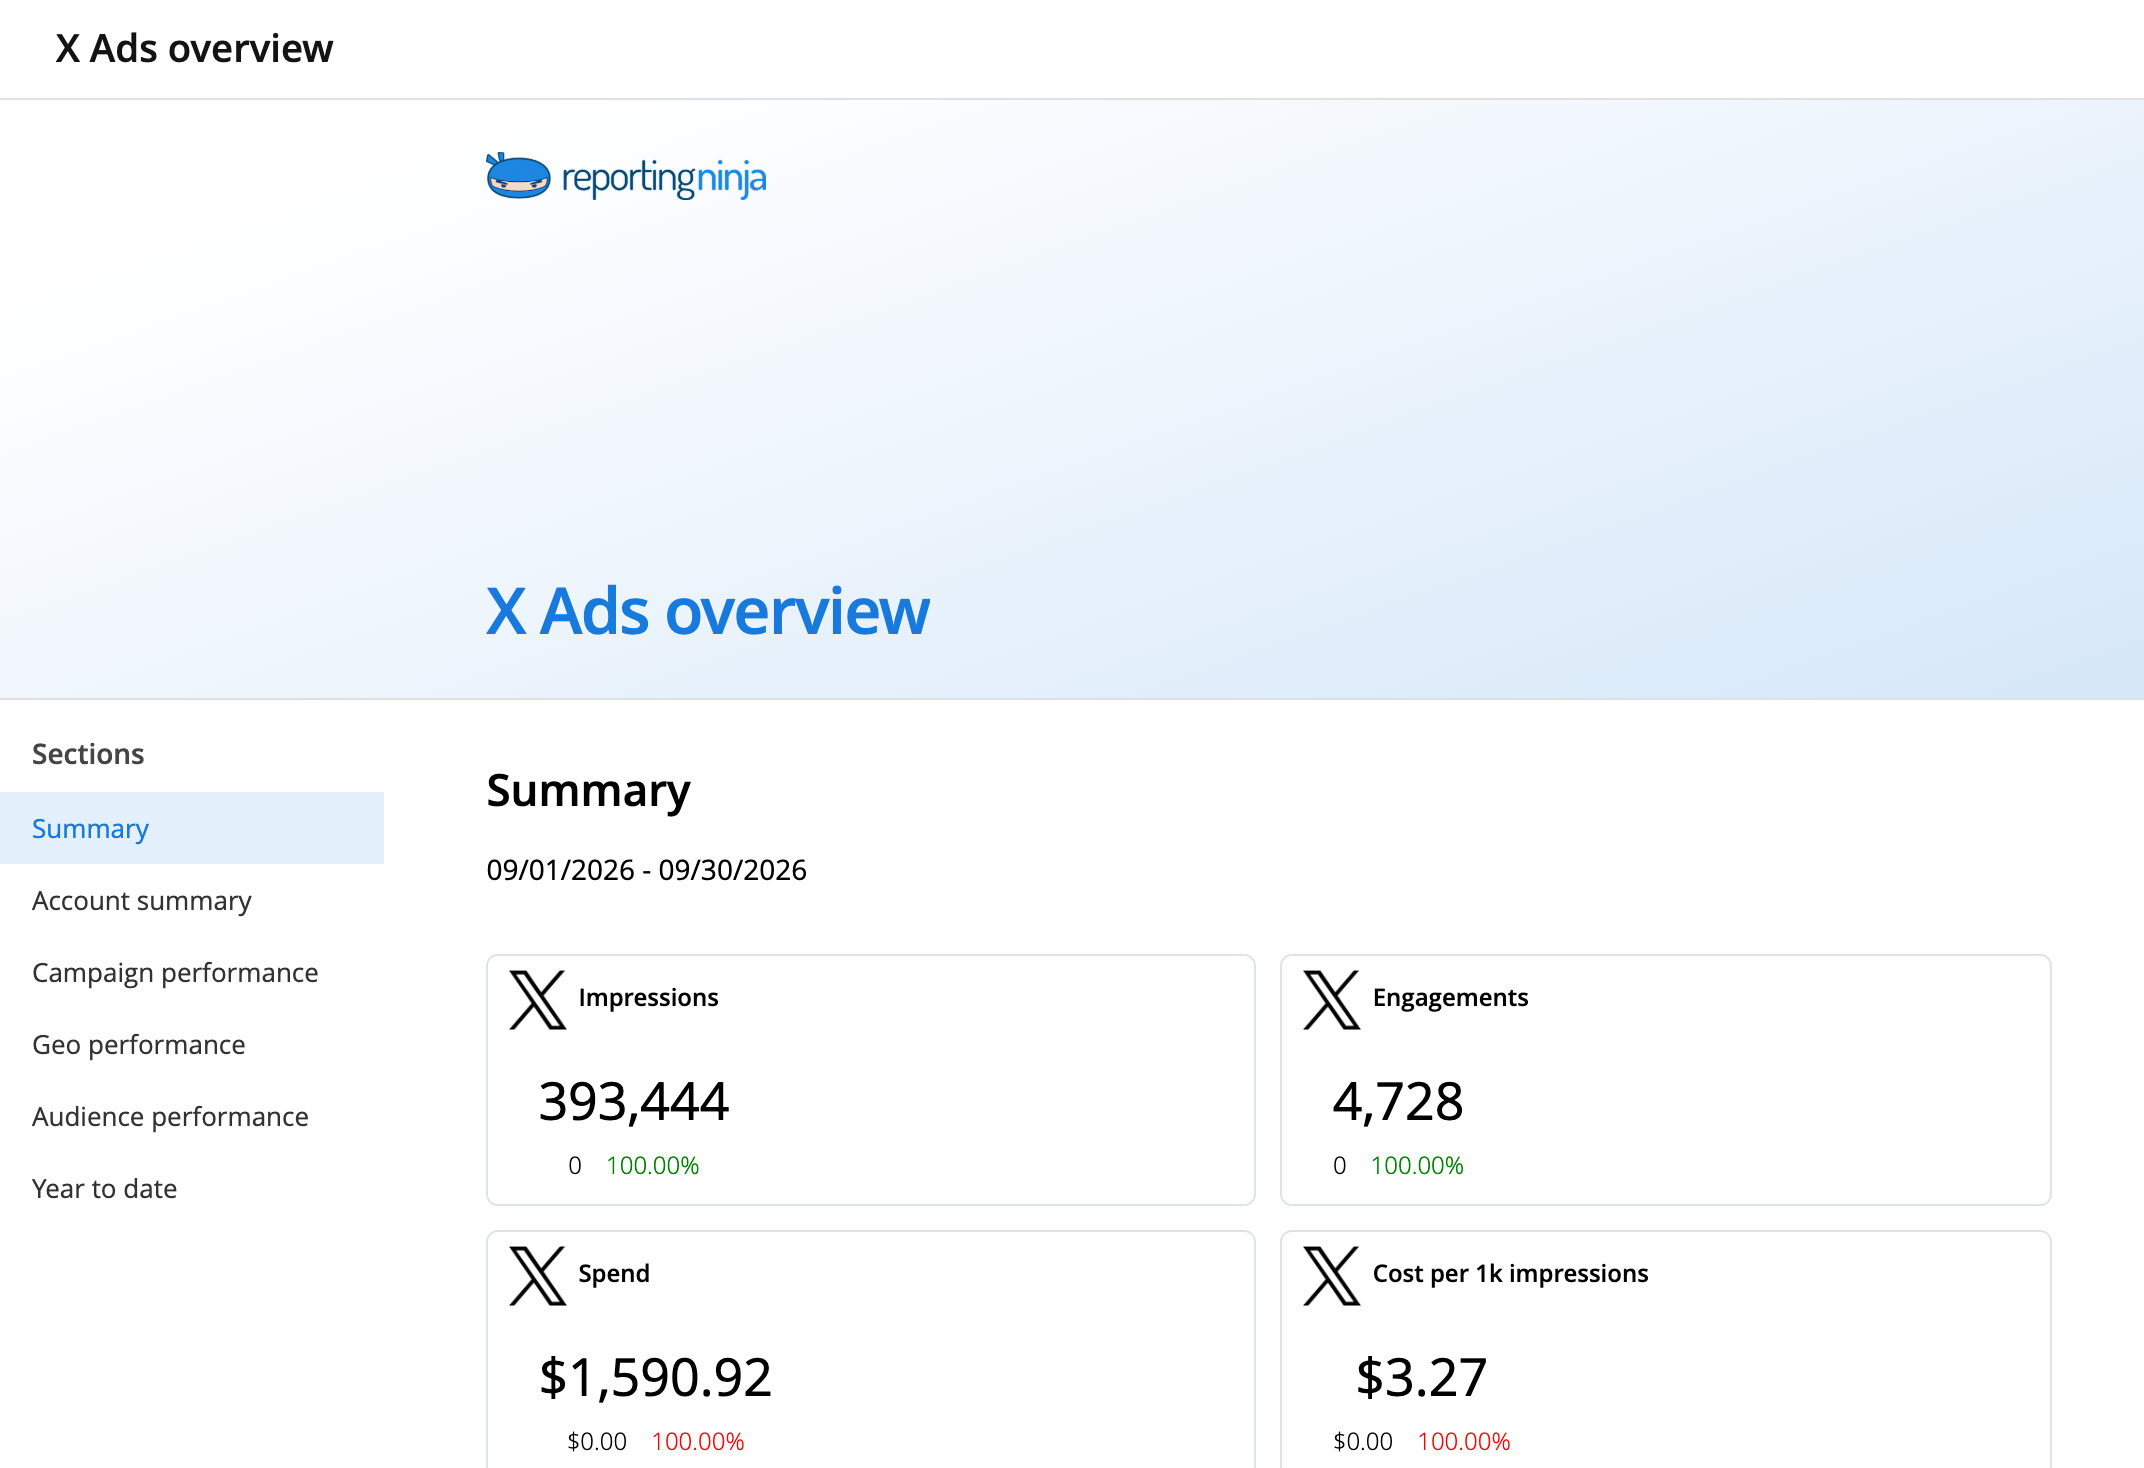
The monthly report an agency sends to its client to show what the X Ads budget bought. It opens with the money and with the figure this channel is judged on (what an interaction cost) then follows the budget through campaigns, ad groups and the posts themselves, ending with what they produced on your website where the account measures it. It explains what X counts as an interaction and why that number is so much larger than the number of clicks.
Each section opens the preview at that point, on realistic data.
From template to client report

Create it on your accounts
Pick the account for each source and the sections you want. The report opens with your client's data.

Brand it and edit it
Apply your brand template and change any section, widget or text in the editor.

Deliver it
Schedule the email, send a share link or publish it in your client portal.
Keep exploring the catalog
Frequently asked questions
Is this template included in my plan?
Yes. The whole catalog is included on every plan, free trial too.
Can I see it before I sign up?
Yes. Open the preview: it shows every section of the report on realistic data.
Start from a report that is already done
Pick one from the catalog and make it yours.
