SEO
August 6, 2026
6 SEO report examples, templates & what to include



You've got GA4 open in one tab, Google Search Console in another, and a rank tracker spreadsheet that's already out of date. Somehow, all of that has to become one report that your client will review before their next call with you.
A good SEO report example doesn't need to be complicated. It just needs to combine traffic, rankings, backlinks, technical health, and conversions with clear explanations and practical next steps.
This guide shows what every report should include, six report formats you can adapt for different clients, how to build one step by step, and the tools that make recurring reporting much faster.
Every SEO report answers the same question about whether a client’s SEO investment is producing meaningful business results. The table below is a quick anatomy of an SEO report.
This is the one section every client reads, even if they skip everything else. Keep it to two or three short paragraphs that answer three questions immediately:
For example:
“Organic traffic increased 18% this month, driven primarily by three new page-one keyword rankings and improved click-through rates on our highest-traffic service pages. Next month we'll focus on expanding those gains by updating supporting content and improving internal linking.”
Resist the temptation to cram every achievement into this section. Clients want confidence that the campaign is moving in the right direction. The executive summary should be the headline of the report; if it isn't clear here, many readers won't discover it later.
Organic traffic is usually the first chart clients look for, since it's the clearest indicator of whether SEO visibility is translating into visits. Extract sessions, users, and engagement metrics from GA4, filtered to organic search, then compare month over month and year over year to separate genuine growth from seasonal noise.
Go beyond the headline number by breaking traffic down by landing page. A report showing organic traffic grew 20% is useful. But showing that 80% of that growth came from just three landing pages tells you and the client exactly where to focus next.

List position changes for the keywords that matter most to the client's business, grouped by landing page, service, or search intent so clients can quickly see which parts of the site are gaining visibility.
Pay particular attention to keywords moving into or out of the top 10. A service page moving from position 12 to 8 is often more significant than another moving from 42 to 31, since it's entered the range where users are far more likely to see and click the result.
If you're tracking branded and non-branded keywords separately, say so explicitly. Clients often assume ranking gains include their own brand searches, which inflates the perceived win. A simple table of your 10 to 15 highest-priority keywords, with current position, previous position, and the landing page each supports, does more here than pages of ranking exports.
{{cta-block-v1}}
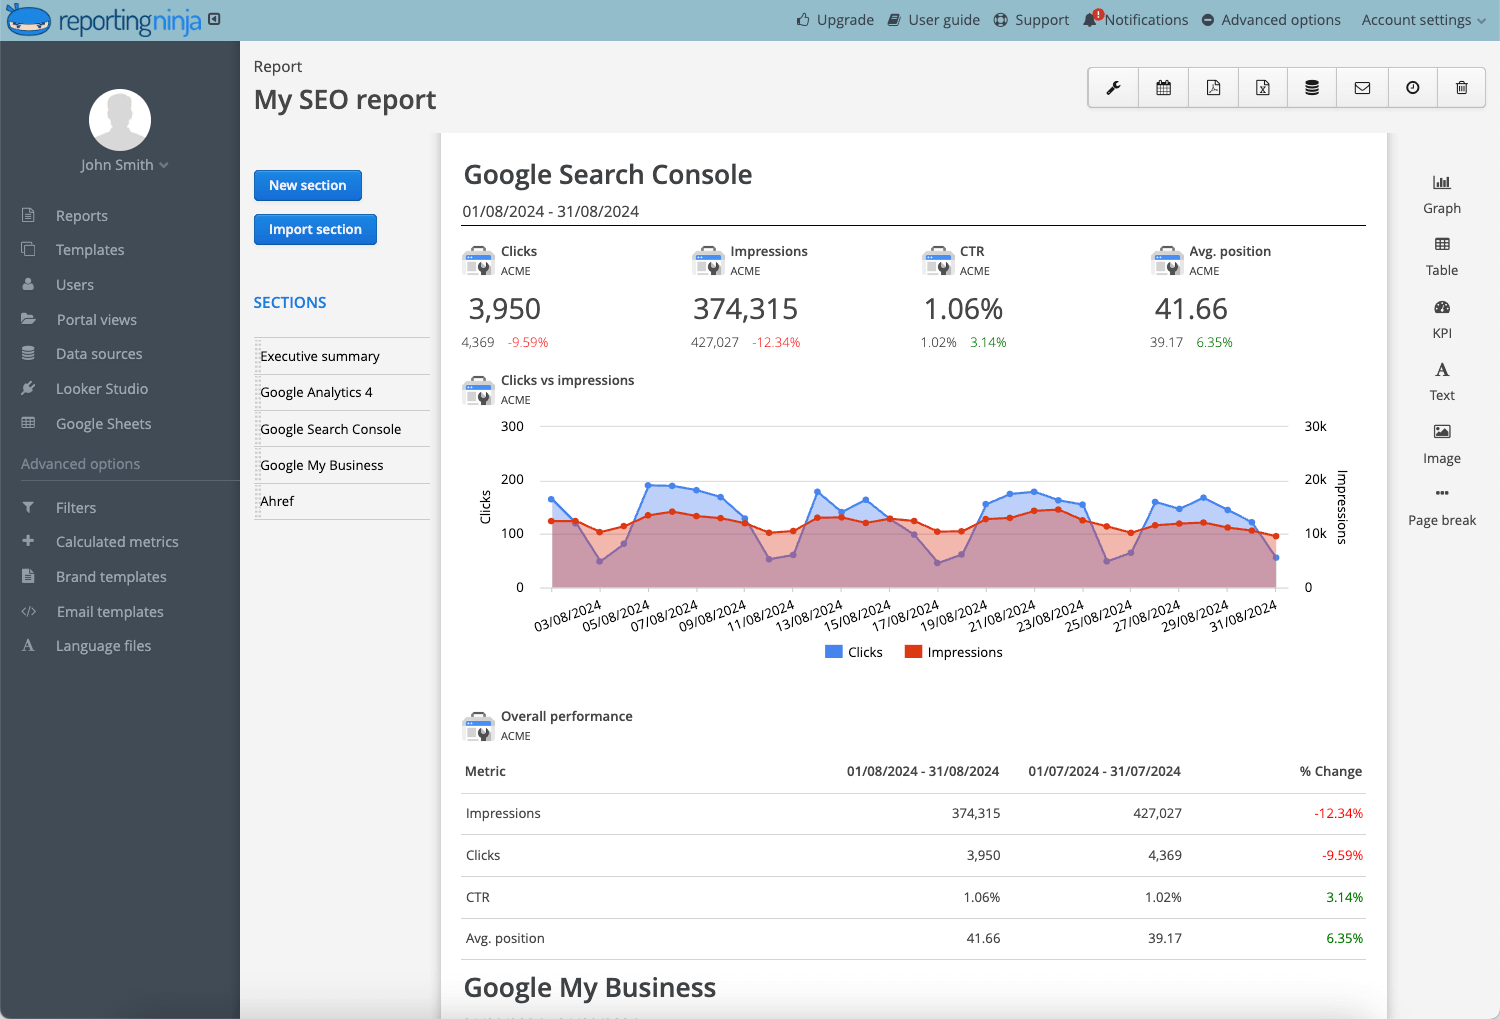
Google Search Console is often the earliest place you'll spot SEO progress because it shows how people interact with your pages directly in search results. The performance report tracks four core metrics:
Together, they tell you not only how visible your pages are but also whether that visibility is turning into traffic.
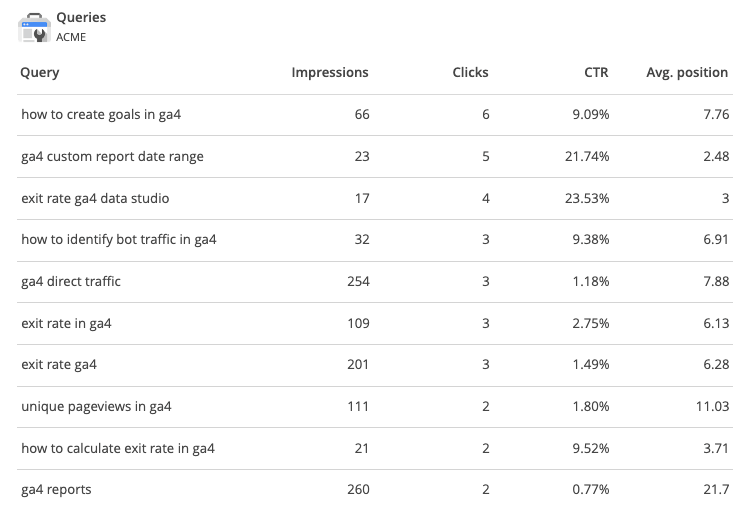
One of the most valuable reports to build is a high-impression, low-CTR report. These pages are already earning visibility, making them some of the quickest optimization opportunities. In many cases, improving the page title, meta description, or search intent alignment can increase clicks without improving rankings.
For example:
Report new referring domains earned in the period, highlight any particularly relevant or authoritative placements, and note links lost or reclaimed. If you're tracking domain rating or domain authority, treat those as directional indicators rather than KPIs. They explain long-term trends but aren't ranking factors themselves.
Consider a report like this:
That table tells a clearer story than simply reporting "domain rating increased by two points." Clients want to know whether your link-building is producing stronger authority over time and not just whether a third-party score moved.
Technical SEO explains why performance may be improving more slowly than expected. Even the strongest content strategy struggles if important pages can't be crawled, indexed, or loaded efficiently.
Rather than exporting every issue from your crawler, prioritize the problems that are most likely to affect visibility or user experience. Focus on issues such as indexing errors, broken redirects, Core Web Vitals, duplicate content, or large numbers of 404 pages.
Frame each issue with what it's costing the client, not just that it exists. "42 pages returned a 404 error" is a fact, while "42 pages returned a 404, which means Google can't credit any of the links pointing to them" is an argument.
A simple priority table also makes the section easier to understand.
Conversions are usually the metric that determines whether a client believes the SEO investment is paying off. Connect organic performance to leads, inquiries, purchases, or revenue wherever possible, and explain what drove the change, whether better rankings, a redesigned landing page, or seasonal demand.
If conversion numbers are still small, say so. A new site or a recently launched campaign often needs a few months before meaningful trends emerge. So, setting that expectation builds more trust than stretching a small number into a bigger story.
Growing organic traffic by 15% sounds impressive until you learn a close competitor grew 40% in the same period. Benchmarking helps clients see whether they're gaining ground or just riding broader demand.
Keep the comparison to two or three direct competitors and metrics tied to real decisions, such as keyword overlap, share of voice, or rankings for commercially important terms. This is also a natural place to reference a search engine ranking report if you're tracking rankings across multiple competitor domains.
If a competitor consistently outranks you for high-converting service pages, that's a far more actionable insight than simply knowing they get more traffic overall.
Not every client needs the same SEO report sample, and using the wrong one can do more harm than good. A SaaS startup measures success differently than an e-commerce store, and your reports should reflect that. Here are six common report formats, what each is designed to achieve, and when to use them.
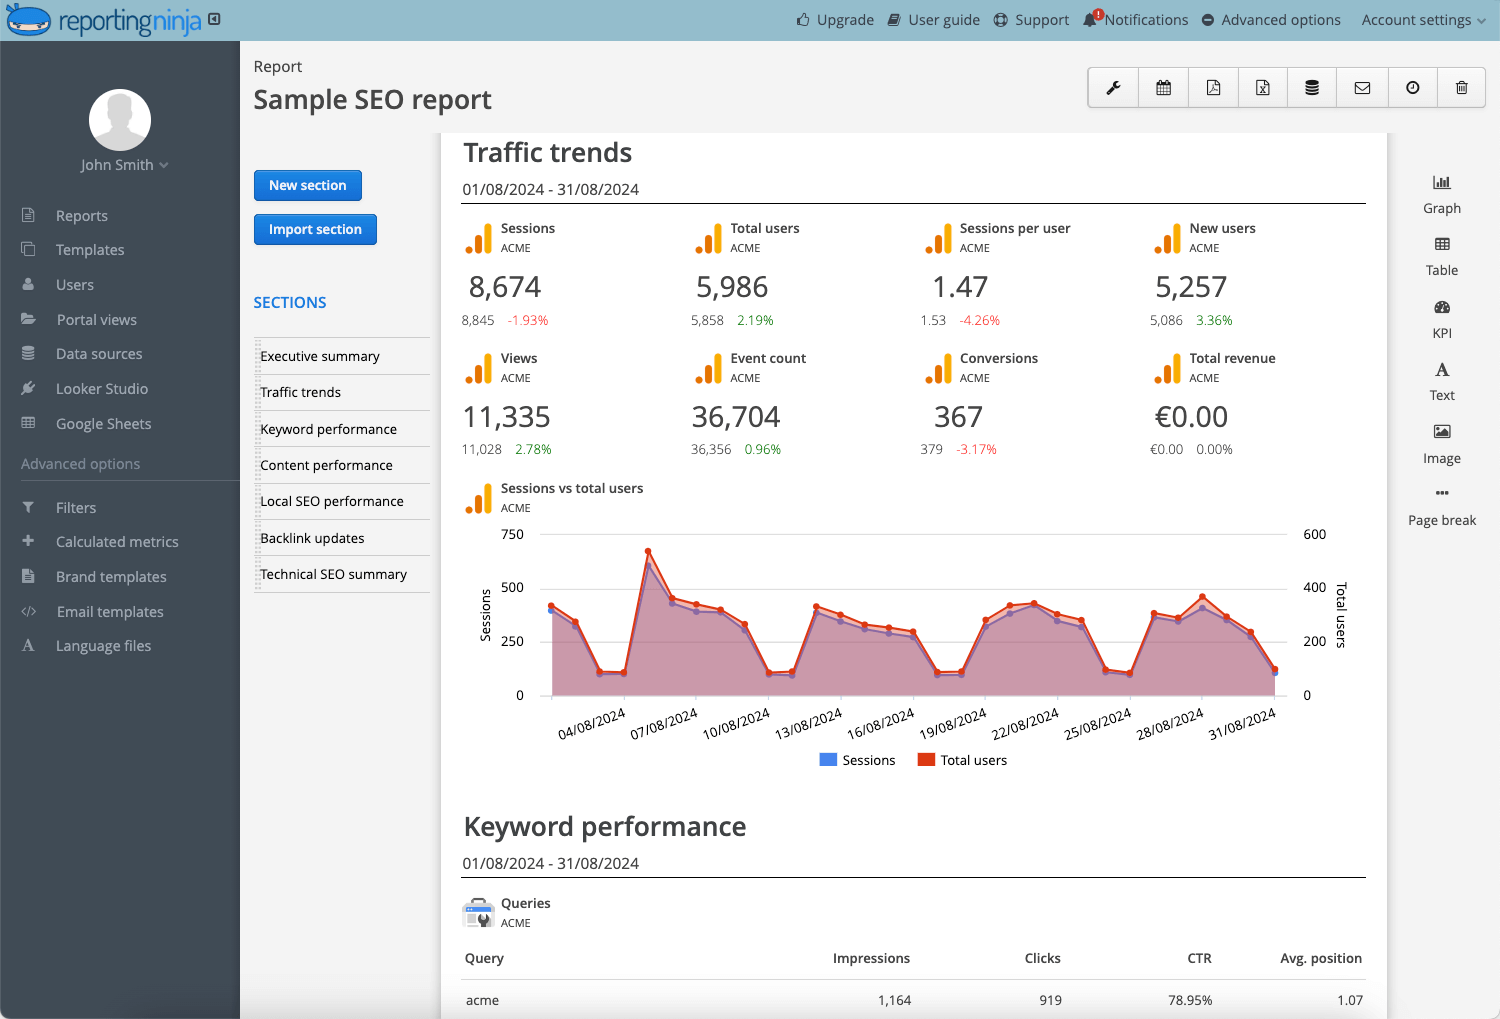
Objective: Give a complete overview of SEO performance during the reporting period.
Best for: Monthly retainer clients.
Include:
When to use it
This should be your default reporting format for ongoing SEO engagements. It gives clients enough information to understand progress without overwhelming them with unnecessary detail. A good monthly report answers the following:
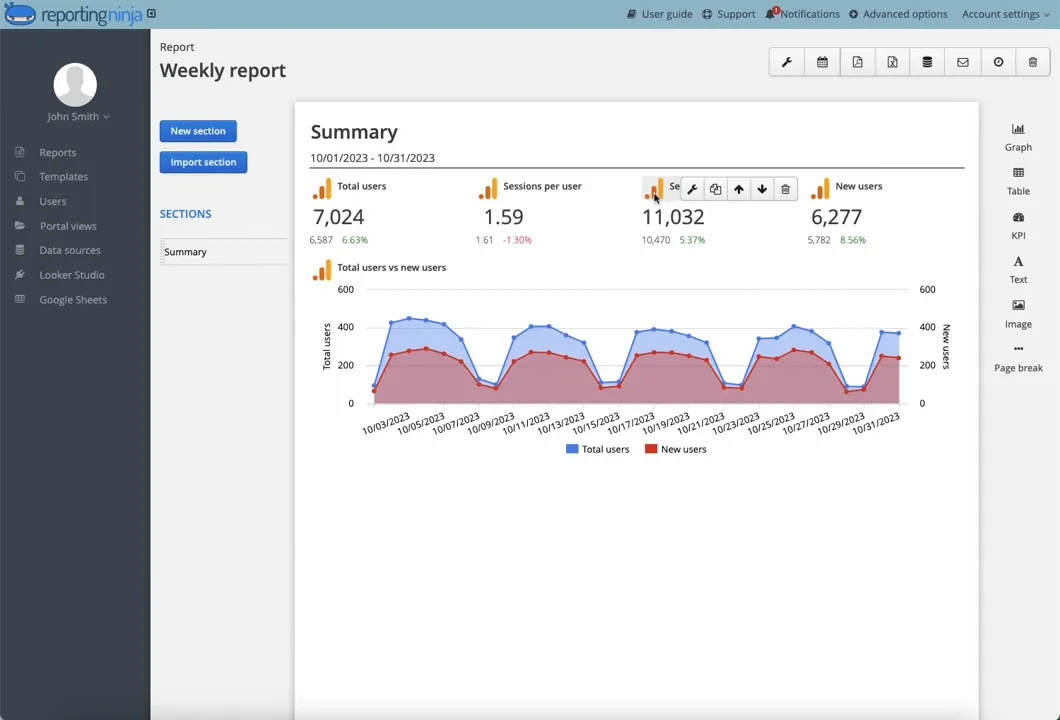
Objective: Give busy stakeholders the outcomes in under two minutes.
Best for: Business owners, executives, and marketing directors.
Include:
When to use it
This report exists because executives consume information differently from SEO specialists. Instead of reviewing dozens of charts, they typically want a quick answer to three questions:
Keep it to a single page. If stakeholders ask for more detail, you can attach the full monthly report as supporting documentation rather than forcing everyone to read the same report.
Objective: Monitor visibility changes for strategically important keywords.
Best for: Content-heavy campaigns, new SEO launches, and competitive industries.
Include:
When to use it
Use this format any time keyword movement is the main story, rather than one line in a broader report. This is typically during a new content push or in a competitive category where rankings shift month to month. Rather than sorting keywords alphabetically, group them by landing page, service, or funnel stage. Clients understand trends much faster when related keywords are presented together.
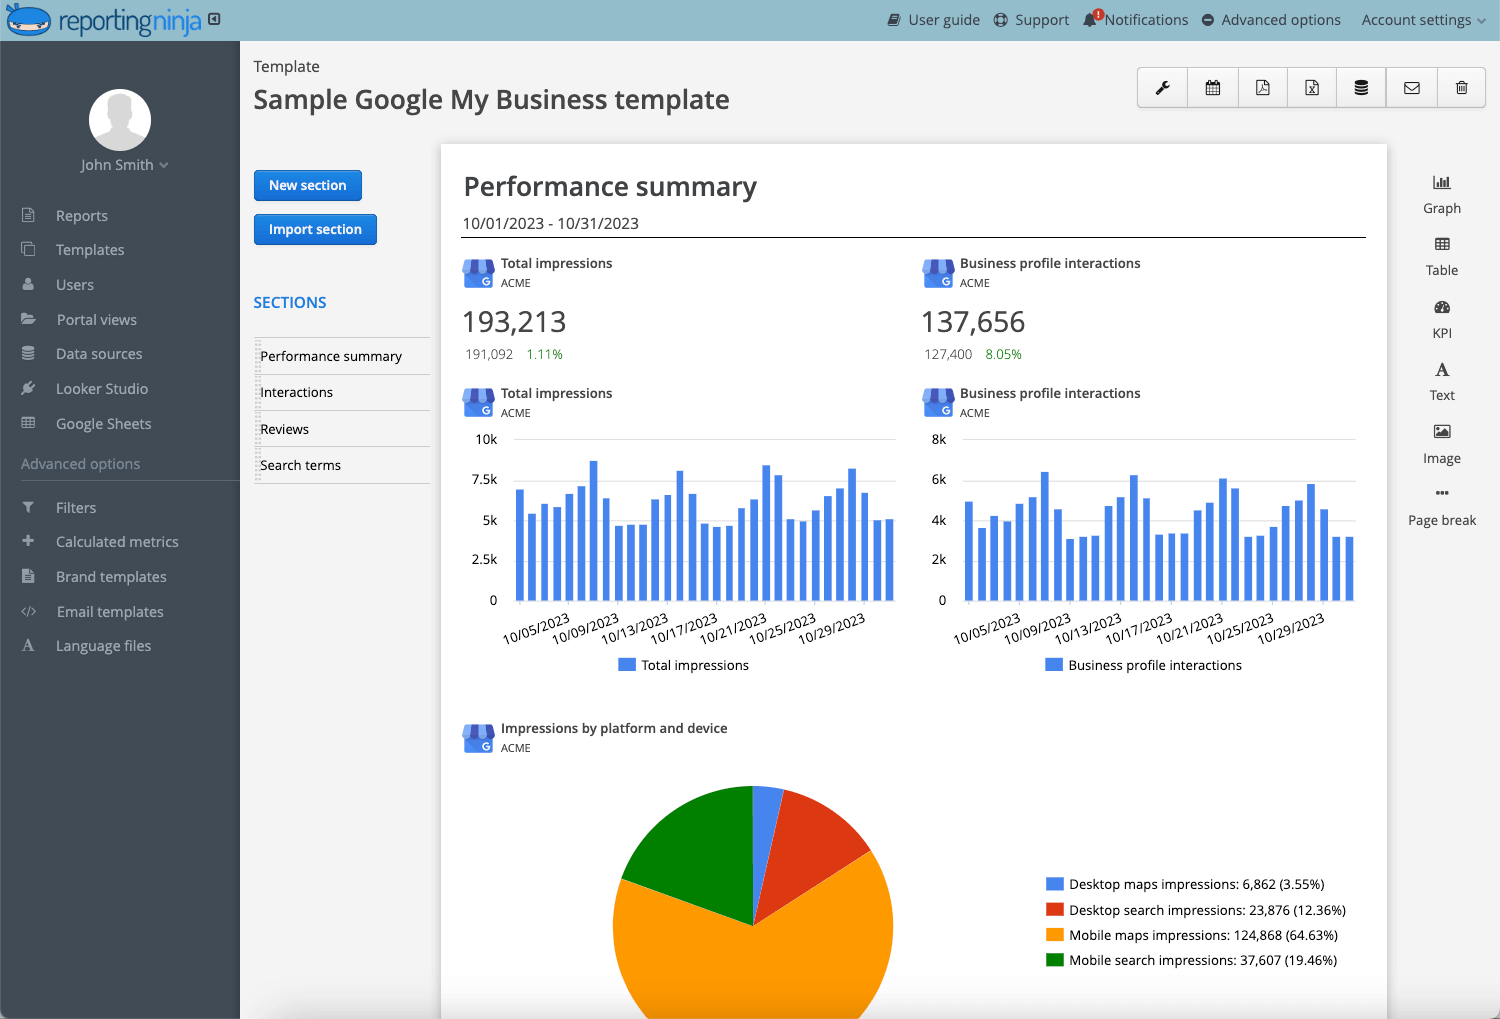
Objective: Measure search visibility within a specific geographic market.
Best for: Local businesses, franchises, and agencies managing multiple locations.
Include:
When to use it
Local SEO reports should focus on customer actions. For many businesses, an increase in phone calls or direction requests is far more valuable than a higher ranking for an informational keyword, so this format fits any client whose revenue depends on a specific geographical market.
If you're reporting on multiple locations, avoid combining everything into one dashboard. Separate reports make it much easier to identify underperforming markets and share location-specific recommendations with franchise managers.
Objective: Prioritize technical issues affecting search performance.
Best for: New clients, technical audits, enterprise websites, and recovery projects.
Include:
When to use it
Lead with this format at the start of a new engagement or any time performance has stalled and something on the technical side is likely the cause. The most effective audit reports don't overwhelm clients with hundreds of warnings from a crawler.
Clients respond much better to a prioritized action plan than a technical score alone because they immediately understand where resources should be spent first.
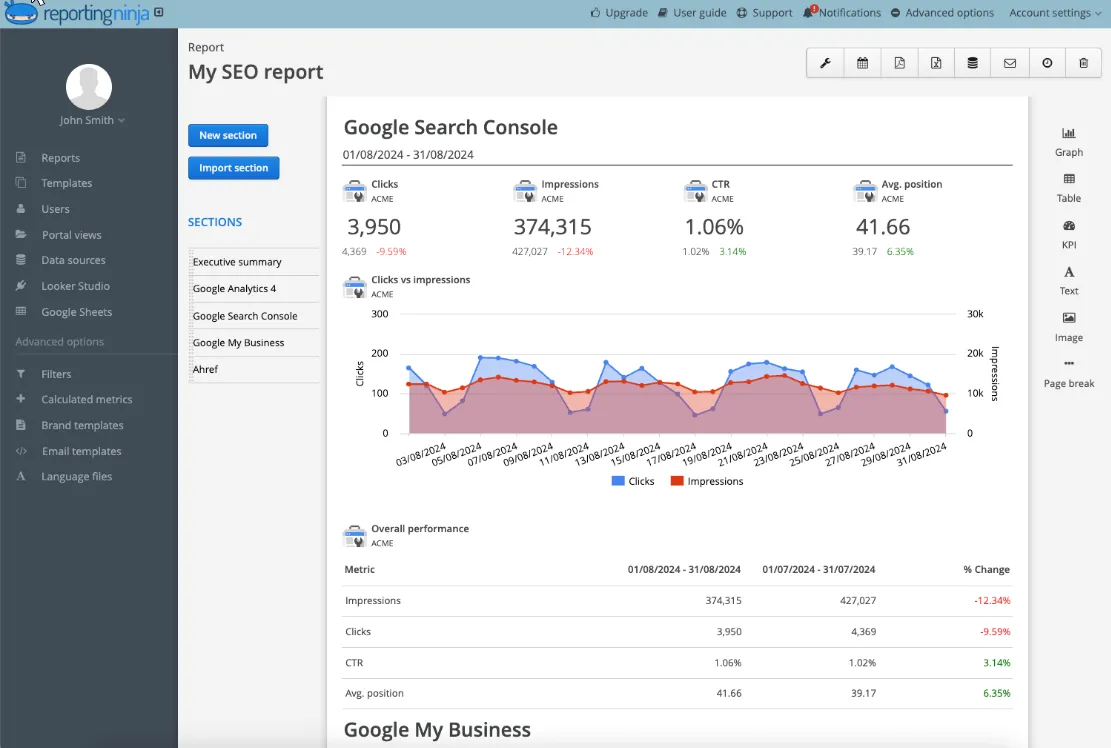
Objective: Deliver professional reports under your agency's own branding.
Best for: Marketing agencies, consultants, and white-label providers.
Include:
When to use it
Use this format for any client-facing report once you're managing more than a handful of accounts. White-label SEO dashboards reinforce your agency's identity by keeping every client-facing touchpoint consistent. They're particularly valuable when managing multiple accounts because branding, formatting, and recurring delivery become standardized instead of you having to manually recreate them each month.
Six report formats, built by hand, every month, for every client, are exactly the kind of repetitive work automated templates exist to remove. Choose a Reporting Ninja template and set up your first format in minutes, not hours.
Whether you're reporting to a single client or managing dozens of accounts, the process follows the same five steps. The difference between an average report and an excellent one is rarely the data itself, but instead how clearly that data helps someone make a decision.
Before you build anything, agree with the client on what actually counts as success for their business. A SaaS client chasing demo signups needs a very different metric set from a local business chasing phone calls. Building the same generic report for both wastes effort and buries what matters to each.
One question is what decides your direction here: "What decision do you want this report to help you make?" If the client can't answer that, refine the KPIs before building the dashboard.
At minimum, you need GA4, Search Console, and a rank tracker feeding into wherever you're building the report. Manually exporting and reconciling data from each source is the single biggest time sink in reporting, and it's also where errors show up, since numbers pulled at different times or with different date ranges rarely match cleanly.
Connecting these sources once, through a platform or connector, means every future report pulls fresh data automatically instead of you repeating the export process each cycle.
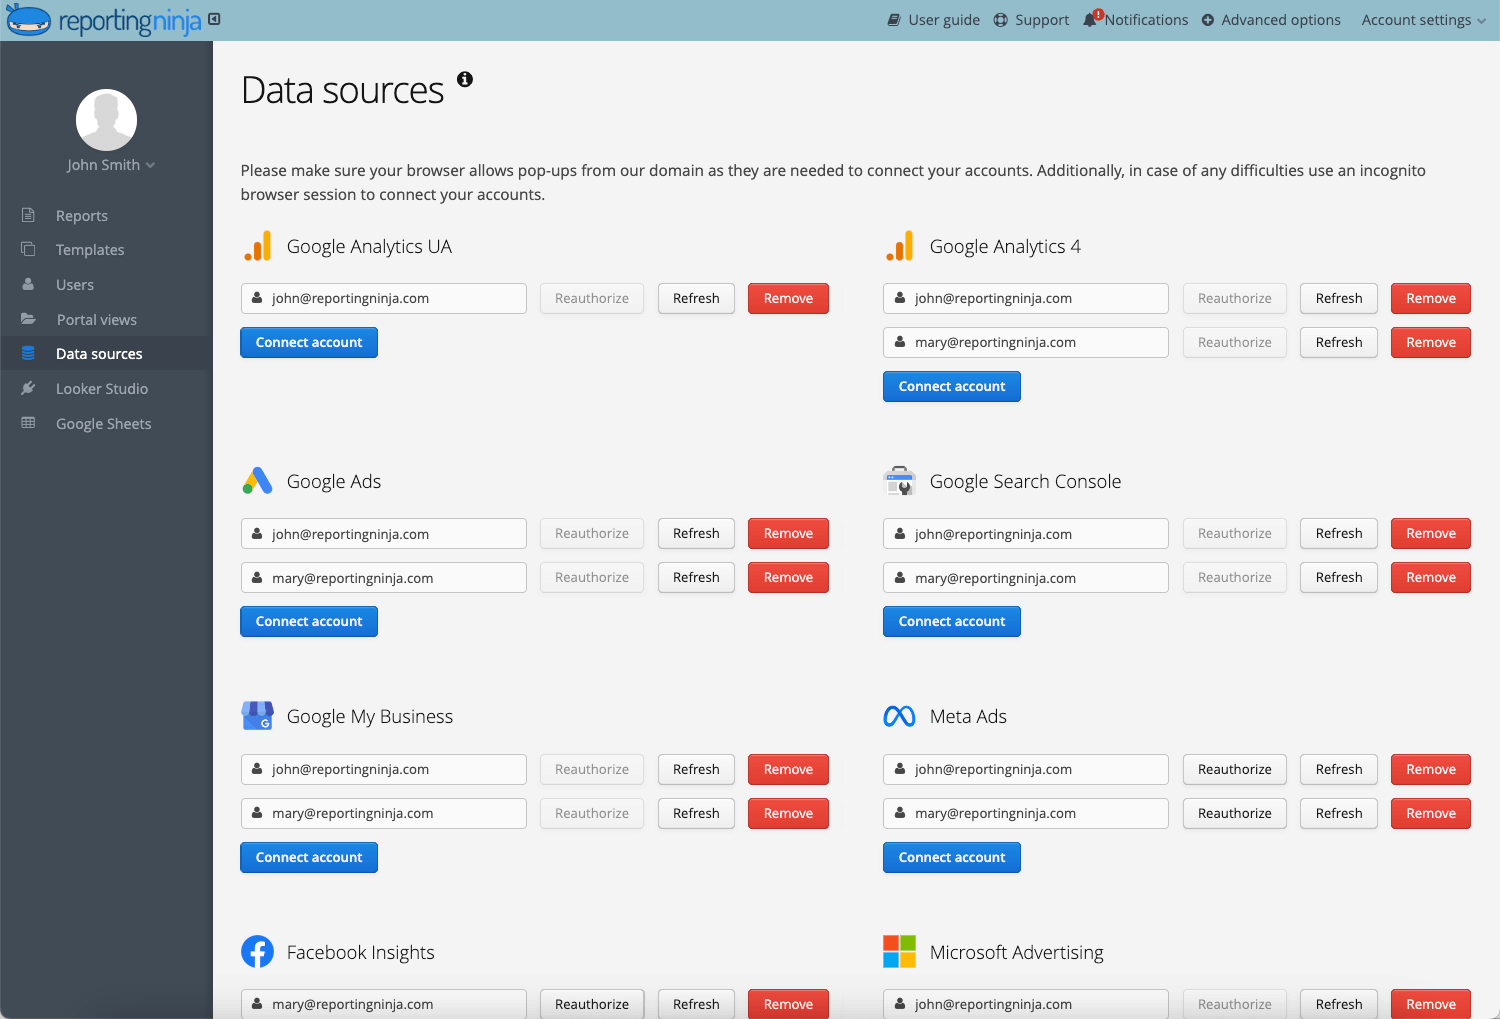
This is also where cross-channel visibility starts to matter, since most clients want SEO context alongside their other channels rather than as an isolated document. A cross-channel SEO dashboard that combines GA4 and Search Console into one view removes a step you'd otherwise repeat every single reporting cycle.
A tool like Reporting Ninja makes it easier to fold SEO into the broader client report—and avoid repeating the same manual reporting work every month.
Explore Reporting Ninja’s custom platform to automate marketing reports.
Once the data is ready, choose the right SEO report format and organize it into a structure clients can recognize every reporting period. Consistency helps stakeholders compare results over time without relearning the report every month.
Pick the report type from the six discussed earlier that matches the client relationship, then build a template you can reuse. A monthly retainer client probably needs the full report; a busy executive stakeholder needs the one-page summary; an agency sending anything client-facing needs it white-labeled.
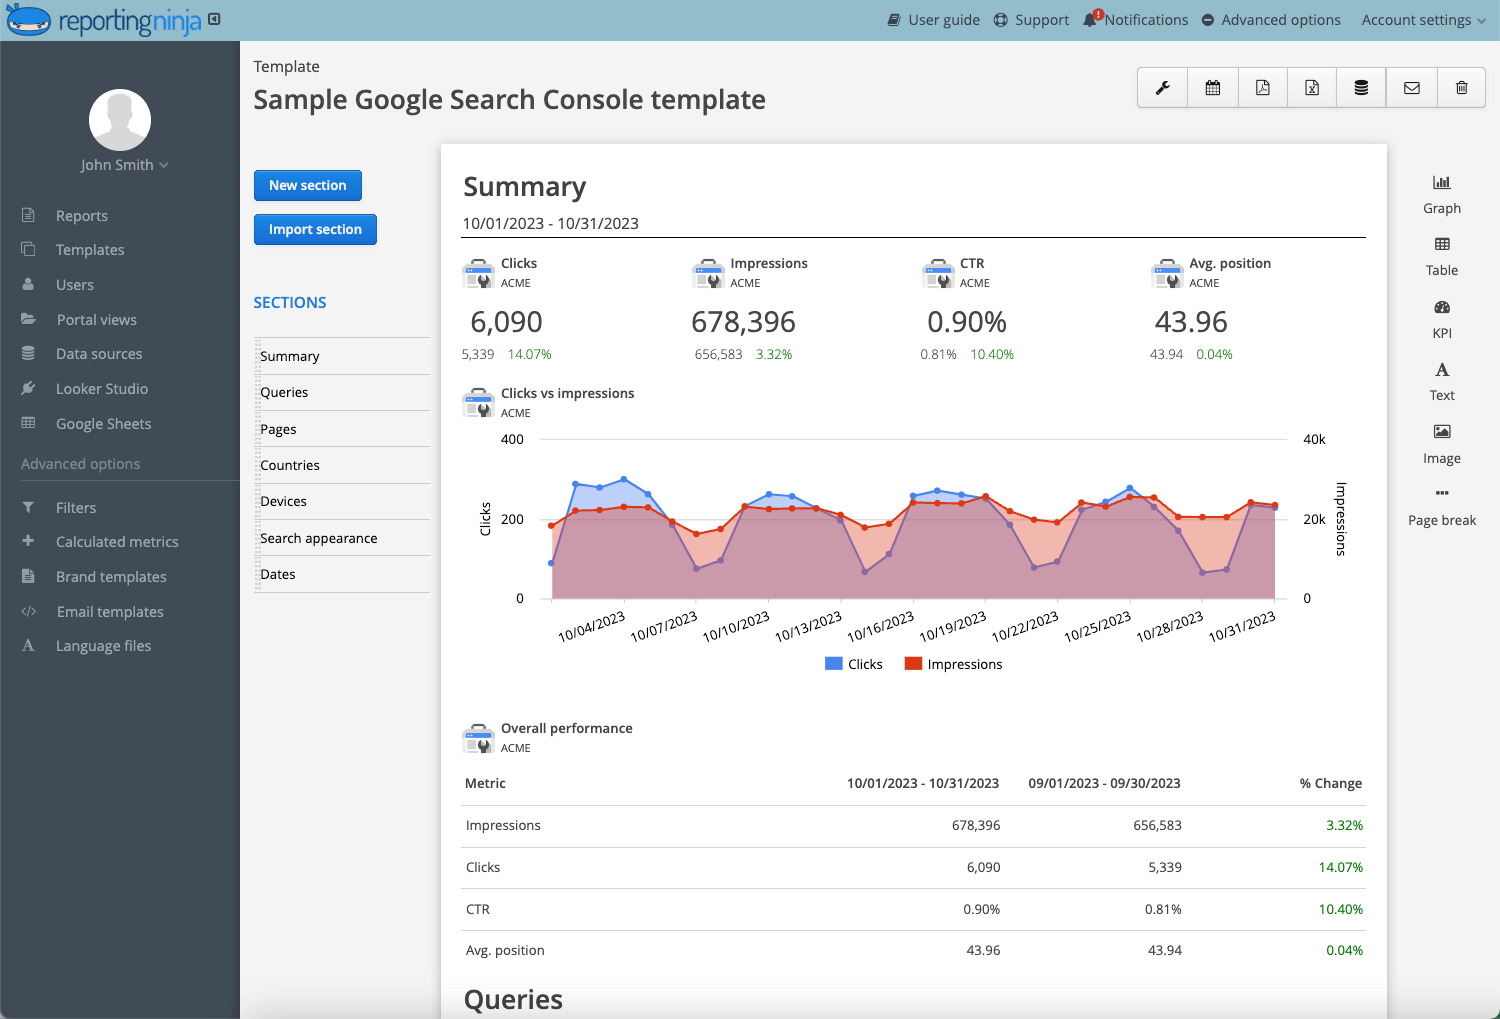
This is the step that separates a report from a spreadsheet export. Numbers answer what happened, while insights explain why it happened and what should happen next. Every major chart should answer, "What changed?" “Why did it change?”, and “What action should we take?”
The difference is clear once you look at it side by side:
Add your logo, keep layouts consistent, and set a predictable delivery schedule so clients know when to expect updates. Before you turn on automation, do one pass to confirm the branding, reporting period, commentary, and links are all correct, since a mistake now repeats every cycle.
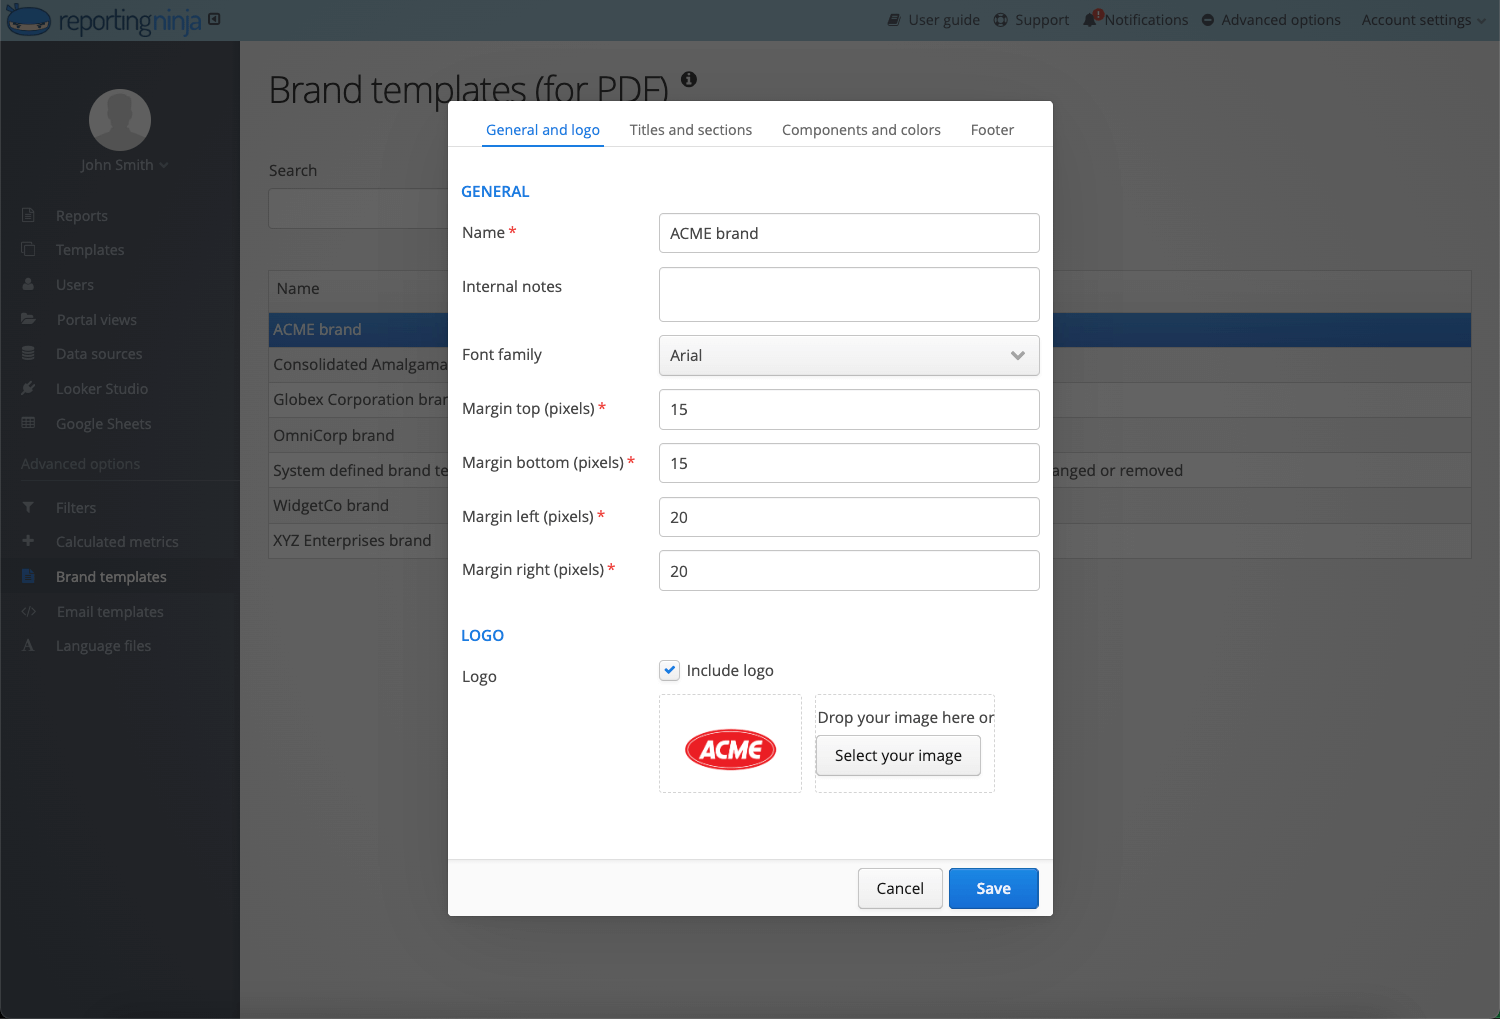
Automation becomes more valuable as your client list grows, cutting repetitive manual work while ensuring every client gets a report built from the same data and structure.
If branding and sending the same report to a dozen clients wastes hours weekly, automated delivery is the fix. Try Reporting Ninja for free to see how it replaces that entire manual routine.
You have three ways to build SEO reports: manually in spreadsheets, in Data Studio, or with a dedicated reporting platform. The right choice depends on how many clients you report on and how much time you can spend maintaining dashboards.
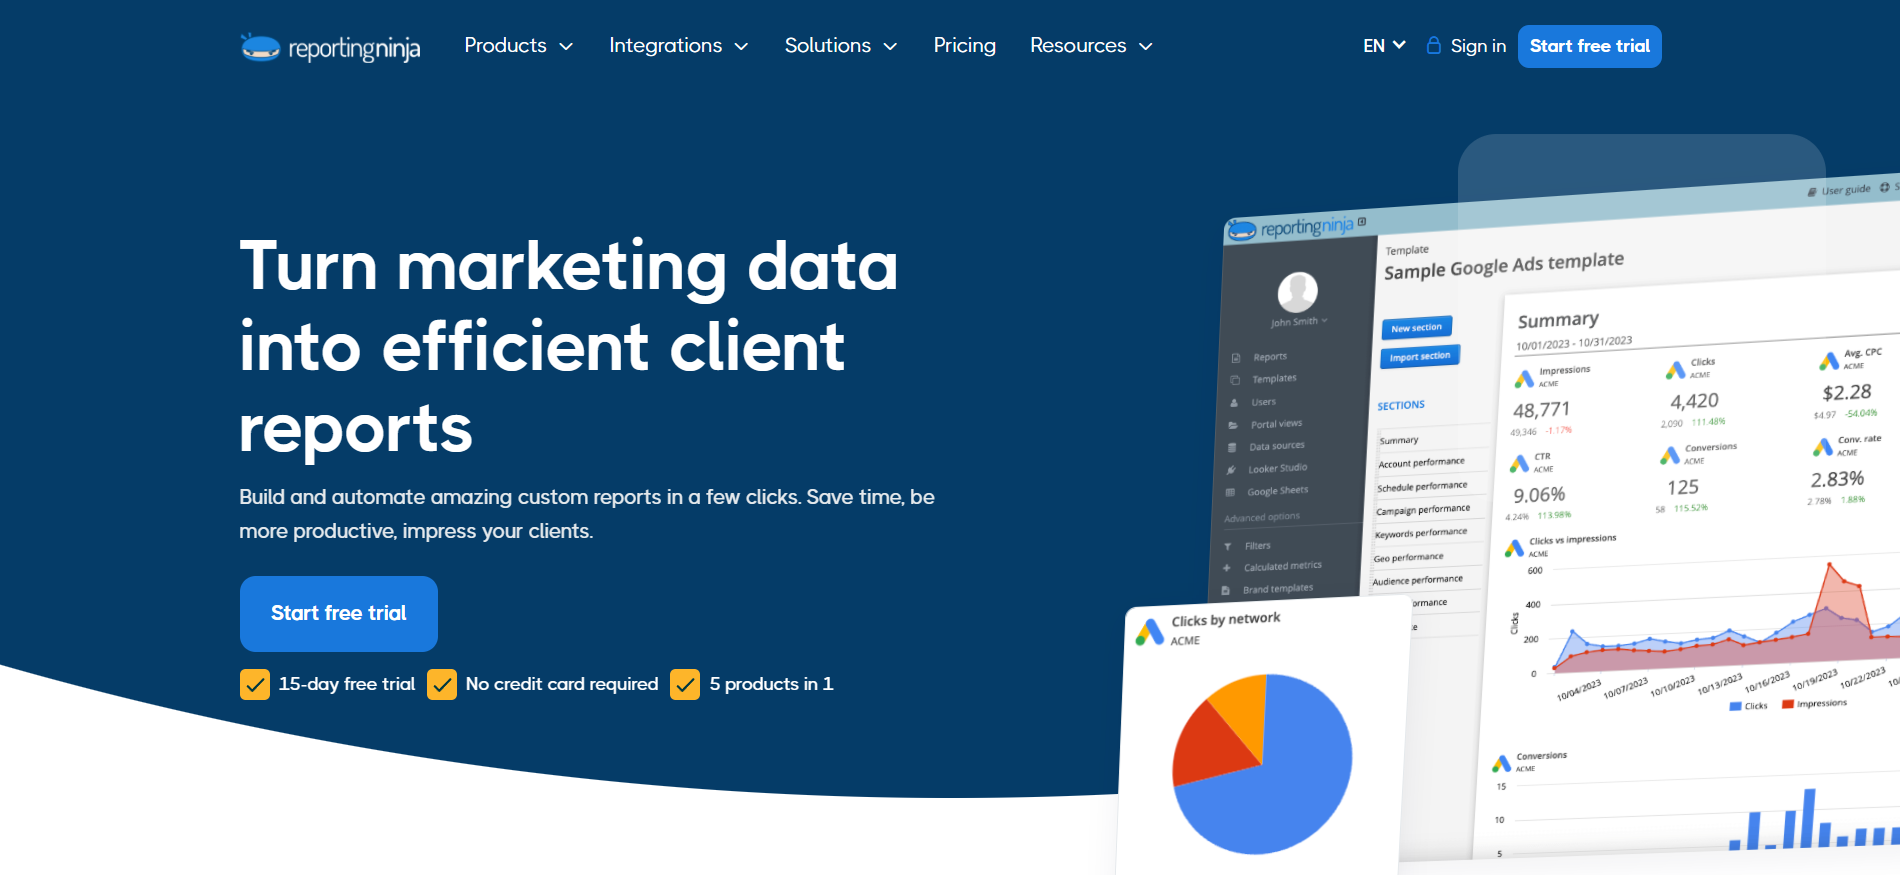
We built Reporting Ninja for freelancers, small agencies, and lean in-house teams who don't want to rebuild the same client report every month. Connect your sources once, then reports refresh and send on the schedule you set.
Every paid plan includes the full range of features:
The same connections feed all of them, so SEO sits next to paid search, paid social, and analytics in one report. Widgets cover Search Console top pages and queries, GA4 organic sessions, and Google Business Profile calls and direction requests.
Plans start at $20/month billed annually, which covers 10 reports, four users, and 10 accounts of each integration type. The platform is self-serve, with a 15-day trial and no credit card or demo call required.
Every integration and every reporting destination is included from the first plan. Start your free trial and ship your first client report today on Reporting Ninja.
{{cta-block-v1}}
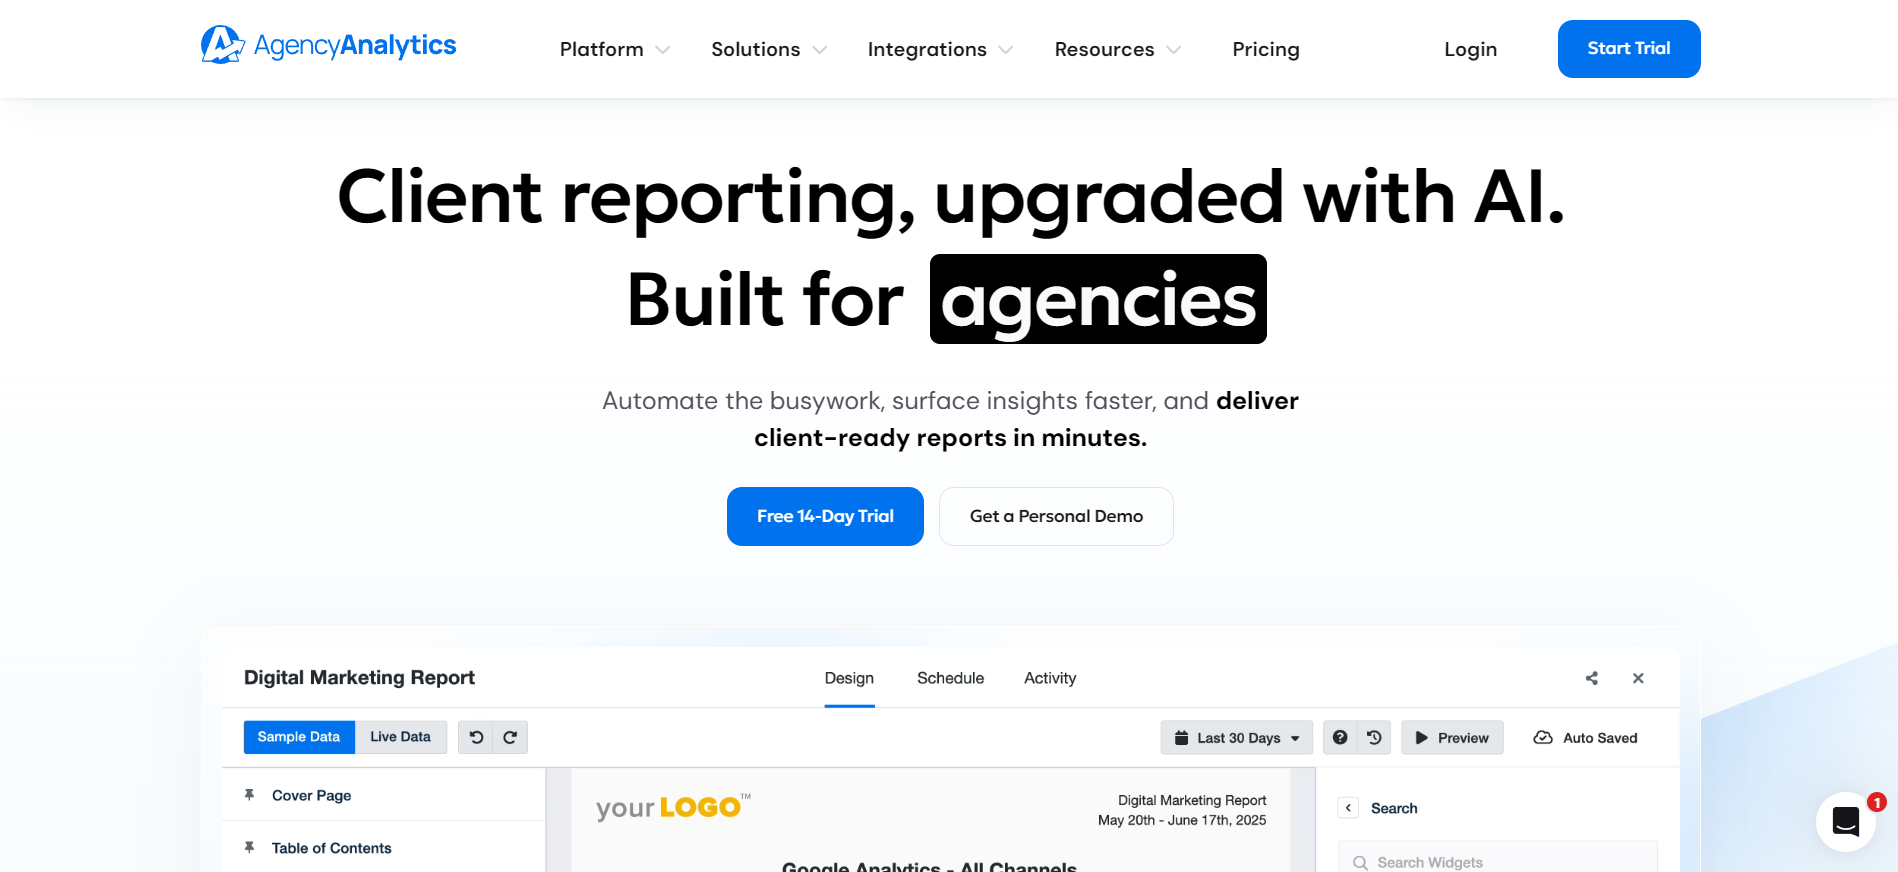
AgencyAnalytics suits agencies that want each client in a branded portal on their own domain. It connects 85+ data sources, and reporting, dashboards, alerts, goal tracking, API access, and white-labeling all sit on a single plan.
Pricing is per client at $20 per client per month billed annually, with unlimited staff and client users. That's good value when each client connects several channels and expensive when you run a long list of small single-channel accounts. Rank tracking is a paid add-on at $41.67 a month per 500 keywords billed annually.
It fits agencies with five to 25 clients, and there's a 14-day trial with no card required. You should compare it against other automated reporting tools before you decide.
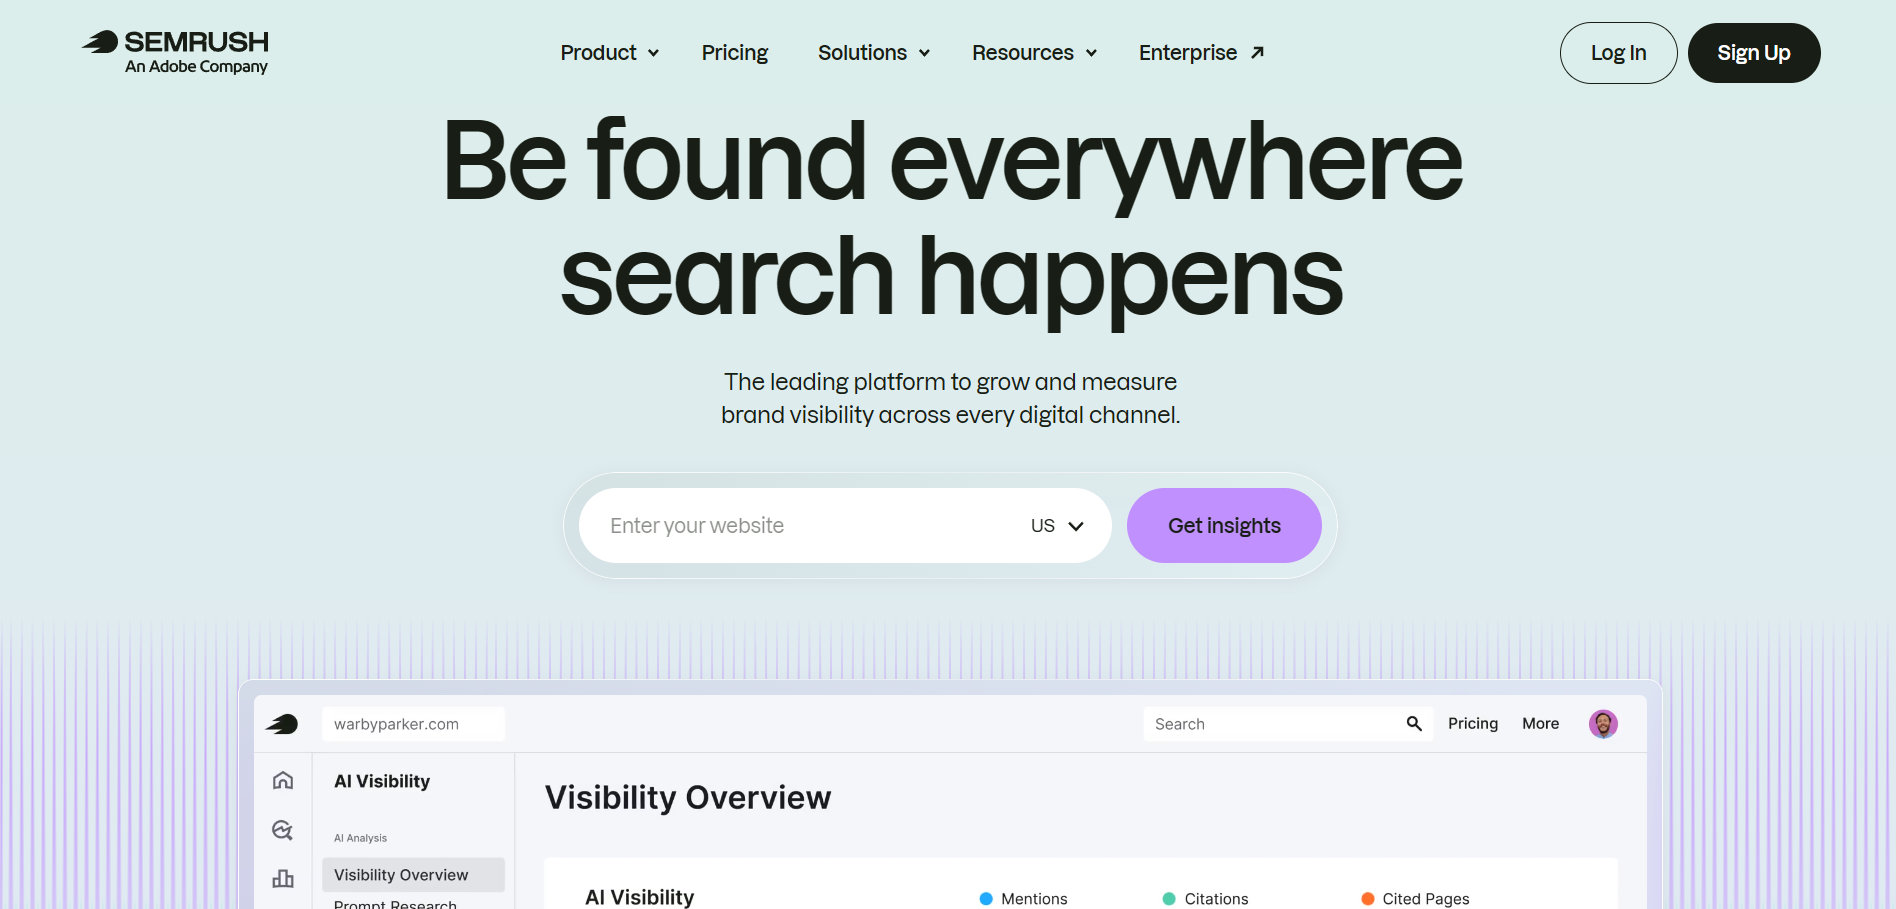
Semrush makes the data as well as the report. The My Reports feature collects live data from Semrush and 20+ other tools, including GA4 and Google Ads. You can start from a template, brand it, and schedule it daily, weekly, or monthly. It also provides plain-language summaries of the numbers.
Reporting is an add-on rather than part of the plan. Base Report costs $10/month, and Pro Report costs $20/month with external integrations, white-labeling, and AI summaries. Both are available on top of an SEO plan starting at $117.33/month billed annually.
It makes sense for teams already paying for Semrush. But, if reports are all you need, compare purpose-built SEO reporting software first.
Even experienced marketers can fall into reporting habits that make clients less confident. Here are some of the common SEO reporting mistakes that marketers need to avoid.
Every month spent rebuilding the same report manually is time you could spend analyzing performance or improving campaigns. Whether you send detailed monthly reports, executive summaries, or white-label dashboards, the goal is still to help clients understand what changed, why it matters, and what happens next.
With no extra add-on fees as you scale and all channels in one workflow, start your free 15-day trial and build your first client-ready report with Reporting Ninja today.
{{cta-block-v1}}
It depends on the audience. An executive summary often fits on one page, while a full monthly report typically runs several pages to cover all core components.
Most agencies report monthly, though some clients on faster-moving campaigns prefer biweekly updates alongside the standard monthly report.
Unlike a dashboard, an SEO report captures performance during a specific reporting period. A dashboard usually provides continuously updated data for ongoing monitoring.
Yes, several reporting platforms, including Reporting Ninja, offer free templates you can customize with your own branding and data.
Sign up for a 15 days free trial. No credit card required.

Build and automate amazing custom reports in a few clicks. Save time, be more productive, impress your clients.